
|
|||||
|
 | |
| |
| |
| |
| |
| |
|
Gene: RNF157 |
Gene summary for RNF157 |
| Gene information | Species | Human | Gene symbol | RNF157 | Gene ID | 114804 |
| Gene name | ring finger protein 157 | |
| Gene Alias | RNF157 | |
| Cytomap | 17q25.1 | |
| Gene Type | protein-coding | GO ID | GO:0000902 | UniProtAcc | Q96PX1 |
Top |
Malignant transformation analysis |
| Identification of the aberrant gene expression in precancerous and cancerous lesions by comparing the gene expression of stem-like cells in diseased tissues with normal stem cells |
| Entrez ID | Symbol | Replicates | Species | Organ | Tissue | Adj P-value | Log2FC | Malignancy |
| 114804 | RNF157 | HTA11_3410_2000001011 | Human | Colorectum | AD | 1.10e-14 | -5.73e-01 | 0.0155 |
| 114804 | RNF157 | HTA11_78_2000001011 | Human | Colorectum | AD | 1.06e-04 | -5.06e-01 | -0.1088 |
| 114804 | RNF157 | HTA11_696_2000001011 | Human | Colorectum | AD | 8.37e-05 | -3.51e-01 | -0.1464 |
| 114804 | RNF157 | HTA11_5212_2000001011 | Human | Colorectum | AD | 7.80e-03 | -6.29e-01 | -0.2061 |
| 114804 | RNF157 | HTA11_546_2000001011 | Human | Colorectum | AD | 8.84e-03 | -5.01e-01 | -0.0842 |
| 114804 | RNF157 | HTA11_10711_2000001011 | Human | Colorectum | AD | 1.95e-04 | -4.22e-01 | 0.0338 |
| 114804 | RNF157 | HTA11_7696_3000711011 | Human | Colorectum | AD | 1.33e-02 | -4.38e-01 | 0.0674 |
| 114804 | RNF157 | HTA11_99999970781_79442 | Human | Colorectum | MSS | 4.16e-09 | -4.52e-01 | 0.294 |
| 114804 | RNF157 | HTA11_99999974143_84620 | Human | Colorectum | MSS | 1.46e-02 | -3.07e-01 | 0.3005 |
| 114804 | RNF157 | F007 | Human | Colorectum | FAP | 1.13e-12 | -6.95e-01 | 0.1176 |
| 114804 | RNF157 | A002-C-010 | Human | Colorectum | FAP | 4.29e-18 | -4.90e-01 | 0.242 |
| 114804 | RNF157 | A001-C-207 | Human | Colorectum | FAP | 6.27e-22 | -7.26e-01 | 0.1278 |
| 114804 | RNF157 | A015-C-203 | Human | Colorectum | FAP | 1.09e-32 | -7.04e-01 | -0.1294 |
| 114804 | RNF157 | A015-C-204 | Human | Colorectum | FAP | 3.17e-25 | -7.60e-01 | -0.0228 |
| 114804 | RNF157 | A014-C-040 | Human | Colorectum | FAP | 3.67e-04 | -5.04e-01 | -0.1184 |
| 114804 | RNF157 | A002-C-201 | Human | Colorectum | FAP | 9.69e-28 | -6.94e-01 | 0.0324 |
| 114804 | RNF157 | A002-C-203 | Human | Colorectum | FAP | 7.16e-15 | -5.63e-01 | 0.2786 |
| 114804 | RNF157 | A001-C-119 | Human | Colorectum | FAP | 1.55e-20 | -7.56e-01 | -0.1557 |
| 114804 | RNF157 | A001-C-108 | Human | Colorectum | FAP | 4.50e-31 | -7.21e-01 | -0.0272 |
| 114804 | RNF157 | A002-C-205 | Human | Colorectum | FAP | 3.08e-28 | -6.81e-01 | -0.1236 |
| Page: 1 2 3 |
| Tissue | Expression Dynamics | Abbreviation |
| Colorectum (GSE201348) |  | FAP: Familial adenomatous polyposis |
| CRC: Colorectal cancer | ||
| Colorectum (HTA11) |  | AD: Adenomas |
| SER: Sessile serrated lesions | ||
| MSI-H: Microsatellite-high colorectal cancer | ||
| MSS: Microsatellite stable colorectal cancer | ||
| Liver | 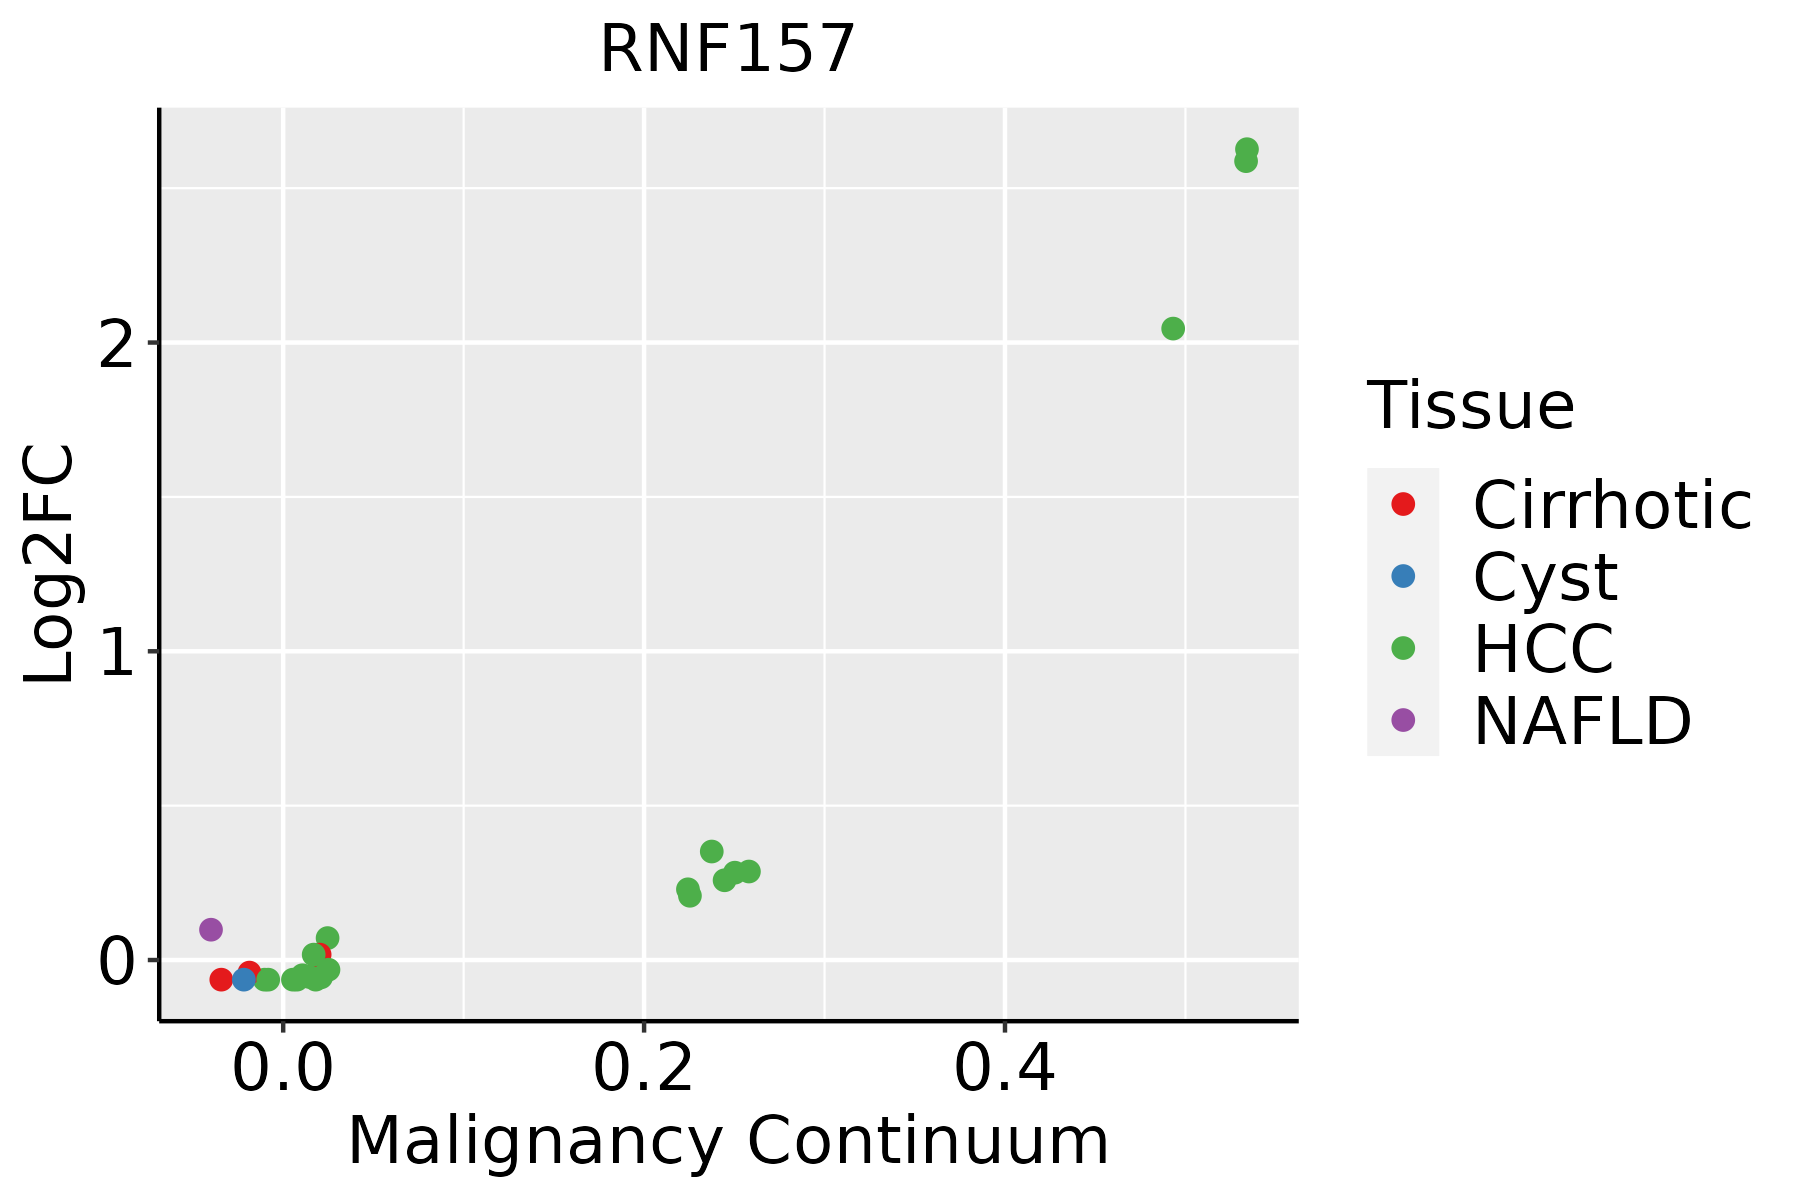 | HCC: Hepatocellular carcinoma |
| NAFLD: Non-alcoholic fatty liver disease |
| ∗log2FC in expression of this searched gene in stem-like cells from each diseased tissue sample relative to stem-like cells in normal samples in each tissue plotted against the malignancy continuum. Samples are colored based on if they are from different disease stage. |
Top |
Malignant transformation related pathway analysis |
| Find out the enriched GO biological processes and KEGG pathways involved in transition from healthy to precancer to cancer |
| Tissue | Disease Stage | Enriched GO biological Processes |
| Colorectum | AD |  |
| Colorectum | SER |  |
| Colorectum | MSS |  |
| Colorectum | MSI-H |  |
| Colorectum | FAP |  |
| ∗Top 15 enriched GO BP terms are showed in the bar plot of each disease state in each tissue. Each row represents a significant GO biological process which is colored according to the -log10(p.adjust). |
| Page: 1 2 3 4 5 6 7 8 9 |
| GO ID | Tissue | Disease Stage | Description | Gene Ratio | Bg Ratio | pvalue | p.adjust | Count |
| GO:0022604 | Colorectum | AD | regulation of cell morphogenesis | 109/3918 | 309/18723 | 3.08e-09 | 2.07e-07 | 109 |
| GO:0007034 | Colorectum | AD | vacuolar transport | 60/3918 | 157/18723 | 4.97e-07 | 1.85e-05 | 60 |
| GO:0016049 | Colorectum | AD | cell growth | 143/3918 | 482/18723 | 2.83e-06 | 8.09e-05 | 143 |
| GO:0001558 | Colorectum | AD | regulation of cell growth | 124/3918 | 414/18723 | 7.67e-06 | 1.86e-04 | 124 |
| GO:0007041 | Colorectum | AD | lysosomal transport | 42/3918 | 114/18723 | 6.61e-05 | 1.07e-03 | 42 |
| GO:0030307 | Colorectum | AD | positive regulation of cell growth | 54/3918 | 166/18723 | 3.08e-04 | 3.69e-03 | 54 |
| GO:0045927 | Colorectum | AD | positive regulation of growth | 77/3918 | 259/18723 | 4.82e-04 | 5.27e-03 | 77 |
| GO:0051865 | Colorectum | AD | protein autoubiquitination | 28/3918 | 73/18723 | 4.87e-04 | 5.30e-03 | 28 |
| GO:0048638 | Colorectum | AD | regulation of developmental growth | 92/3918 | 330/18723 | 1.48e-03 | 1.25e-02 | 92 |
| GO:0048588 | Colorectum | AD | developmental cell growth | 67/3918 | 234/18723 | 3.03e-03 | 2.25e-02 | 67 |
| GO:0048639 | Colorectum | AD | positive regulation of developmental growth | 52/3918 | 174/18723 | 3.24e-03 | 2.38e-02 | 52 |
| GO:0060560 | Colorectum | AD | developmental growth involved in morphogenesis | 66/3918 | 234/18723 | 4.75e-03 | 3.22e-02 | 66 |
| GO:00226042 | Colorectum | MSS | regulation of cell morphogenesis | 103/3467 | 309/18723 | 2.70e-10 | 2.56e-08 | 103 |
| GO:00070342 | Colorectum | MSS | vacuolar transport | 52/3467 | 157/18723 | 8.25e-06 | 2.07e-04 | 52 |
| GO:00160492 | Colorectum | MSS | cell growth | 123/3467 | 482/18723 | 7.15e-05 | 1.21e-03 | 123 |
| GO:00015582 | Colorectum | MSS | regulation of cell growth | 105/3467 | 414/18723 | 2.97e-04 | 3.90e-03 | 105 |
| GO:00070411 | Colorectum | MSS | lysosomal transport | 36/3467 | 114/18723 | 5.38e-04 | 6.04e-03 | 36 |
| GO:00518651 | Colorectum | MSS | protein autoubiquitination | 25/3467 | 73/18723 | 1.00e-03 | 1.00e-02 | 25 |
| GO:00486381 | Colorectum | MSS | regulation of developmental growth | 84/3467 | 330/18723 | 1.01e-03 | 1.01e-02 | 84 |
| GO:00486391 | Colorectum | MSS | positive regulation of developmental growth | 49/3467 | 174/18723 | 1.17e-03 | 1.13e-02 | 49 |
| Page: 1 2 3 4 |
| Pathway ID | Tissue | Disease Stage | Description | Gene Ratio | Bg Ratio | pvalue | p.adjust | qvalue | Count |
| Page: 1 |
Top |
Cell-cell communication analysis |
| Identification of potential cell-cell interactions between two cell types and their ligand-receptor pairs for different disease states |
| Ligand | Receptor | LRpair | Pathway | Tissue | Disease Stage |
| Page: 1 |
Top |
Single-cell gene regulatory network inference analysis |
| Find out the significant the regulons (TFs) and the target genes of each regulon across cell types for different disease states |
| TF | Cell Type | Tissue | Disease Stage | Target Gene | RSS | Regulon Activity |
| ∗The dot plots of a searched regulon are shown for all cell subpopulations in each disease state of each tissue based on the regulon specific score inferred using pySCENIC and by calculating the average expression. |
| Page: 1 |
Top |
Somatic mutation of malignant transformation related genes |
| Annotation of somatic variants for genes involved in malignant transformation |
| Hugo Symbol | Variant Class | Variant Classification | dbSNP RS | HGVSc | HGVSp | HGVSp Short | SWISSPROT | BIOTYPE | SIFT | PolyPhen | Tumor Sample Barcode | Tissue | Histology | Sex | Age | Stage | Therapy Types | Drugs | Outcome |
| RNF157 | SNV | Missense_Mutation | c.1169N>A | p.Gly390Glu | p.G390E | Q96PX1 | protein_coding | tolerated(0.29) | benign(0.028) | TCGA-BH-A0HI-01 | Breast | breast invasive carcinoma | Female | >=65 | I/II | Hormone Therapy | arimidex | SD | |
| RNF157 | SNV | Missense_Mutation | c.1382N>T | p.Ser461Phe | p.S461F | Q96PX1 | protein_coding | deleterious_low_confidence(0.03) | benign(0.189) | TCGA-BH-A18P-01 | Breast | breast invasive carcinoma | Female | <65 | I/II | Unknown | Unknown | PD | |
| RNF157 | SNV | Missense_Mutation | novel | c.89N>A | p.Gly30Glu | p.G30E | Q96PX1 | protein_coding | deleterious(0) | possibly_damaging(0.659) | TCGA-BH-A1FN-01 | Breast | breast invasive carcinoma | Female | <65 | I/II | Unknown | Unknown | PD |
| RNF157 | SNV | Missense_Mutation | rs770686501 | c.1802C>T | p.Thr601Met | p.T601M | Q96PX1 | protein_coding | deleterious_low_confidence(0.04) | benign(0.23) | TCGA-E9-A1N9-01 | Breast | breast invasive carcinoma | Female | <65 | I/II | Chemotherapy | doxorubicin | SD |
| RNF157 | insertion | Nonsense_Mutation | novel | c.1203_1204insACTTAAGAAAACTCTGATGAGACAA | p.Gly402ThrfsTer2 | p.G402Tfs*2 | Q96PX1 | protein_coding | TCGA-BH-A0EE-01 | Breast | breast invasive carcinoma | Female | >=65 | I/II | Chemotherapy | docetaxel | SD | ||
| RNF157 | SNV | Missense_Mutation | rs201662506 | c.1969N>T | p.Arg657Trp | p.R657W | Q96PX1 | protein_coding | tolerated_low_confidence(0.06) | benign(0) | TCGA-2W-A8YY-01 | Cervix | cervical & endocervical cancer | Female | <65 | I/II | Chemotherapy | cisplatin | CR |
| RNF157 | SNV | Missense_Mutation | novel | c.1595N>C | p.Val532Ala | p.V532A | Q96PX1 | protein_coding | deleterious_low_confidence(0) | benign(0.05) | TCGA-2W-A8YY-01 | Cervix | cervical & endocervical cancer | Female | <65 | I/II | Chemotherapy | cisplatin | CR |
| RNF157 | SNV | Missense_Mutation | rs763071977 | c.911N>T | p.Thr304Met | p.T304M | Q96PX1 | protein_coding | deleterious(0.01) | probably_damaging(0.985) | TCGA-2W-A8YY-01 | Cervix | cervical & endocervical cancer | Female | <65 | I/II | Chemotherapy | cisplatin | CR |
| RNF157 | SNV | Missense_Mutation | c.464N>T | p.Ser155Ile | p.S155I | Q96PX1 | protein_coding | tolerated(0.07) | benign(0.09) | TCGA-FU-A3HZ-01 | Cervix | cervical & endocervical cancer | Female | <65 | I/II | Chemotherapy | cisplatin | CR | |
| RNF157 | SNV | Missense_Mutation | rs201739916 | c.272N>A | p.Arg91Gln | p.R91Q | Q96PX1 | protein_coding | deleterious(0) | probably_damaging(0.982) | TCGA-VS-A9UI-01 | Cervix | cervical & endocervical cancer | Female | >=65 | I/II | Unknown | Unknown | SD |
| Page: 1 2 3 4 5 6 |
Top |
Related drugs of malignant transformation related genes |
| Identification of chemicals and drugs interact with genes involved in malignant transfromation |
| (DGIdb 4.0) |
| Entrez ID | Symbol | Category | Interaction Types | Drug Claim Name | Drug Name | PMIDs |
| Page: 1 |

Copyright 2023-Present -The University of Texas Health Science Center at Houston |