
|
|||||
|
 | |
| |
| |
| |
| |
| |
|
Gene: RNF152 |
Gene summary for RNF152 |
| Gene information | Species | Human | Gene symbol | RNF152 | Gene ID | 220441 |
| Gene name | ring finger protein 152 | |
| Gene Alias | RNF152 | |
| Cytomap | 18q21.33 | |
| Gene Type | protein-coding | GO ID | GO:0000209 | UniProtAcc | Q8N8N0 |
Top |
Malignant transformation analysis |
| Identification of the aberrant gene expression in precancerous and cancerous lesions by comparing the gene expression of stem-like cells in diseased tissues with normal stem cells |
| Entrez ID | Symbol | Replicates | Species | Organ | Tissue | Adj P-value | Log2FC | Malignancy |
| 220441 | RNF152 | HTA11_3410_2000001011 | Human | Colorectum | AD | 8.94e-16 | -6.03e-01 | 0.0155 |
| 220441 | RNF152 | HTA11_2951_2000001011 | Human | Colorectum | AD | 7.79e-03 | -6.63e-01 | 0.0216 |
| 220441 | RNF152 | HTA11_1938_2000001011 | Human | Colorectum | AD | 2.35e-07 | -6.24e-01 | -0.0811 |
| 220441 | RNF152 | HTA11_78_2000001011 | Human | Colorectum | AD | 6.00e-04 | -4.73e-01 | -0.1088 |
| 220441 | RNF152 | HTA11_3361_2000001011 | Human | Colorectum | AD | 2.41e-04 | -5.18e-01 | -0.1207 |
| 220441 | RNF152 | HTA11_696_2000001011 | Human | Colorectum | AD | 2.30e-09 | -4.46e-01 | -0.1464 |
| 220441 | RNF152 | HTA11_866_2000001011 | Human | Colorectum | AD | 2.19e-08 | -4.87e-01 | -0.1001 |
| 220441 | RNF152 | HTA11_1391_2000001011 | Human | Colorectum | AD | 7.29e-09 | -5.39e-01 | -0.059 |
| 220441 | RNF152 | HTA11_546_2000001011 | Human | Colorectum | AD | 9.14e-03 | -4.64e-01 | -0.0842 |
| 220441 | RNF152 | HTA11_866_3004761011 | Human | Colorectum | AD | 1.81e-14 | -6.06e-01 | 0.096 |
| 220441 | RNF152 | HTA11_8622_2000001021 | Human | Colorectum | SER | 1.89e-02 | -6.15e-01 | 0.0528 |
| 220441 | RNF152 | HTA11_10711_2000001011 | Human | Colorectum | AD | 9.49e-10 | -6.31e-01 | 0.0338 |
| 220441 | RNF152 | HTA11_7696_3000711011 | Human | Colorectum | AD | 7.84e-20 | -6.19e-01 | 0.0674 |
| 220441 | RNF152 | HTA11_6818_2000001021 | Human | Colorectum | AD | 5.81e-05 | -5.56e-01 | 0.0588 |
| 220441 | RNF152 | HTA11_99999970781_79442 | Human | Colorectum | MSS | 1.85e-26 | -6.33e-01 | 0.294 |
| 220441 | RNF152 | HTA11_99999965104_69814 | Human | Colorectum | MSS | 8.98e-08 | -6.25e-01 | 0.281 |
| 220441 | RNF152 | HTA11_99999971662_82457 | Human | Colorectum | MSS | 2.82e-27 | -6.52e-01 | 0.3859 |
| 220441 | RNF152 | HTA11_99999973899_84307 | Human | Colorectum | MSS | 1.39e-06 | -6.47e-01 | 0.2585 |
| 220441 | RNF152 | HTA11_99999974143_84620 | Human | Colorectum | MSS | 8.39e-34 | -6.63e-01 | 0.3005 |
| 220441 | RNF152 | F007 | Human | Colorectum | FAP | 1.27e-09 | -5.97e-01 | 0.1176 |
| Page: 1 2 3 4 |
| Tissue | Expression Dynamics | Abbreviation |
| Colorectum (GSE201348) |  | FAP: Familial adenomatous polyposis |
| CRC: Colorectal cancer | ||
| Colorectum (HTA11) |  | AD: Adenomas |
| SER: Sessile serrated lesions | ||
| MSI-H: Microsatellite-high colorectal cancer | ||
| MSS: Microsatellite stable colorectal cancer | ||
| Liver | 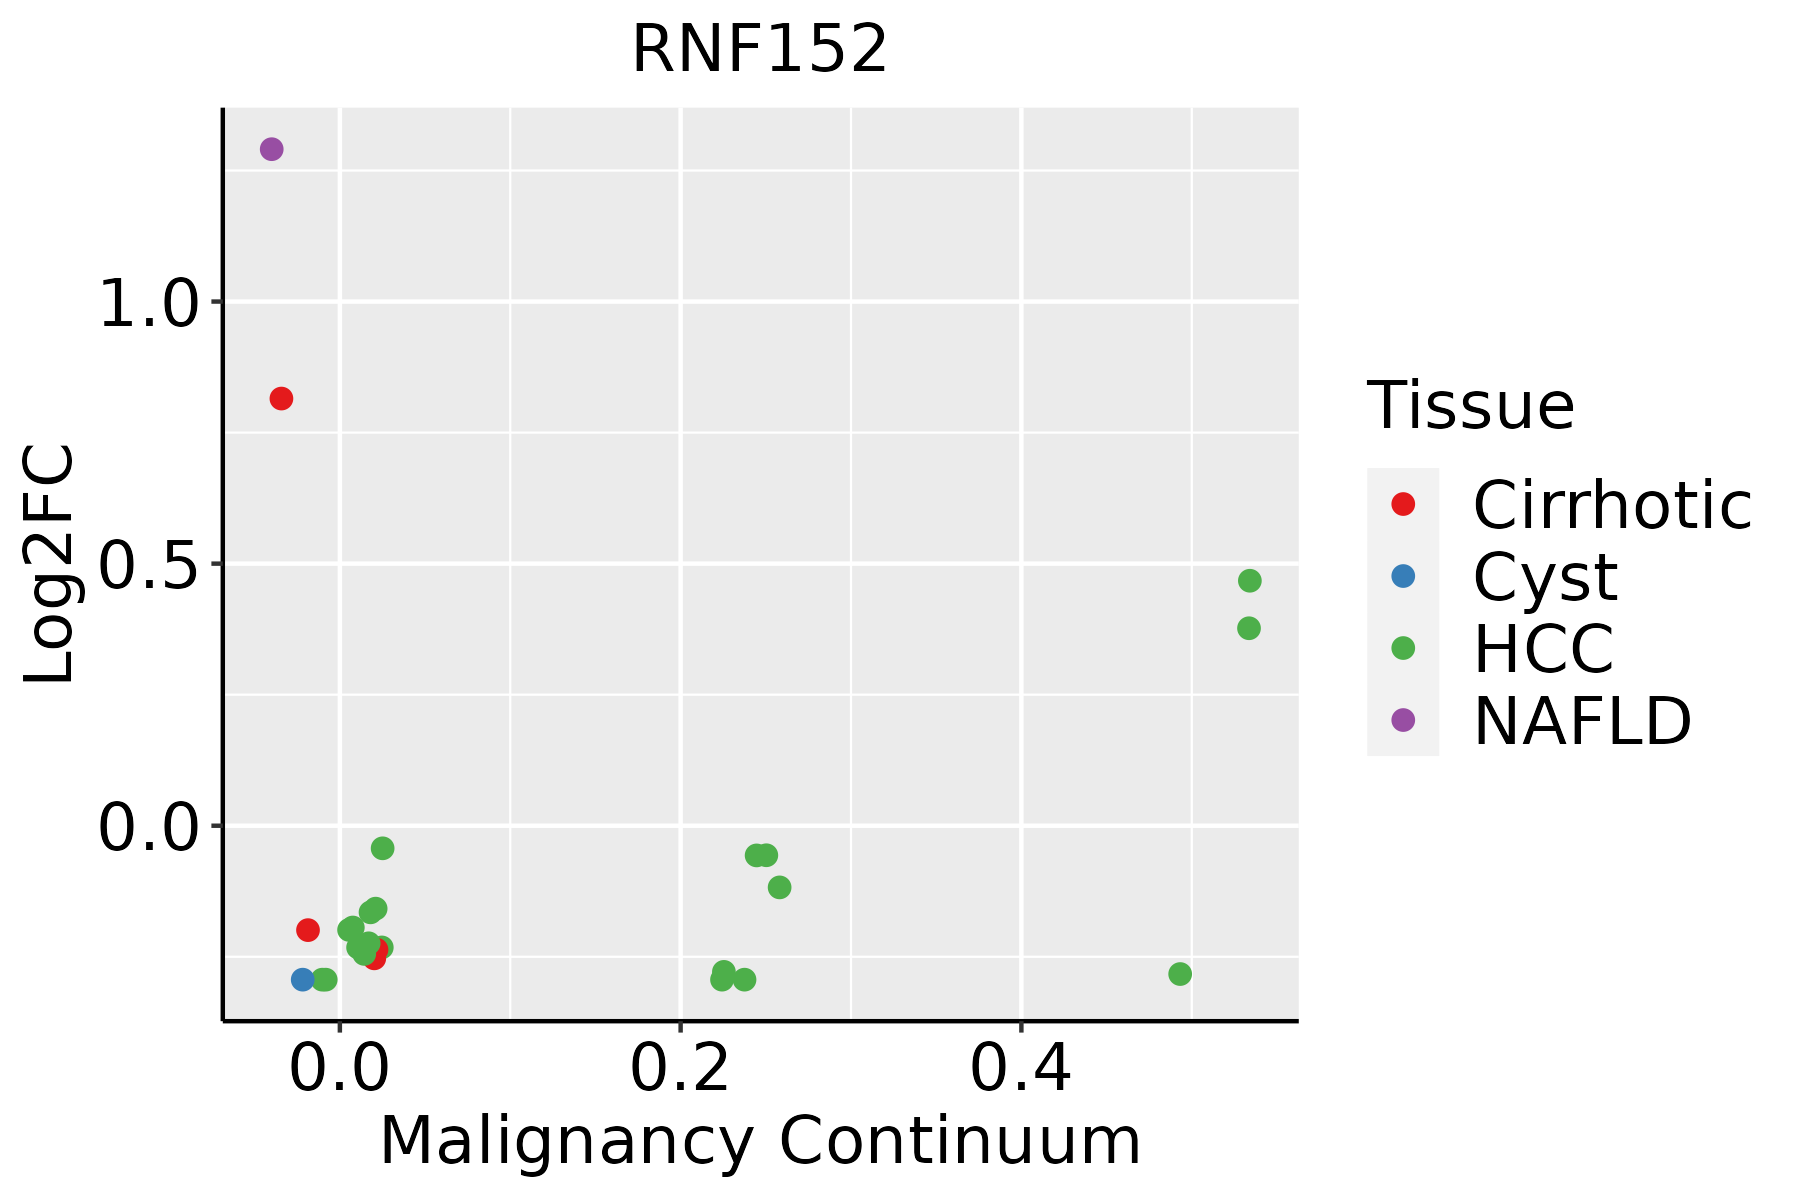 | HCC: Hepatocellular carcinoma |
| NAFLD: Non-alcoholic fatty liver disease | ||
| Skin | 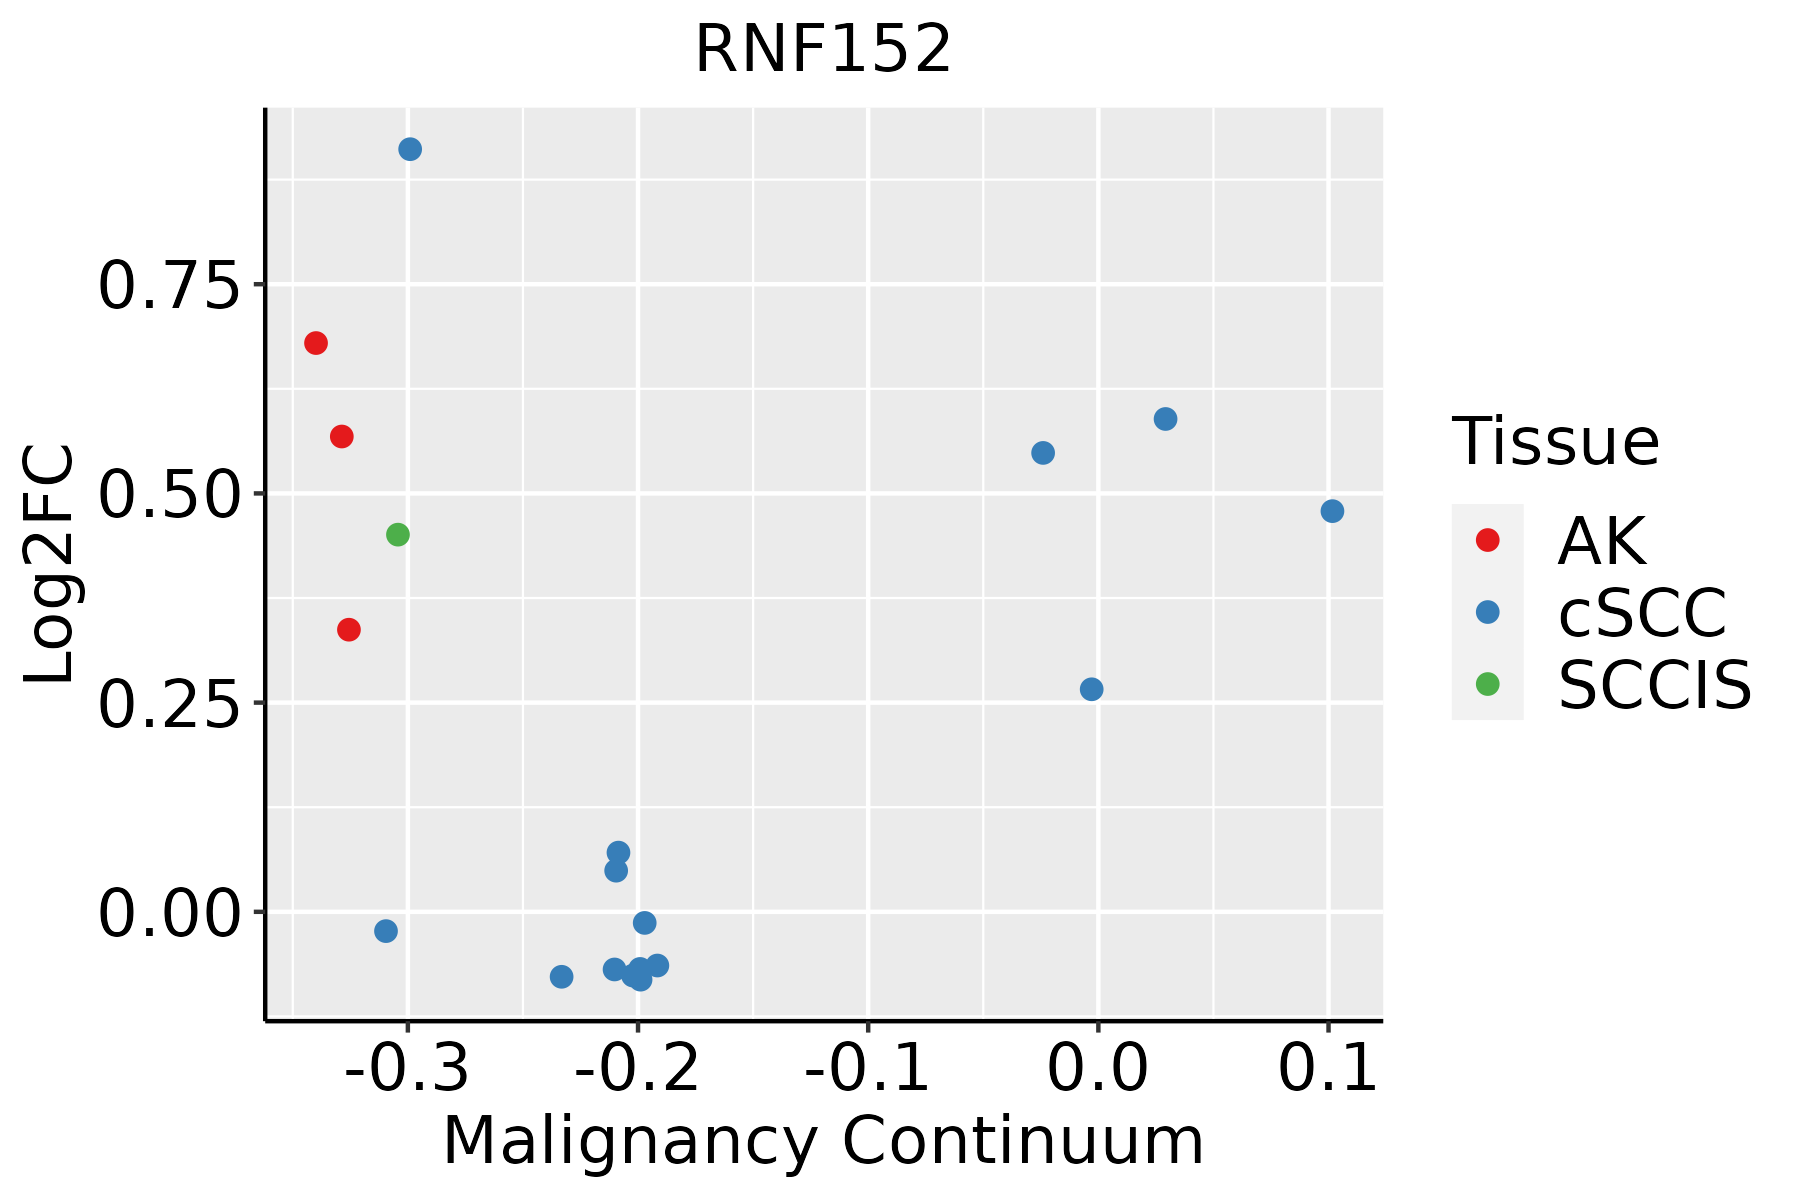 | AK: Actinic keratosis |
| cSCC: Cutaneous squamous cell carcinoma | ||
| SCCIS:squamous cell carcinoma in situ | ||
| Thyroid |  | ATC: Anaplastic thyroid cancer |
| HT: Hashimoto's thyroiditis | ||
| PTC: Papillary thyroid cancer |
| ∗log2FC in expression of this searched gene in stem-like cells from each diseased tissue sample relative to stem-like cells in normal samples in each tissue plotted against the malignancy continuum. Samples are colored based on if they are from different disease stage. |
Top |
Malignant transformation related pathway analysis |
| Find out the enriched GO biological processes and KEGG pathways involved in transition from healthy to precancer to cancer |
| Tissue | Disease Stage | Enriched GO biological Processes |
| Colorectum | AD |  |
| Colorectum | SER |  |
| Colorectum | MSS |  |
| Colorectum | MSI-H |  |
| Colorectum | FAP |  |
| ∗Top 15 enriched GO BP terms are showed in the bar plot of each disease state in each tissue. Each row represents a significant GO biological process which is colored according to the -log10(p.adjust). |
| Page: 1 2 3 4 5 6 7 8 9 |
| GO ID | Tissue | Disease Stage | Description | Gene Ratio | Bg Ratio | pvalue | p.adjust | Count |
| GO:0009896 | Colorectum | AD | positive regulation of catabolic process | 180/3918 | 492/18723 | 4.33e-16 | 1.94e-13 | 180 |
| GO:0031331 | Colorectum | AD | positive regulation of cellular catabolic process | 156/3918 | 427/18723 | 4.68e-14 | 1.05e-11 | 156 |
| GO:0010506 | Colorectum | AD | regulation of autophagy | 111/3918 | 317/18723 | 3.57e-09 | 2.35e-07 | 111 |
| GO:0000209 | Colorectum | AD | protein polyubiquitination | 78/3918 | 236/18723 | 8.71e-06 | 2.06e-04 | 78 |
| GO:0031667 | Colorectum | AD | response to nutrient levels | 138/3918 | 474/18723 | 1.22e-05 | 2.68e-04 | 138 |
| GO:0070936 | Colorectum | AD | protein K48-linked ubiquitination | 27/3918 | 65/18723 | 1.31e-04 | 1.88e-03 | 27 |
| GO:0042594 | Colorectum | AD | response to starvation | 63/3918 | 197/18723 | 1.77e-04 | 2.38e-03 | 63 |
| GO:0071496 | Colorectum | AD | cellular response to external stimulus | 94/3918 | 320/18723 | 1.98e-04 | 2.64e-03 | 94 |
| GO:0010508 | Colorectum | AD | positive regulation of autophagy | 43/3918 | 124/18723 | 2.64e-04 | 3.27e-03 | 43 |
| GO:0009267 | Colorectum | AD | cellular response to starvation | 51/3918 | 156/18723 | 3.90e-04 | 4.44e-03 | 51 |
| GO:0031668 | Colorectum | AD | cellular response to extracellular stimulus | 71/3918 | 246/18723 | 1.86e-03 | 1.52e-02 | 71 |
| GO:0031669 | Colorectum | AD | cellular response to nutrient levels | 63/3918 | 215/18723 | 2.19e-03 | 1.73e-02 | 63 |
| GO:0070534 | Colorectum | AD | protein K63-linked ubiquitination | 20/3918 | 56/18723 | 7.57e-03 | 4.58e-02 | 20 |
| GO:00098961 | Colorectum | SER | positive regulation of catabolic process | 132/2897 | 492/18723 | 4.16e-11 | 6.72e-09 | 132 |
| GO:00313311 | Colorectum | SER | positive regulation of cellular catabolic process | 114/2897 | 427/18723 | 1.22e-09 | 1.27e-07 | 114 |
| GO:00316671 | Colorectum | SER | response to nutrient levels | 106/2897 | 474/18723 | 3.94e-05 | 1.00e-03 | 106 |
| GO:00105061 | Colorectum | SER | regulation of autophagy | 74/2897 | 317/18723 | 1.39e-04 | 2.77e-03 | 74 |
| GO:00002091 | Colorectum | SER | protein polyubiquitination | 58/2897 | 236/18723 | 1.69e-04 | 3.18e-03 | 58 |
| GO:00425941 | Colorectum | SER | response to starvation | 47/2897 | 197/18723 | 1.31e-03 | 1.45e-02 | 47 |
| GO:00714961 | Colorectum | SER | cellular response to external stimulus | 70/2897 | 320/18723 | 1.40e-03 | 1.53e-02 | 70 |
| Page: 1 2 3 4 5 6 7 8 |
| Pathway ID | Tissue | Disease Stage | Description | Gene Ratio | Bg Ratio | pvalue | p.adjust | qvalue | Count |
| hsa04150 | Colorectum | MSS | mTOR signaling pathway | 47/1875 | 156/8465 | 1.19e-02 | 3.99e-02 | 2.44e-02 | 47 |
| hsa041501 | Colorectum | MSS | mTOR signaling pathway | 47/1875 | 156/8465 | 1.19e-02 | 3.99e-02 | 2.44e-02 | 47 |
| hsa041502 | Liver | HCC | mTOR signaling pathway | 95/4020 | 156/8465 | 4.70e-04 | 1.99e-03 | 1.11e-03 | 95 |
| hsa0415011 | Liver | HCC | mTOR signaling pathway | 95/4020 | 156/8465 | 4.70e-04 | 1.99e-03 | 1.11e-03 | 95 |
| Page: 1 |
Top |
Cell-cell communication analysis |
| Identification of potential cell-cell interactions between two cell types and their ligand-receptor pairs for different disease states |
| Ligand | Receptor | LRpair | Pathway | Tissue | Disease Stage |
| Page: 1 |
Top |
Single-cell gene regulatory network inference analysis |
| Find out the significant the regulons (TFs) and the target genes of each regulon across cell types for different disease states |
| TF | Cell Type | Tissue | Disease Stage | Target Gene | RSS | Regulon Activity |
| ∗The dot plots of a searched regulon are shown for all cell subpopulations in each disease state of each tissue based on the regulon specific score inferred using pySCENIC and by calculating the average expression. |
| Page: 1 |
Top |
Somatic mutation of malignant transformation related genes |
| Annotation of somatic variants for genes involved in malignant transformation |
| Hugo Symbol | Variant Class | Variant Classification | dbSNP RS | HGVSc | HGVSp | HGVSp Short | SWISSPROT | BIOTYPE | SIFT | PolyPhen | Tumor Sample Barcode | Tissue | Histology | Sex | Age | Stage | Therapy Types | Drugs | Outcome |
| RNF152 | insertion | Frame_Shift_Ins | novel | c.373_374insTATACAAAATACATTTACTTCATTTTAGCAGAAATGGGTTG | p.Ser125IlefsTer23 | p.S125Ifs*23 | Q8N8N0 | protein_coding | TCGA-AO-A0JD-01 | Breast | breast invasive carcinoma | Female | <65 | III/IV | Chemotherapy | cyclophosphamide | SD | ||
| RNF152 | SNV | Missense_Mutation | rs767426822 | c.64N>T | p.Arg22Trp | p.R22W | Q8N8N0 | protein_coding | deleterious(0.04) | probably_damaging(0.996) | TCGA-2W-A8YY-01 | Cervix | cervical & endocervical cancer | Female | <65 | I/II | Chemotherapy | cisplatin | CR |
| RNF152 | SNV | Missense_Mutation | novel | c.553N>G | p.Ile185Val | p.I185V | Q8N8N0 | protein_coding | tolerated(0.18) | possibly_damaging(0.785) | TCGA-EA-A3HU-01 | Cervix | cervical & endocervical cancer | Female | <65 | I/II | Unknown | Unknown | SD |
| RNF152 | SNV | Missense_Mutation | rs565129525 | c.332N>T | p.Ala111Val | p.A111V | Q8N8N0 | protein_coding | tolerated(0.71) | benign(0.024) | TCGA-AA-3713-01 | Colorectum | colon adenocarcinoma | Male | >=65 | III/IV | Chemotherapy | 5-fluorouracil | PR |
| RNF152 | SNV | Missense_Mutation | rs768728944 | c.148N>T | p.Arg50Trp | p.R50W | Q8N8N0 | protein_coding | deleterious(0.03) | probably_damaging(0.996) | TCGA-AA-3821-01 | Colorectum | colon adenocarcinoma | Female | >=65 | I/II | Unknown | Unknown | SD |
| RNF152 | SNV | Missense_Mutation | c.68N>A | p.Arg23His | p.R23H | Q8N8N0 | protein_coding | deleterious(0.02) | probably_damaging(0.995) | TCGA-AA-A02R-01 | Colorectum | colon adenocarcinoma | Female | >=65 | I/II | Unknown | Unknown | PD | |
| RNF152 | SNV | Missense_Mutation | rs565129525 | c.332N>T | p.Ala111Val | p.A111V | Q8N8N0 | protein_coding | tolerated(0.71) | benign(0.024) | TCGA-QG-A5Z2-01 | Colorectum | colon adenocarcinoma | Male | <65 | I/II | Unknown | Unknown | SD |
| RNF152 | SNV | Missense_Mutation | rs780179925 | c.586N>T | p.Arg196Cys | p.R196C | Q8N8N0 | protein_coding | deleterious_low_confidence(0) | probably_damaging(0.985) | TCGA-G5-6572-02 | Colorectum | NA | NA | NA | NA | NA | NA | NA |
| RNF152 | SNV | Missense_Mutation | rs143882510 | c.388N>A | p.Val130Ile | p.V130I | Q8N8N0 | protein_coding | tolerated(0.6) | benign(0) | TCGA-AP-A1DH-01 | Endometrium | uterine corpus endometrioid carcinoma | Female | <65 | I/II | Unknown | Unknown | SD |
| RNF152 | SNV | Missense_Mutation | novel | c.566A>G | p.Asn189Ser | p.N189S | Q8N8N0 | protein_coding | tolerated(0.16) | probably_damaging(0.935) | TCGA-AX-A05Z-01 | Endometrium | uterine corpus endometrioid carcinoma | Female | <65 | III/IV | Chemotherapy | adriamycin | SD |
| Page: 1 2 3 4 |
Top |
Related drugs of malignant transformation related genes |
| Identification of chemicals and drugs interact with genes involved in malignant transfromation |
| (DGIdb 4.0) |
| Entrez ID | Symbol | Category | Interaction Types | Drug Claim Name | Drug Name | PMIDs |
| Page: 1 |

Copyright 2023-Present -The University of Texas Health Science Center at Houston |