Schematic overview of the cellular and molecular mechanisms involved in the cancer progression, including the proposed cellular and molecular mechanisms in cancer cells trajectory. AT1: alveolar type 1 cells; AT2: alveolar type 2 cells; AAH: atypical adenomatous hyperplasia; AIS: adenocarcinoma in situ; MIA: minimally invasive adenocarcinoma; IA: invasive adenocarcinoma; EMT: epithelial-mesenchymal transition

Home

Download

Statistics

Help

Contact

Center for Computational Systems Medicine
leaf

Gene summary

leaf

Malignant transformation analysis

leaf

Malignant transformation related pathway analysis

leaf

Cell-cell communication analysis

leaf

Single-cell gene regulatory network inference analysis

leaf

Somatic mutation of malignant transformation related genes

leaf

Related drugs of malignant transformation related genes

Gene: RNF149

Gene summary for RNF149

check button Gene summary.

Gene informationSpeciesHuman
Gene symbol

RNF149

Gene ID

284996

Gene namering finger protein 149
Gene AliasDNAPTP2
Cytomap2q11.2
Gene Typeprotein-coding
GO ID

GO:0000165

UniProtAcc

Q8NC42


Top

Malignant transformation analysis

check button Identification of the aberrant gene expression in precancerous and cancerous lesions by comparing the gene expression of stem-like cells in diseased tissues with normal stem cells
check button Malignant transformation involving gene list.
Entrez IDSymbolReplicatesSpeciesOrganTissueAdj P-valueLog2FCMalignancy
284996RNF149HTA11_347_2000001011HumanColorectumAD1.61e-064.46e-01-0.1954
284996RNF149HTA11_411_2000001011HumanColorectumSER7.39e-048.45e-01-0.2602
284996RNF149HTA11_1391_2000001011HumanColorectumAD1.89e-034.57e-01-0.059
284996RNF149HTA11_99999970781_79442HumanColorectumMSS1.45e-044.55e-010.294
284996RNF149HTA11_99999971662_82457HumanColorectumMSS1.56e-034.92e-010.3859
284996RNF149A015-C-203HumanColorectumFAP8.98e-21-3.48e-01-0.1294
284996RNF149A015-C-204HumanColorectumFAP2.66e-04-3.00e-01-0.0228
284996RNF149A002-C-201HumanColorectumFAP1.83e-08-2.23e-010.0324
284996RNF149A001-C-108HumanColorectumFAP8.02e-13-2.52e-01-0.0272
284996RNF149A002-C-205HumanColorectumFAP1.04e-13-3.06e-01-0.1236
284996RNF149A001-C-104HumanColorectumFAP3.02e-02-1.62e-010.0184
284996RNF149A015-C-006HumanColorectumFAP2.00e-11-3.19e-02-0.0994
284996RNF149A015-C-106HumanColorectumFAP2.51e-06-2.09e-01-0.0511
284996RNF149A002-C-114HumanColorectumFAP2.16e-10-2.75e-01-0.1561
284996RNF149A015-C-104HumanColorectumFAP8.31e-25-1.47e-01-0.1899
284996RNF149A001-C-014HumanColorectumFAP2.23e-10-1.74e-010.0135
284996RNF149A002-C-016HumanColorectumFAP1.67e-15-2.98e-010.0521
284996RNF149A015-C-002HumanColorectumFAP5.40e-07-2.87e-01-0.0763
284996RNF149A001-C-203HumanColorectumFAP5.87e-09-2.24e-01-0.0481
284996RNF149A002-C-116HumanColorectumFAP3.84e-26-2.71e-01-0.0452
Page: 1 2 3 4 5 6 7 8 

check button Transcriptomic changes along malignancy continuum.
TissueExpression DynamicsAbbreviation
Colorectum (GSE201348)The image shows the transcriptomic changes along malignancy continuum.log2FC in expression of this searched gene in stem-like cells from each diseased tissue sample relative to stem-like cells in normal samples in each tissue plotted against the malignancy continuum. Samples are colored based on if they are from different disease stage.FAP: Familial adenomatous polyposis
CRC: Colorectal cancer
Colorectum (HTA11)The image shows the transcriptomic changes along malignancy continuum.log2FC in expression of this searched gene in stem-like cells from each diseased tissue sample relative to stem-like cells in normal samples in each tissue plotted against the malignancy continuum. Samples are colored based on if they are from different disease stage.AD: Adenomas
SER: Sessile serrated lesions
MSI-H: Microsatellite-high colorectal cancer
MSS: Microsatellite stable colorectal cancer
EsophagusThe image shows the transcriptomic changes along malignancy continuum.log2FC in expression of this searched gene in stem-like cells from each diseased tissue sample relative to stem-like cells in normal samples in each tissue plotted against the malignancy continuum. Samples are colored based on if they are from different disease stage.
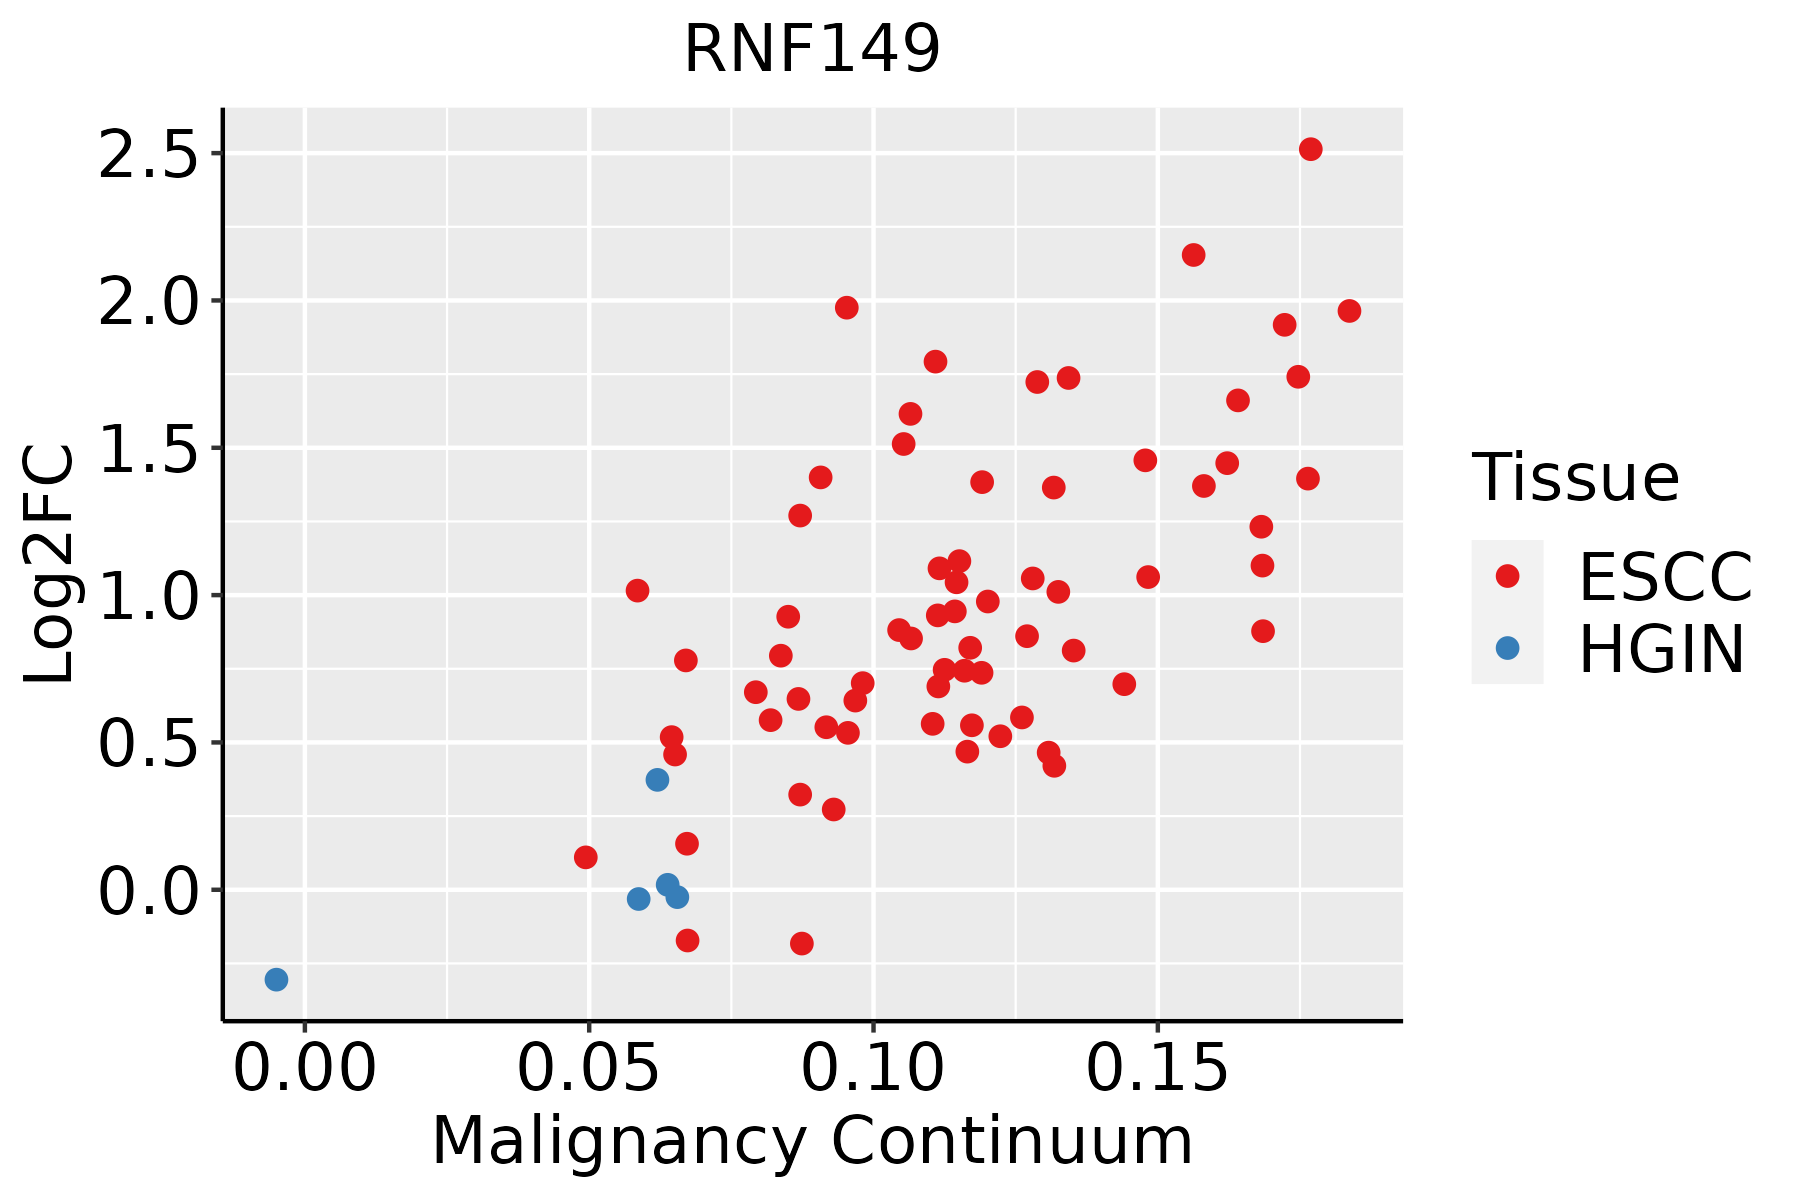
ESCC: Esophageal squamous cell carcinoma
HGIN: High-grade intraepithelial neoplasias
LGIN: Low-grade intraepithelial neoplasias
LiverThe image shows the transcriptomic changes along malignancy continuum.log2FC in expression of this searched gene in stem-like cells from each diseased tissue sample relative to stem-like cells in normal samples in each tissue plotted against the malignancy continuum. Samples are colored based on if they are from different disease stage.
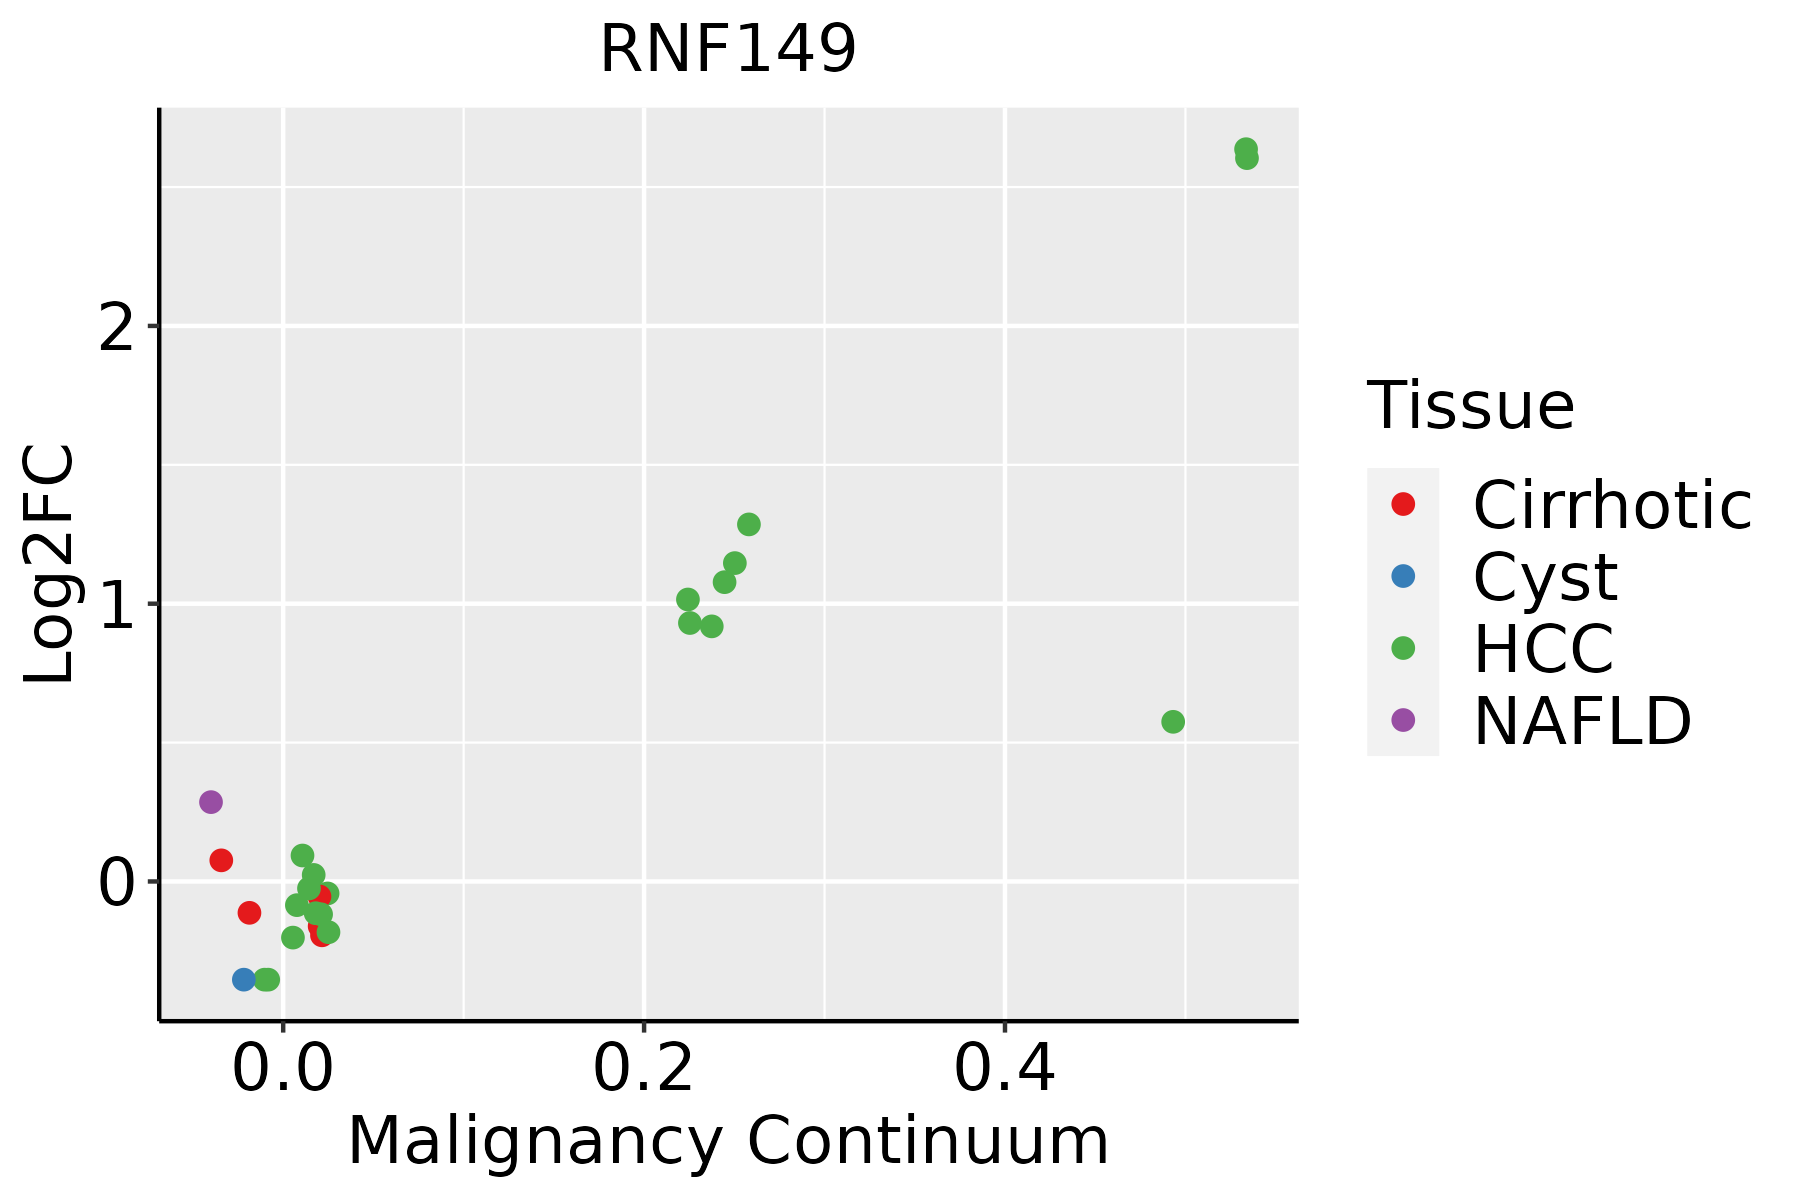
HCC: Hepatocellular carcinoma
NAFLD: Non-alcoholic fatty liver disease
LungThe image shows the transcriptomic changes along malignancy continuum.log2FC in expression of this searched gene in stem-like cells from each diseased tissue sample relative to stem-like cells in normal samples in each tissue plotted against the malignancy continuum. Samples are colored based on if they are from different disease stage.AAH: Atypical adenomatous hyperplasia
AIS: Adenocarcinoma in situ
IAC: Invasive lung adenocarcinoma
MIA: Minimally invasive adenocarcinoma
Oral CavityThe image shows the transcriptomic changes along malignancy continuum.log2FC in expression of this searched gene in stem-like cells from each diseased tissue sample relative to stem-like cells in normal samples in each tissue plotted against the malignancy continuum. Samples are colored based on if they are from different disease stage.
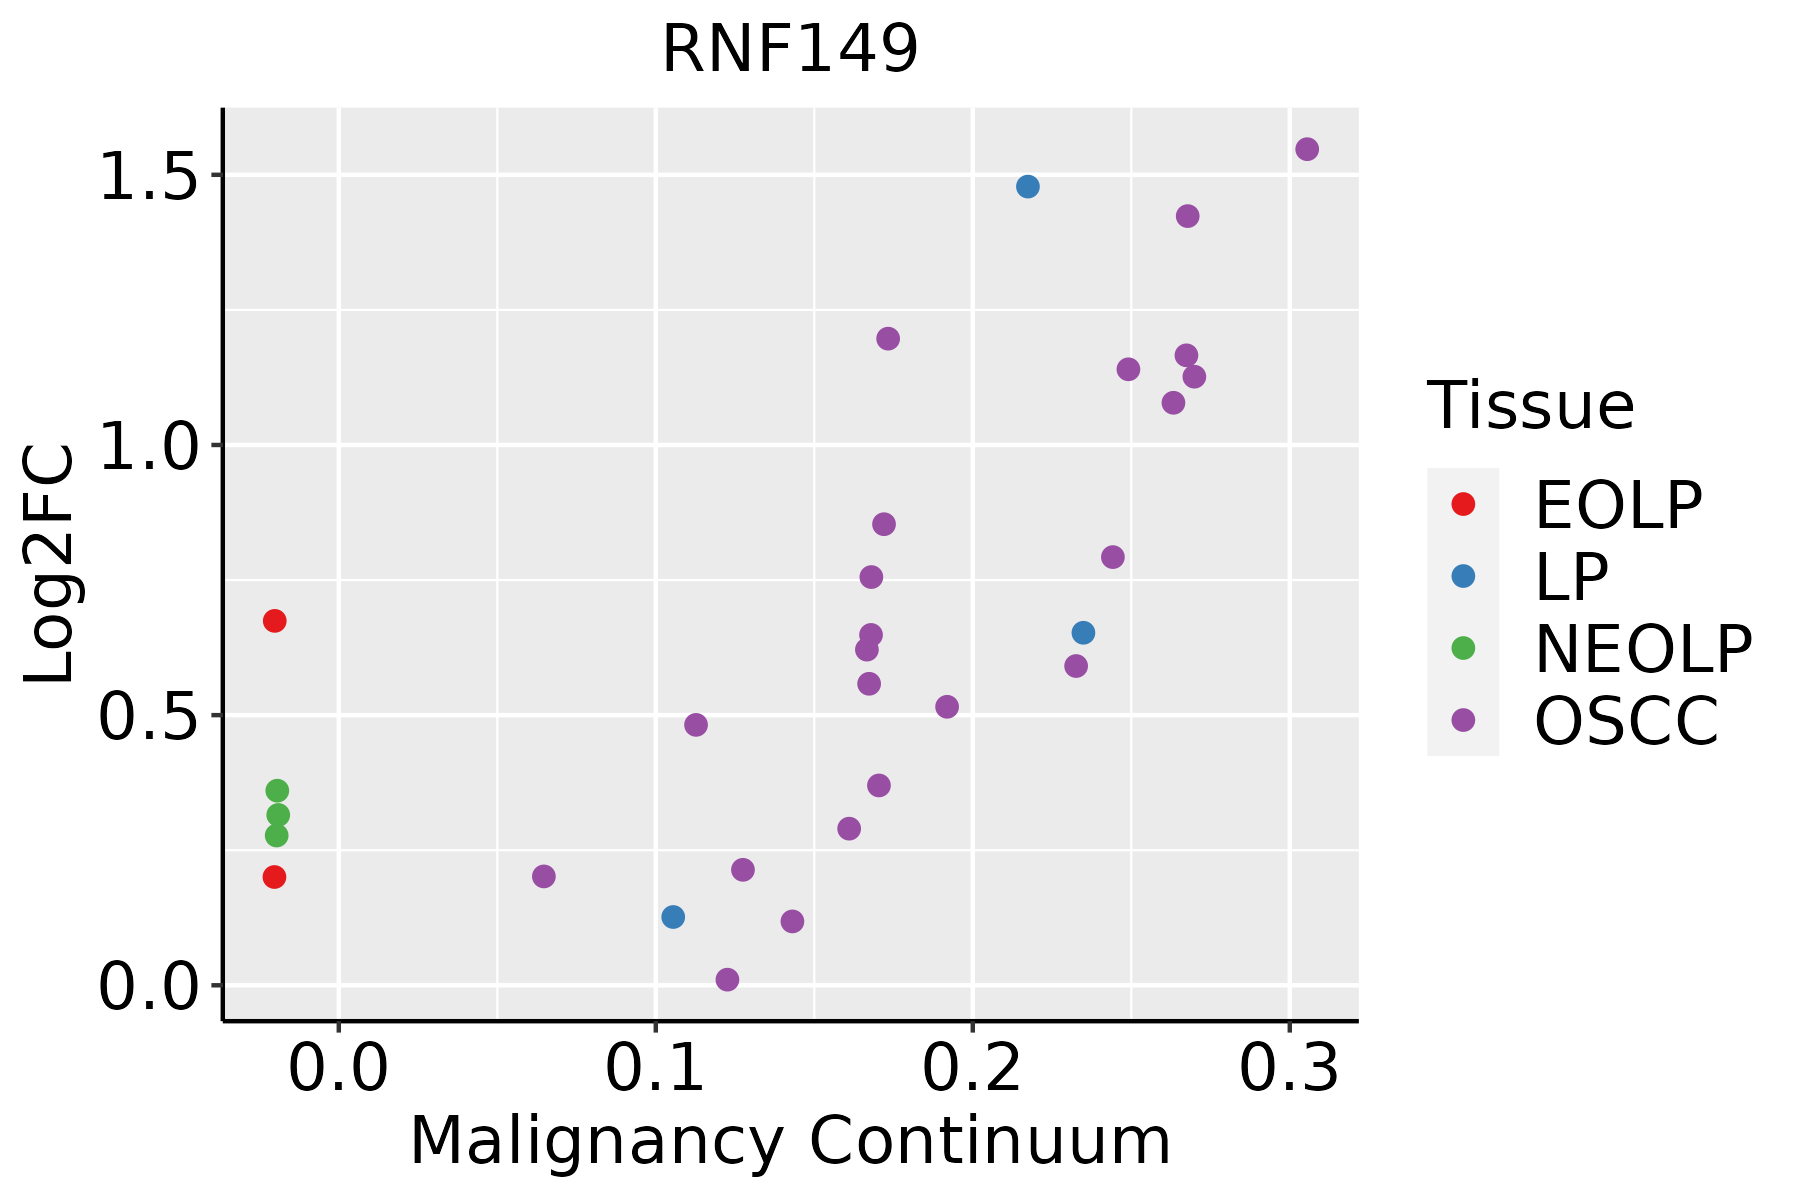
EOLP: Erosive Oral lichen planus
LP: leukoplakia
NEOLP: Non-erosive oral lichen planus
OSCC: Oral squamous cell carcinoma
SkinThe image shows the transcriptomic changes along malignancy continuum.log2FC in expression of this searched gene in stem-like cells from each diseased tissue sample relative to stem-like cells in normal samples in each tissue plotted against the malignancy continuum. Samples are colored based on if they are from different disease stage.
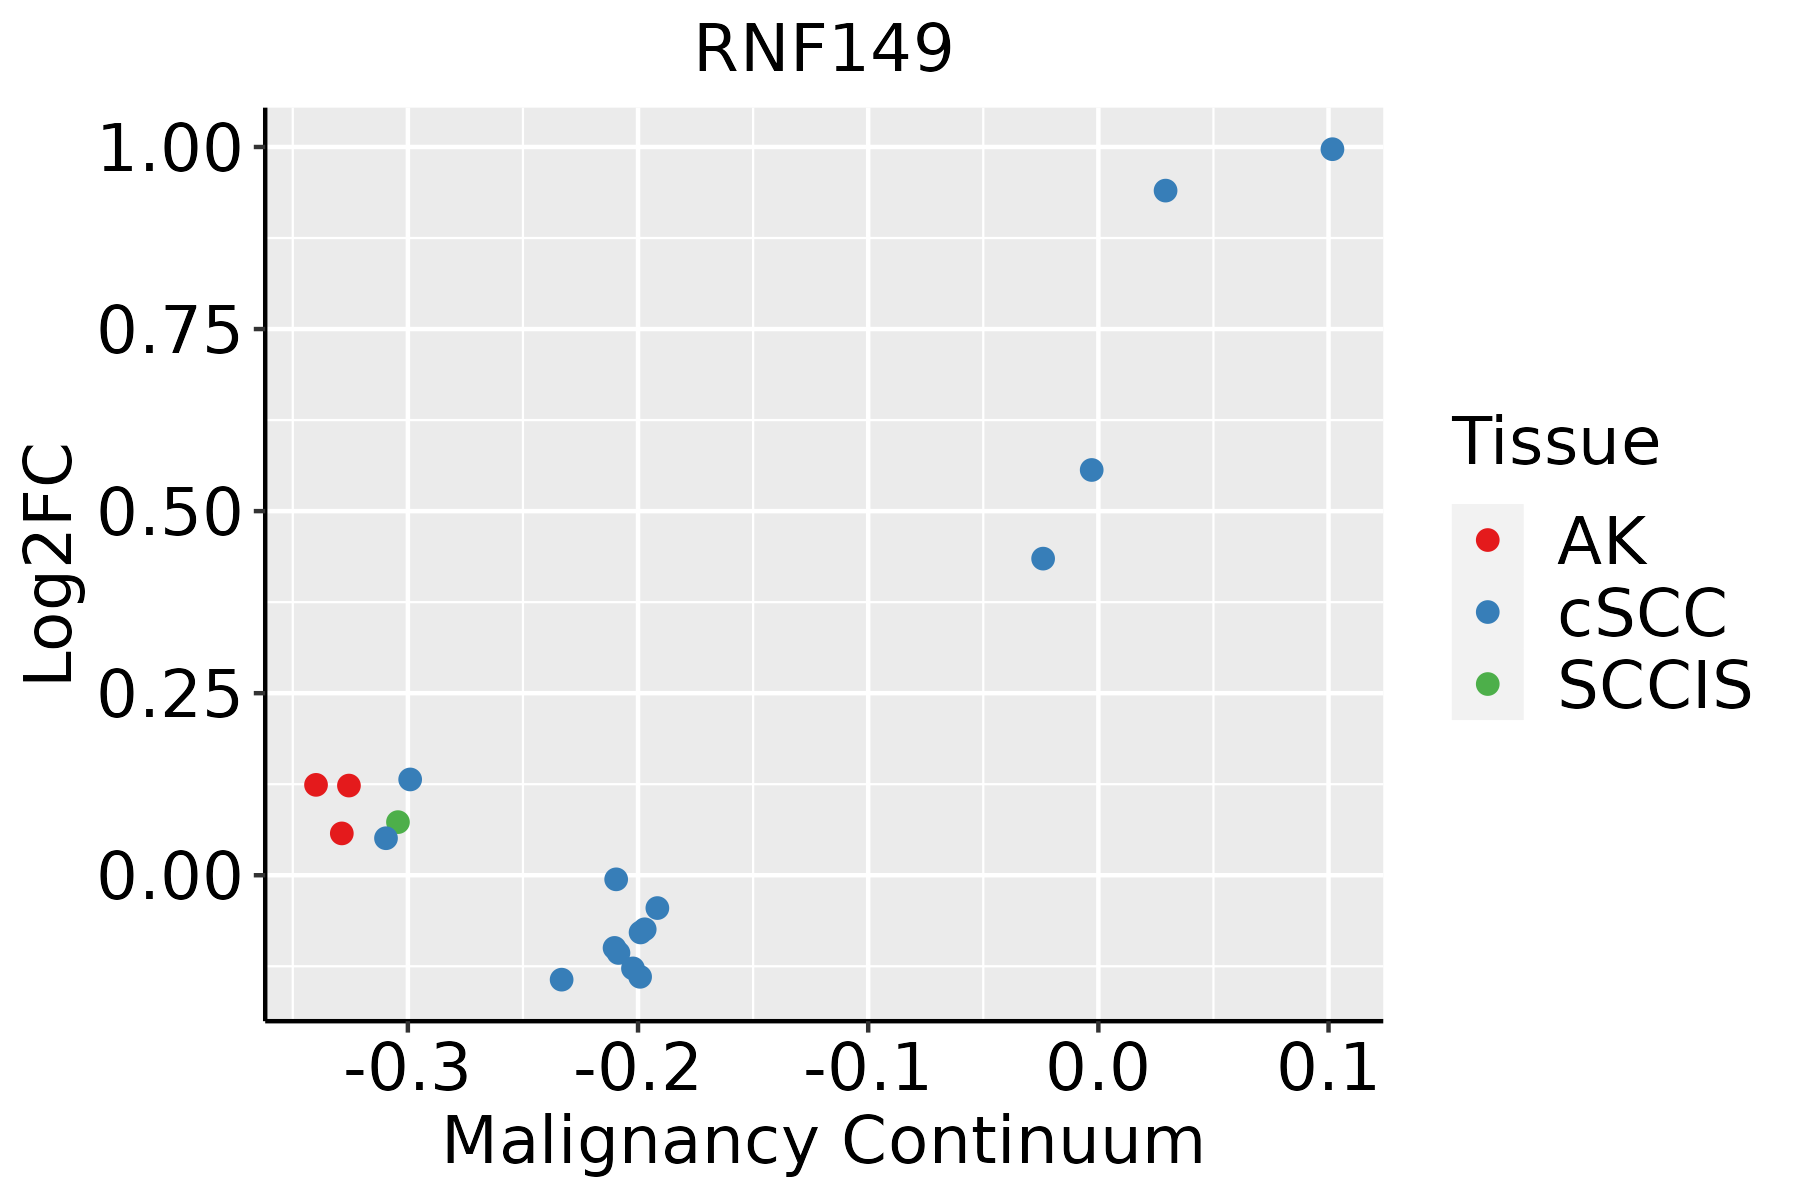
AK: Actinic keratosis
cSCC: Cutaneous squamous cell carcinoma
SCCIS:squamous cell carcinoma in situ
ThyroidThe image shows the transcriptomic changes along malignancy continuum.log2FC in expression of this searched gene in stem-like cells from each diseased tissue sample relative to stem-like cells in normal samples in each tissue plotted against the malignancy continuum. Samples are colored based on if they are from different disease stage.ATC: Anaplastic thyroid cancer
HT: Hashimoto's thyroiditis
PTC: Papillary thyroid cancer
∗log2FC in expression of this searched gene in stem-like cells from each diseased tissue sample relative to stem-like cells in normal samples in each tissue plotted against the malignancy continuum. Samples are colored based on if they are from different disease stage.

Top

Malignant transformation related pathway analysis

check buttonFind out the enriched GO biological processes and KEGG pathways involved in transition from healthy to precancer to cancer
check button Figure of enriched GO biological processes.
TissueDisease StageEnriched GO biological Processes
ColorectumADGO analysis - Figure of enriched GO biological processes: Top 15 enriched GO BP terms are showed in the bar plot of each disease state in each tissue. Each row represents a significant GO biological process which is colored according to the -log10(p.adjust).
ColorectumSERGO analysis - Figure of enriched GO biological processes: Top 15 enriched GO BP terms are showed in the bar plot of each disease state in each tissue. Each row represents a significant GO biological process which is colored according to the -log10(p.adjust).
ColorectumMSSGO analysis - Figure of enriched GO biological processes: Top 15 enriched GO BP terms are showed in the bar plot of each disease state in each tissue. Each row represents a significant GO biological process which is colored according to the -log10(p.adjust).
ColorectumMSI-HGO analysis - Figure of enriched GO biological processes: Top 15 enriched GO BP terms are showed in the bar plot of each disease state in each tissue. Each row represents a significant GO biological process which is colored according to the -log10(p.adjust).
ColorectumFAPGO analysis - Figure of enriched GO biological processes: Top 15 enriched GO BP terms are showed in the bar plot of each disease state in each tissue. Each row represents a significant GO biological process which is colored according to the -log10(p.adjust).
∗Top 15 enriched GO BP terms are showed in the bar plot of each disease state in each tissue. Each row represents a significant GO biological process which is colored according to the -log10(p.adjust).
Page: 1 2 3 4 5 6 7 8 9 

check button Enriched GO biological processes.
GO IDTissueDisease StageDescriptionGene RatioBg Ratiopvaluep.adjustCount
GO:0031647ColorectumADregulation of protein stability108/3918298/187236.33e-105.08e-08108
GO:0009410ColorectumADresponse to xenobiotic stimulus128/3918462/187232.69e-043.31e-03128
GO:0043409ColorectumADnegative regulation of MAPK cascade57/3918180/187234.61e-045.14e-0357
GO:00316471ColorectumSERregulation of protein stability86/2897298/187232.56e-092.42e-0786
GO:00434091ColorectumSERnegative regulation of MAPK cascade45/2897180/187235.81e-047.98e-0345
GO:00316472ColorectumMSSregulation of protein stability103/3467298/187232.52e-113.49e-09103
GO:00434092ColorectumMSSnegative regulation of MAPK cascade50/3467180/187231.45e-031.35e-0250
GO:00094101ColorectumMSSresponse to xenobiotic stimulus110/3467462/187232.36e-031.92e-02110
GO:00316474ColorectumFAPregulation of protein stability70/2622298/187236.60e-062.04e-0470
GO:00434094ColorectumFAPnegative regulation of MAPK cascade42/2622180/187234.97e-045.72e-0342
GO:00094102ColorectumFAPresponse to xenobiotic stimulus87/2622462/187232.15e-031.77e-0287
GO:00316475ColorectumCRCregulation of protein stability58/2078298/187231.38e-054.37e-0458
GO:00434095ColorectumCRCnegative regulation of MAPK cascade37/2078180/187231.51e-042.74e-0337
GO:00094103ColorectumCRCresponse to xenobiotic stimulus69/2078462/187236.34e-034.61e-0269
GO:003164727EsophagusHGINregulation of protein stability96/2587298/187232.21e-165.76e-1496
GO:004340919EsophagusHGINnegative regulation of MAPK cascade38/2587180/187234.58e-033.96e-0238
GO:0031647111EsophagusESCCregulation of protein stability223/8552298/187235.76e-251.52e-22223
GO:000941020EsophagusESCCresponse to xenobiotic stimulus253/8552462/187234.55e-053.58e-04253
GO:0043409110EsophagusESCCnegative regulation of MAPK cascade105/8552180/187234.13e-042.35e-03105
GO:00094107LiverNAFLDresponse to xenobiotic stimulus88/1882462/187232.53e-094.11e-0788
Page: 1 2 3 

check button Enriched KEGG pathways.
Pathway IDTissueDisease StageDescriptionGene RatioBg Ratiopvaluep.adjustqvalueCount
Page: 1 

Top

Cell-cell communication analysis

check buttonIdentification of potential cell-cell interactions between two cell types and their ligand-receptor pairs for different disease states
LigandReceptorLRpairPathwayTissueDisease Stage
Page: 1 

Top

Single-cell gene regulatory network inference analysis

check buttonFind out the significant the regulons (TFs) and the target genes of each regulon across cell types for different disease states
TFCell TypeTissueDisease StageTarget GeneRSSRegulon Activity
∗The dot plots of a searched regulon are shown for all cell subpopulations in each disease state of each tissue based on the regulon specific score inferred using pySCENIC and by calculating the average expression.
Page: 1 

Top

Somatic mutation of malignant transformation related genes

check buttonAnnotation of somatic variants for genes involved in malignant transformation
Hugo SymbolVariant ClassVariant ClassificationdbSNP RSHGVScHGVSpHGVSp ShortSWISSPROTBIOTYPESIFTPolyPhenTumor Sample BarcodeTissueHistologySexAgeStageTherapy TypesDrugsOutcome
RNF149SNVMissense_Mutationc.508N>Cp.Glu170Glnp.E170QQ8NC42protein_codingdeleterious(0)probably_damaging(0.966)TCGA-AC-A23H-01Breastbreast invasive carcinomaFemale>=65I/IIUnknownUnknownPD
RNF149SNVMissense_Mutationc.710N>Gp.Gln237Argp.Q237RQ8NC42protein_codingdeleterious(0.02)probably_damaging(0.994)TCGA-D8-A1XK-01Breastbreast invasive carcinomaFemale<65I/IIChemotherapydoxorubicine+cyclophosphamideSD
RNF149SNVMissense_Mutationnovelc.418G>Ap.Glu140Lysp.E140KQ8NC42protein_codingtolerated(0.7)benign(0.018)TCGA-VS-A9UP-01Cervixcervical & endocervical cancerFemale<65I/IIChemotherapycisplatinPD
RNF149SNVMissense_Mutationnovelc.311G>Ap.Arg104Glnp.R104QQ8NC42protein_codingtolerated(0.74)benign(0.003)TCGA-VS-A9UP-01Cervixcervical & endocervical cancerFemale<65I/IIChemotherapycisplatinPD
RNF149SNVMissense_Mutationnovelc.28N>Ap.Val10Ilep.V10IQ8NC42protein_codingtolerated_low_confidence(0.28)benign(0)TCGA-5M-AAT6-01Colorectumcolon adenocarcinomaFemale<65III/IVUnknownUnknownPD
RNF149SNVMissense_Mutationnovelc.713N>Ap.Ser238Asnp.S238NQ8NC42protein_codingtolerated(0.18)benign(0.006)TCGA-F5-6814-01Colorectumrectum adenocarcinomaMale<65I/IIUnknownUnknownSD
RNF149SNVMissense_Mutationrs772808658c.775G>Ap.Glu259Lysp.E259KQ8NC42protein_codingdeleterious(0)benign(0.411)TCGA-AX-A2HC-01Endometriumuterine corpus endometrioid carcinomaFemale<65III/IVChemotherapypaclitaxelPD
RNF149SNVMissense_Mutationc.878N>Tp.Arg293Ilep.R293IQ8NC42protein_codingdeleterious(0)probably_damaging(0.977)TCGA-B5-A0JY-01Endometriumuterine corpus endometrioid carcinomaFemale<65III/IVChemotherapydoxorubicinSD
RNF149SNVMissense_Mutationc.566C>Ap.Thr189Asnp.T189NQ8NC42protein_codingdeleterious(0.02)possibly_damaging(0.879)TCGA-D1-A163-01Endometriumuterine corpus endometrioid carcinomaFemale<65III/IVChemotherapytaxolSD
RNF149SNVMissense_Mutationrs574716905c.644N>Tp.Ser215Leup.S215LQ8NC42protein_codingdeleterious(0)probably_damaging(0.996)TCGA-E6-A1M0-01Endometriumuterine corpus endometrioid carcinomaFemale<65III/IVChemotherapycarboplatinSD
Page: 1 2 3 

Top

Related drugs of malignant transformation related genes

check buttonIdentification of chemicals and drugs interact with genes involved in malignant transfromation
(DGIdb 4.0)
Entrez IDSymbolCategoryInteraction TypesDrug Claim NameDrug NamePMIDs
Page: 1