
|
|||||
|
 | |
| |
| |
| |
| |
| |
|
Gene: RNF138 |
Gene summary for RNF138 |
| Gene information | Species | Human | Gene symbol | RNF138 | Gene ID | 51444 |
| Gene name | ring finger protein 138 | |
| Gene Alias | HSD-4 | |
| Cytomap | 18q12.1 | |
| Gene Type | protein-coding | GO ID | GO:0000724 | UniProtAcc | A0A140VJT9 |
Top |
Malignant transformation analysis |
| Identification of the aberrant gene expression in precancerous and cancerous lesions by comparing the gene expression of stem-like cells in diseased tissues with normal stem cells |
| Entrez ID | Symbol | Replicates | Species | Organ | Tissue | Adj P-value | Log2FC | Malignancy |
| 51444 | RNF138 | LZE2T | Human | Esophagus | ESCC | 3.88e-02 | 1.32e-01 | 0.082 |
| 51444 | RNF138 | LZE4T | Human | Esophagus | ESCC | 1.49e-04 | 9.58e-02 | 0.0811 |
| 51444 | RNF138 | LZE7T | Human | Esophagus | ESCC | 7.94e-03 | 4.42e-01 | 0.0667 |
| 51444 | RNF138 | LZE20T | Human | Esophagus | ESCC | 4.94e-05 | -7.74e-02 | 0.0662 |
| 51444 | RNF138 | LZE22D1 | Human | Esophagus | HGIN | 4.36e-02 | -6.79e-02 | 0.0595 |
| 51444 | RNF138 | LZE24T | Human | Esophagus | ESCC | 3.84e-12 | 3.93e-01 | 0.0596 |
| 51444 | RNF138 | LZE6T | Human | Esophagus | ESCC | 9.16e-03 | 1.80e-01 | 0.0845 |
| 51444 | RNF138 | P1T-E | Human | Esophagus | ESCC | 1.63e-02 | 3.54e-01 | 0.0875 |
| 51444 | RNF138 | P2T-E | Human | Esophagus | ESCC | 4.42e-25 | 4.71e-01 | 0.1177 |
| 51444 | RNF138 | P4T-E | Human | Esophagus | ESCC | 1.40e-13 | 4.18e-01 | 0.1323 |
| 51444 | RNF138 | P5T-E | Human | Esophagus | ESCC | 3.07e-13 | 7.18e-02 | 0.1327 |
| 51444 | RNF138 | P8T-E | Human | Esophagus | ESCC | 5.49e-21 | 4.82e-01 | 0.0889 |
| 51444 | RNF138 | P9T-E | Human | Esophagus | ESCC | 3.17e-17 | 5.65e-01 | 0.1131 |
| 51444 | RNF138 | P10T-E | Human | Esophagus | ESCC | 1.66e-24 | 2.91e-01 | 0.116 |
| 51444 | RNF138 | P12T-E | Human | Esophagus | ESCC | 8.17e-25 | 5.15e-01 | 0.1122 |
| 51444 | RNF138 | P15T-E | Human | Esophagus | ESCC | 6.38e-11 | 4.15e-01 | 0.1149 |
| 51444 | RNF138 | P16T-E | Human | Esophagus | ESCC | 9.54e-22 | 2.98e-01 | 0.1153 |
| 51444 | RNF138 | P19T-E | Human | Esophagus | ESCC | 2.19e-04 | 2.60e-01 | 0.1662 |
| 51444 | RNF138 | P20T-E | Human | Esophagus | ESCC | 2.99e-10 | 3.96e-01 | 0.1124 |
| 51444 | RNF138 | P21T-E | Human | Esophagus | ESCC | 8.49e-22 | 2.15e-01 | 0.1617 |
| Page: 1 2 3 4 |
| Tissue | Expression Dynamics | Abbreviation |
| Esophagus | 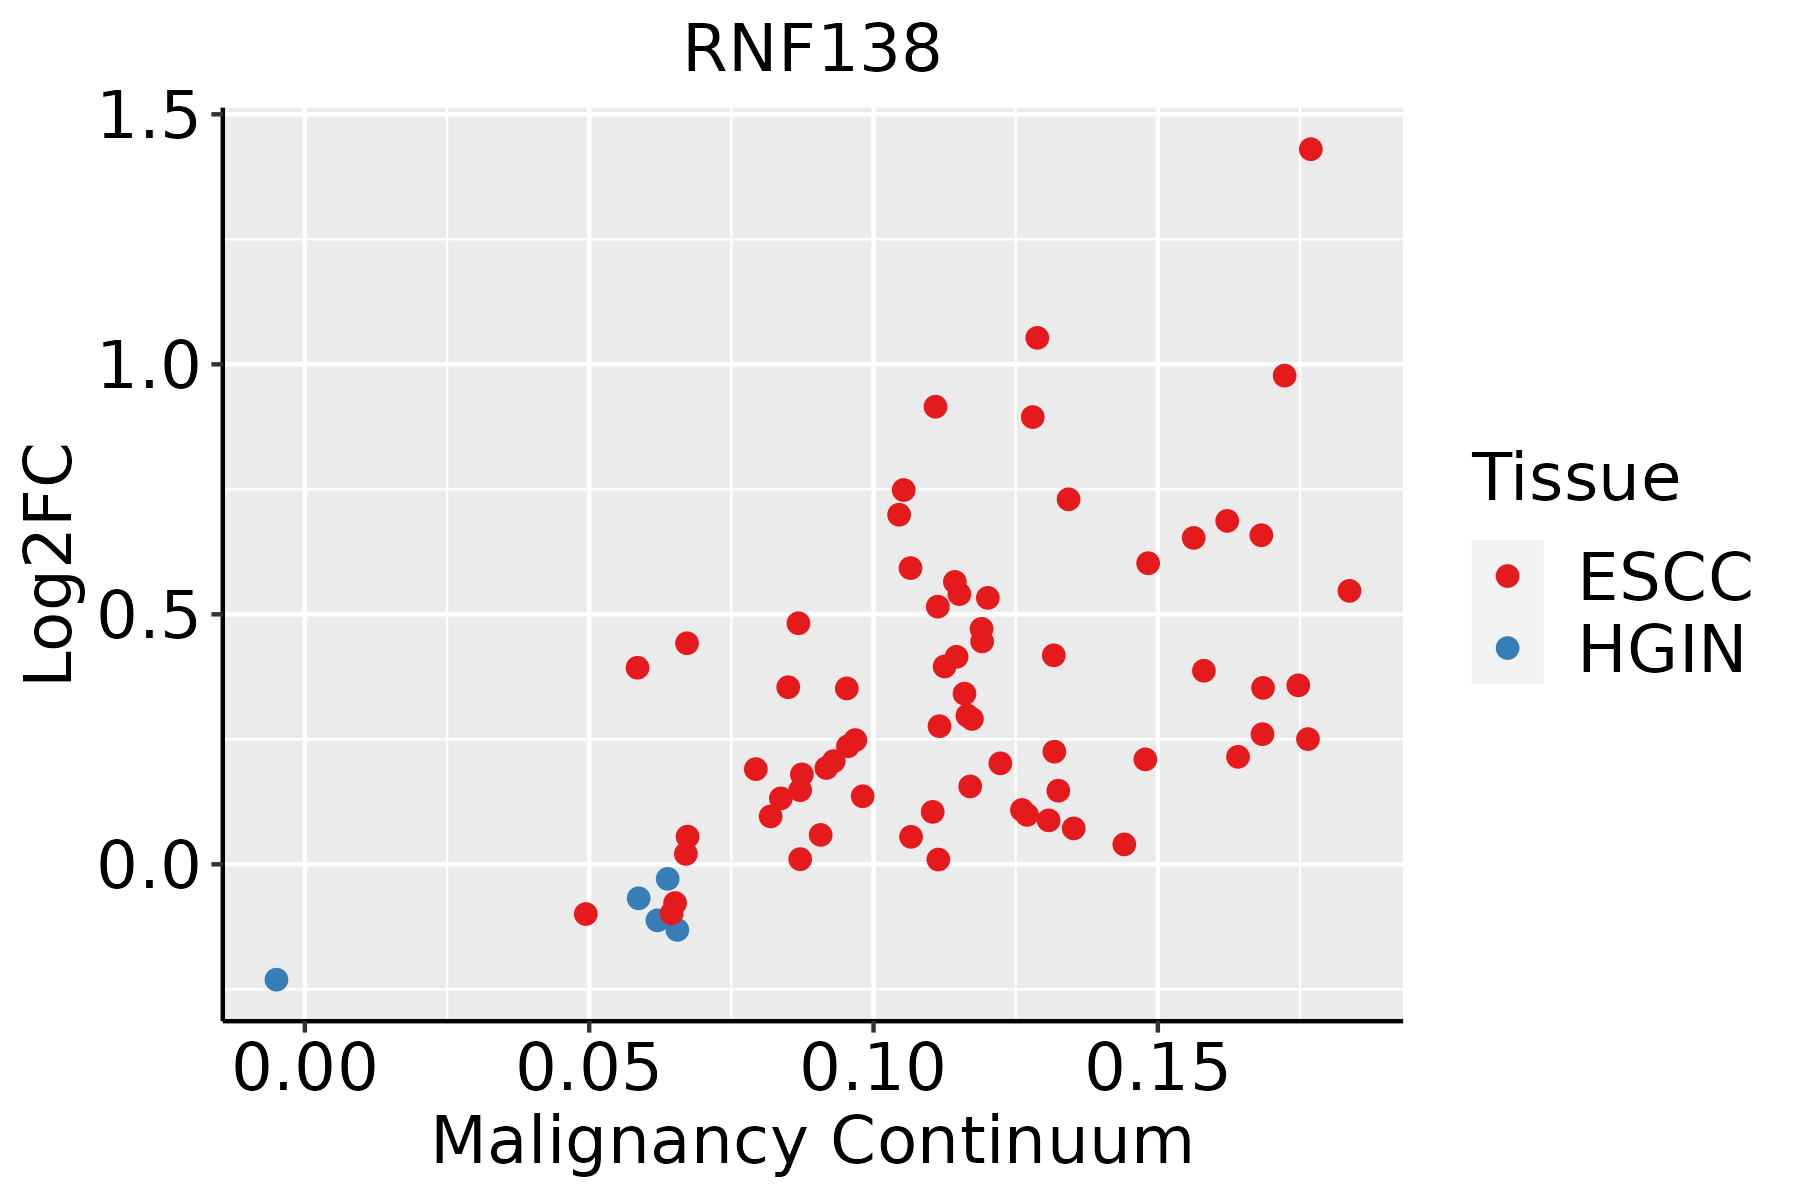 | ESCC: Esophageal squamous cell carcinoma |
| HGIN: High-grade intraepithelial neoplasias | ||
| LGIN: Low-grade intraepithelial neoplasias | ||
| Oral Cavity | 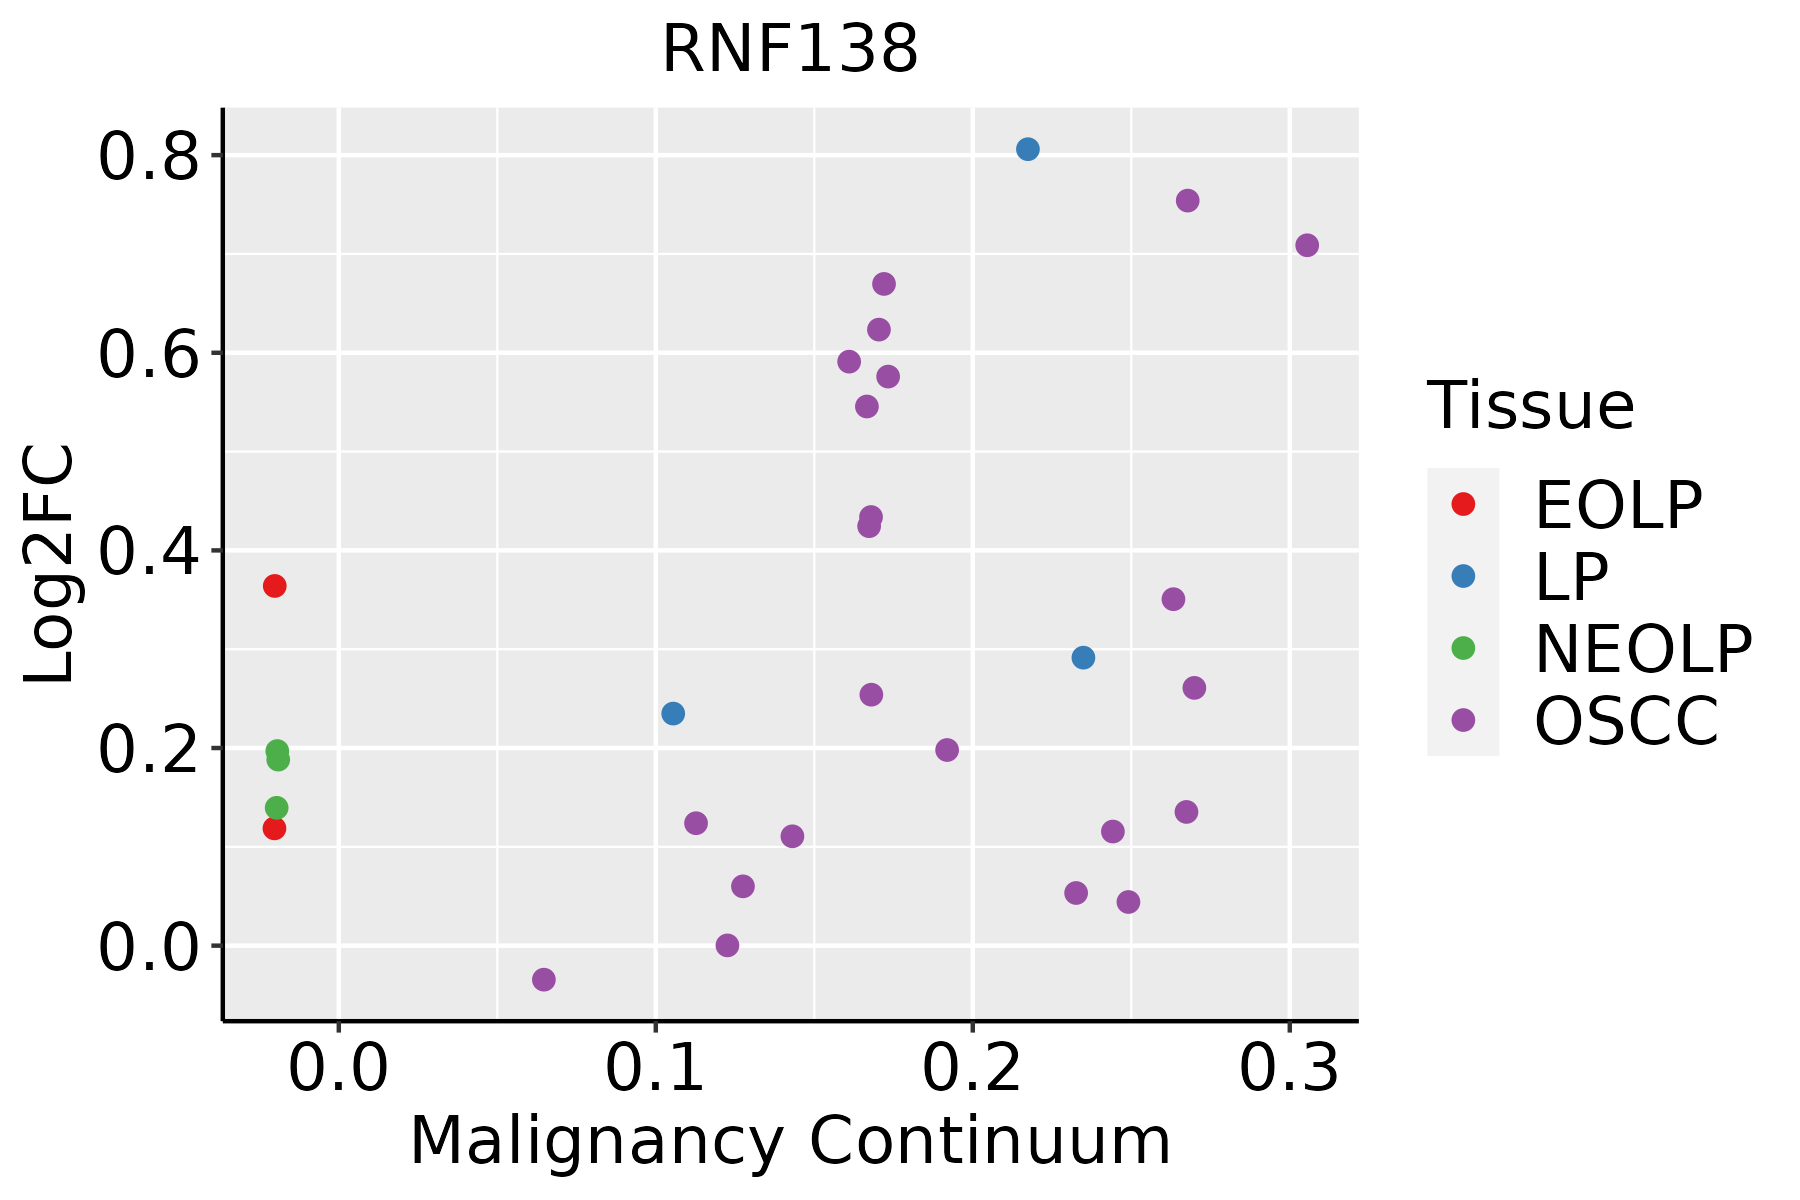 | EOLP: Erosive Oral lichen planus |
| LP: leukoplakia | ||
| NEOLP: Non-erosive oral lichen planus | ||
| OSCC: Oral squamous cell carcinoma |
| ∗log2FC in expression of this searched gene in stem-like cells from each diseased tissue sample relative to stem-like cells in normal samples in each tissue plotted against the malignancy continuum. Samples are colored based on if they are from different disease stage. |
Top |
Malignant transformation related pathway analysis |
| Find out the enriched GO biological processes and KEGG pathways involved in transition from healthy to precancer to cancer |
| Tissue | Disease Stage | Enriched GO biological Processes |
| Colorectum | AD |  |
| Colorectum | SER |  |
| Colorectum | MSS |  |
| Colorectum | MSI-H |  |
| Colorectum | FAP |  |
| ∗Top 15 enriched GO BP terms are showed in the bar plot of each disease state in each tissue. Each row represents a significant GO biological process which is colored according to the -log10(p.adjust). |
| Page: 1 2 3 4 5 6 7 8 9 |
| GO ID | Tissue | Disease Stage | Description | Gene Ratio | Bg Ratio | pvalue | p.adjust | Count |
| GO:001605516 | Esophagus | HGIN | Wnt signaling pathway | 83/2587 | 444/18723 | 2.27e-03 | 2.33e-02 | 83 |
| GO:019873816 | Esophagus | HGIN | cell-cell signaling by wnt | 83/2587 | 446/18723 | 2.58e-03 | 2.55e-02 | 83 |
| GO:001605517 | Esophagus | ESCC | Wnt signaling pathway | 268/8552 | 444/18723 | 2.32e-10 | 6.58e-09 | 268 |
| GO:019873817 | Esophagus | ESCC | cell-cell signaling by wnt | 269/8552 | 446/18723 | 2.41e-10 | 6.79e-09 | 269 |
| GO:00063024 | Esophagus | ESCC | double-strand break repair | 152/8552 | 251/18723 | 1.33e-06 | 1.62e-05 | 152 |
| GO:00063101 | Esophagus | ESCC | DNA recombination | 168/8552 | 305/18723 | 5.58e-04 | 3.05e-03 | 168 |
| GO:00007241 | Esophagus | ESCC | double-strand break repair via homologous recombination | 79/8552 | 138/18723 | 4.05e-03 | 1.62e-02 | 79 |
| GO:00007251 | Esophagus | ESCC | recombinational repair | 80/8552 | 140/18723 | 4.10e-03 | 1.63e-02 | 80 |
| GO:001605510 | Oral cavity | OSCC | Wnt signaling pathway | 227/7305 | 444/18723 | 1.10e-07 | 1.87e-06 | 227 |
| GO:019873810 | Oral cavity | OSCC | cell-cell signaling by wnt | 227/7305 | 446/18723 | 1.75e-07 | 2.86e-06 | 227 |
| GO:00063023 | Oral cavity | OSCC | double-strand break repair | 132/7305 | 251/18723 | 7.93e-06 | 8.52e-05 | 132 |
| GO:0006310 | Oral cavity | OSCC | DNA recombination | 147/7305 | 305/18723 | 6.33e-04 | 3.56e-03 | 147 |
| GO:0000725 | Oral cavity | OSCC | recombinational repair | 70/7305 | 140/18723 | 5.22e-03 | 2.03e-02 | 70 |
| GO:0000724 | Oral cavity | OSCC | double-strand break repair via homologous recombination | 69/7305 | 138/18723 | 5.52e-03 | 2.14e-02 | 69 |
| GO:001605515 | Oral cavity | LP | Wnt signaling pathway | 140/4623 | 444/18723 | 5.80e-04 | 5.35e-03 | 140 |
| GO:019873815 | Oral cavity | LP | cell-cell signaling by wnt | 140/4623 | 446/18723 | 7.12e-04 | 6.38e-03 | 140 |
| GO:000630211 | Oral cavity | LP | double-strand break repair | 80/4623 | 251/18723 | 5.81e-03 | 3.46e-02 | 80 |
| GO:001605523 | Oral cavity | EOLP | Wnt signaling pathway | 89/2218 | 444/18723 | 3.66e-07 | 1.06e-05 | 89 |
| GO:019873823 | Oral cavity | EOLP | cell-cell signaling by wnt | 89/2218 | 446/18723 | 4.49e-07 | 1.25e-05 | 89 |
| GO:00063022 | Oral cavity | EOLP | double-strand break repair | 44/2218 | 251/18723 | 4.94e-03 | 2.62e-02 | 44 |
| Page: 1 2 |
| Pathway ID | Tissue | Disease Stage | Description | Gene Ratio | Bg Ratio | pvalue | p.adjust | qvalue | Count |
| Page: 1 |
Top |
Cell-cell communication analysis |
| Identification of potential cell-cell interactions between two cell types and their ligand-receptor pairs for different disease states |
| Ligand | Receptor | LRpair | Pathway | Tissue | Disease Stage |
| Page: 1 |
Top |
Single-cell gene regulatory network inference analysis |
| Find out the significant the regulons (TFs) and the target genes of each regulon across cell types for different disease states |
| TF | Cell Type | Tissue | Disease Stage | Target Gene | RSS | Regulon Activity |
| ∗The dot plots of a searched regulon are shown for all cell subpopulations in each disease state of each tissue based on the regulon specific score inferred using pySCENIC and by calculating the average expression. |
| Page: 1 |
Top |
Somatic mutation of malignant transformation related genes |
| Annotation of somatic variants for genes involved in malignant transformation |
| Hugo Symbol | Variant Class | Variant Classification | dbSNP RS | HGVSc | HGVSp | HGVSp Short | SWISSPROT | BIOTYPE | SIFT | PolyPhen | Tumor Sample Barcode | Tissue | Histology | Sex | Age | Stage | Therapy Types | Drugs | Outcome |
| RNF138 | SNV | Missense_Mutation | c.547C>G | p.Gln183Glu | p.Q183E | Q8WVD3 | protein_coding | tolerated(0.33) | benign(0.013) | TCGA-AC-A23H-01 | Breast | breast invasive carcinoma | Female | >=65 | I/II | Unknown | Unknown | PD | |
| RNF138 | SNV | Missense_Mutation | c.173G>A | p.Arg58His | p.R58H | Q8WVD3 | protein_coding | deleterious(0.04) | probably_damaging(0.91) | TCGA-BH-A0AW-01 | Breast | breast invasive carcinoma | Female | <65 | I/II | Chemotherapy | carboplatin | SD | |
| RNF138 | SNV | Missense_Mutation | novel | c.155C>T | p.Ala52Val | p.A52V | Q8WVD3 | protein_coding | tolerated(0.52) | benign(0.005) | TCGA-VS-A9UJ-01 | Cervix | cervical & endocervical cancer | Female | <65 | I/II | Unknown | Unknown | PD |
| RNF138 | SNV | Missense_Mutation | c.109N>A | p.Val37Ile | p.V37I | Q8WVD3 | protein_coding | tolerated(0.12) | benign(0.063) | TCGA-AA-3821-01 | Colorectum | colon adenocarcinoma | Female | >=65 | I/II | Unknown | Unknown | SD | |
| RNF138 | SNV | Missense_Mutation | c.296N>A | p.Arg99Lys | p.R99K | Q8WVD3 | protein_coding | tolerated(0.11) | benign(0.232) | TCGA-AD-6964-01 | Colorectum | colon adenocarcinoma | Male | <65 | III/IV | Chemotherapy | folfox | PD | |
| RNF138 | SNV | Missense_Mutation | c.172N>T | p.Arg58Cys | p.R58C | Q8WVD3 | protein_coding | deleterious(0) | probably_damaging(0.91) | TCGA-AY-A69D-01 | Colorectum | colon adenocarcinoma | Female | <65 | I/II | Unknown | Unknown | SD | |
| RNF138 | SNV | Missense_Mutation | c.656N>G | p.Tyr219Cys | p.Y219C | Q8WVD3 | protein_coding | deleterious(0) | probably_damaging(0.997) | TCGA-CM-5861-01 | Colorectum | colon adenocarcinoma | Female | <65 | I/II | Unknown | Unknown | PD | |
| RNF138 | SNV | Missense_Mutation | novel | c.641N>T | p.Arg214Ile | p.R214I | Q8WVD3 | protein_coding | deleterious(0) | probably_damaging(0.995) | TCGA-EI-6917-01 | Colorectum | rectum adenocarcinoma | Male | <65 | III/IV | Chemotherapy | 5fluorouracil+oxaciplatina+l-folinian | SD |
| RNF138 | SNV | Missense_Mutation | c.707N>T | p.Ala236Val | p.A236V | Q8WVD3 | protein_coding | deleterious(0) | probably_damaging(0.996) | TCGA-A5-A1OF-01 | Endometrium | uterine corpus endometrioid carcinoma | Female | <65 | I/II | Unknown | Unknown | SD | |
| RNF138 | SNV | Missense_Mutation | novel | c.621C>A | p.Phe207Leu | p.F207L | Q8WVD3 | protein_coding | tolerated(0.3) | benign(0) | TCGA-A5-A2K5-01 | Endometrium | uterine corpus endometrioid carcinoma | Female | >=65 | I/II | Unknown | Unknown | SD |
| Page: 1 2 3 4 |
Top |
Related drugs of malignant transformation related genes |
| Identification of chemicals and drugs interact with genes involved in malignant transfromation |
| (DGIdb 4.0) |
| Entrez ID | Symbol | Category | Interaction Types | Drug Claim Name | Drug Name | PMIDs |
| Page: 1 |

Copyright 2023-Present -The University of Texas Health Science Center at Houston |