
|
|||||
|
 | |
| |
| |
| |
| |
| |
|
Gene: RNF135 |
Gene summary for RNF135 |
| Gene information | Species | Human | Gene symbol | RNF135 | Gene ID | 84282 |
| Gene name | ring finger protein 135 | |
| Gene Alias | L13 | |
| Cytomap | 17q11.2 | |
| Gene Type | protein-coding | GO ID | GO:0000209 | UniProtAcc | Q8IUD6 |
Top |
Malignant transformation analysis |
| Identification of the aberrant gene expression in precancerous and cancerous lesions by comparing the gene expression of stem-like cells in diseased tissues with normal stem cells |
| Entrez ID | Symbol | Replicates | Species | Organ | Tissue | Adj P-value | Log2FC | Malignancy |
| 84282 | RNF135 | LZE4T | Human | Esophagus | ESCC | 7.16e-06 | 1.68e-01 | 0.0811 |
| 84282 | RNF135 | LZE5T | Human | Esophagus | ESCC | 4.39e-05 | 4.70e-01 | 0.0514 |
| 84282 | RNF135 | LZE20T | Human | Esophagus | ESCC | 3.53e-05 | 1.95e-01 | 0.0662 |
| 84282 | RNF135 | LZE22D1 | Human | Esophagus | HGIN | 3.80e-04 | 1.56e-01 | 0.0595 |
| 84282 | RNF135 | LZE22T | Human | Esophagus | ESCC | 3.89e-05 | 3.18e-01 | 0.068 |
| 84282 | RNF135 | LZE24T | Human | Esophagus | ESCC | 9.28e-22 | 5.43e-01 | 0.0596 |
| 84282 | RNF135 | P1T-E | Human | Esophagus | ESCC | 2.32e-08 | 4.34e-01 | 0.0875 |
| 84282 | RNF135 | P2T-E | Human | Esophagus | ESCC | 3.81e-18 | 2.74e-01 | 0.1177 |
| 84282 | RNF135 | P4T-E | Human | Esophagus | ESCC | 1.67e-28 | 6.04e-01 | 0.1323 |
| 84282 | RNF135 | P5T-E | Human | Esophagus | ESCC | 4.25e-15 | 2.13e-01 | 0.1327 |
| 84282 | RNF135 | P8T-E | Human | Esophagus | ESCC | 2.12e-19 | 3.54e-01 | 0.0889 |
| 84282 | RNF135 | P9T-E | Human | Esophagus | ESCC | 2.46e-16 | 3.05e-01 | 0.1131 |
| 84282 | RNF135 | P10T-E | Human | Esophagus | ESCC | 5.91e-20 | 1.99e-01 | 0.116 |
| 84282 | RNF135 | P11T-E | Human | Esophagus | ESCC | 4.29e-18 | 5.74e-01 | 0.1426 |
| 84282 | RNF135 | P12T-E | Human | Esophagus | ESCC | 3.00e-45 | 7.31e-01 | 0.1122 |
| 84282 | RNF135 | P15T-E | Human | Esophagus | ESCC | 9.35e-29 | 5.84e-01 | 0.1149 |
| 84282 | RNF135 | P16T-E | Human | Esophagus | ESCC | 1.71e-22 | 3.93e-01 | 0.1153 |
| 84282 | RNF135 | P17T-E | Human | Esophagus | ESCC | 3.01e-05 | 2.84e-01 | 0.1278 |
| 84282 | RNF135 | P19T-E | Human | Esophagus | ESCC | 3.28e-05 | 3.60e-01 | 0.1662 |
| 84282 | RNF135 | P20T-E | Human | Esophagus | ESCC | 3.56e-17 | 3.93e-01 | 0.1124 |
| Page: 1 2 3 4 5 |
| Tissue | Expression Dynamics | Abbreviation |
| Esophagus |  | ESCC: Esophageal squamous cell carcinoma |
| HGIN: High-grade intraepithelial neoplasias | ||
| LGIN: Low-grade intraepithelial neoplasias | ||
| Liver | 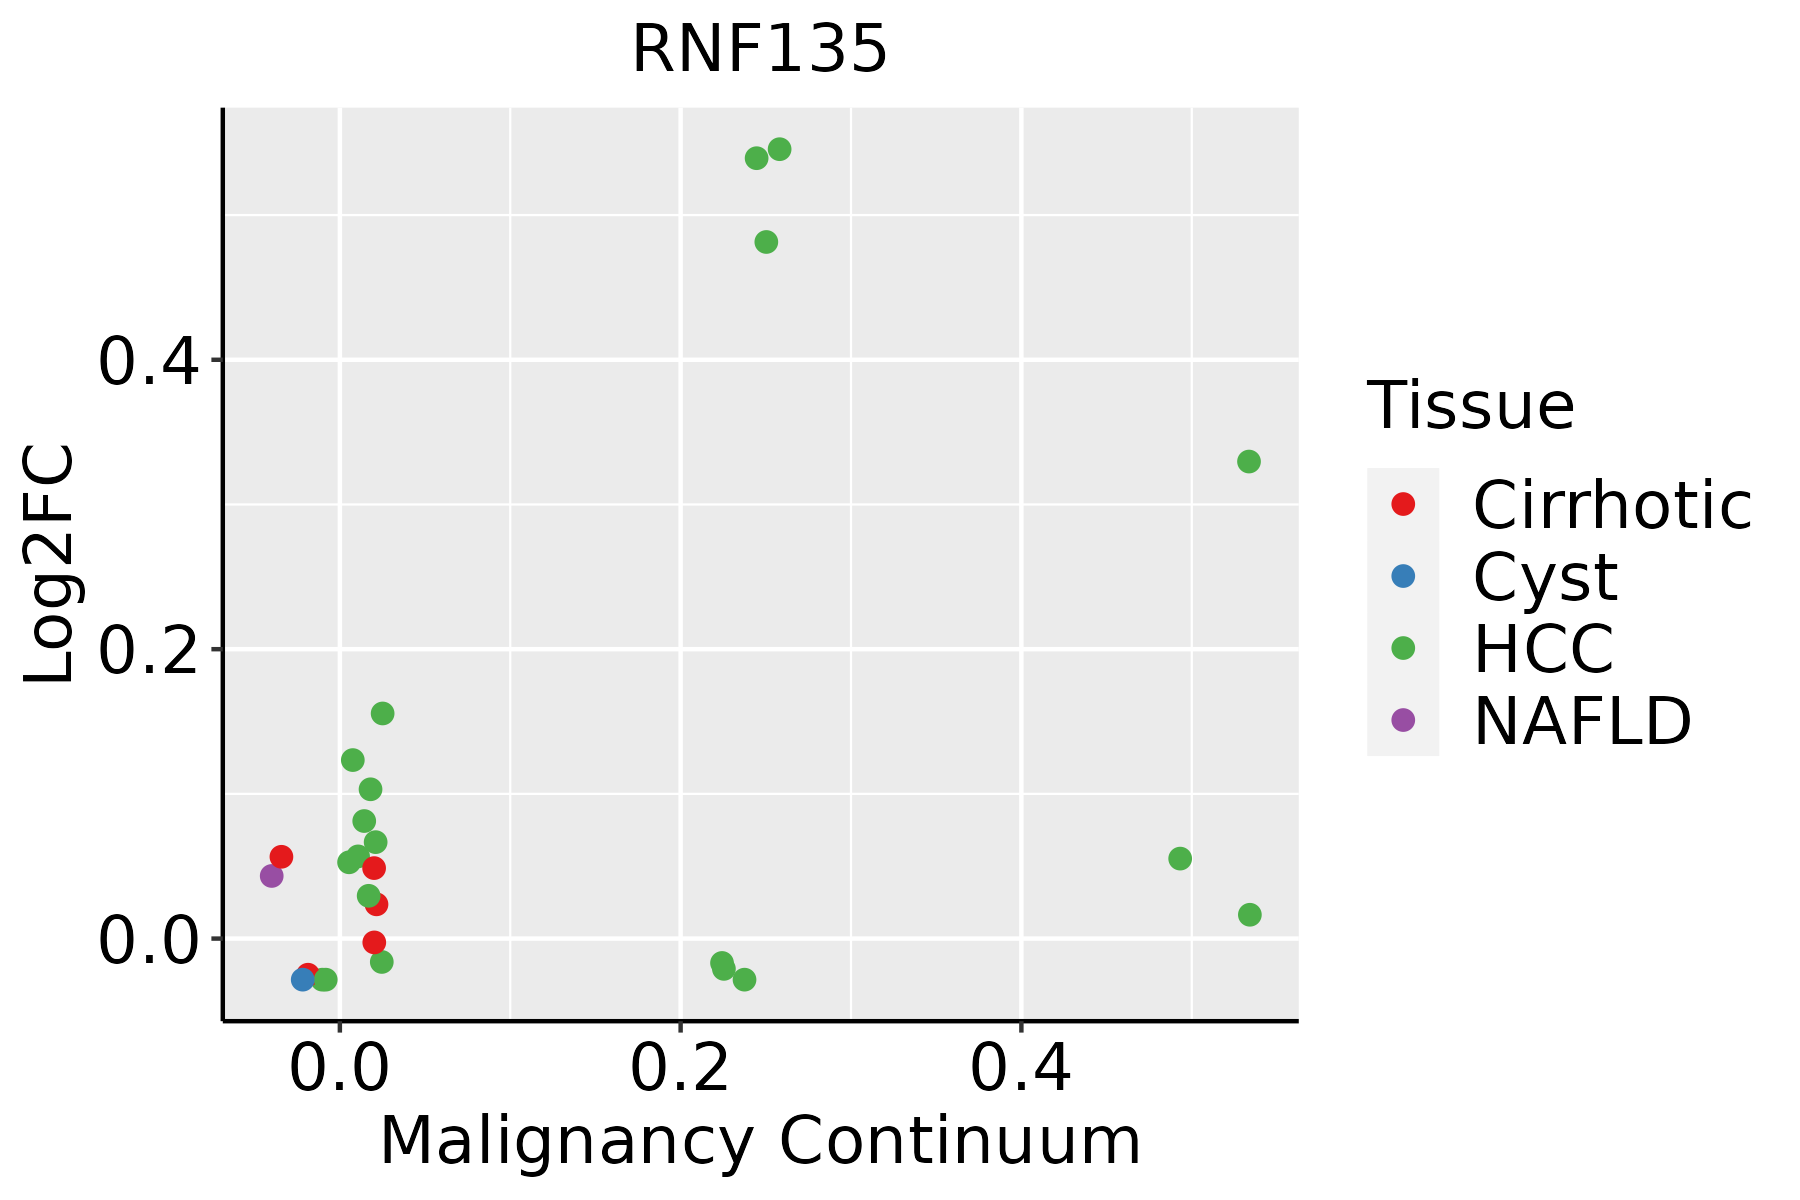 | HCC: Hepatocellular carcinoma |
| NAFLD: Non-alcoholic fatty liver disease | ||
| Oral Cavity | 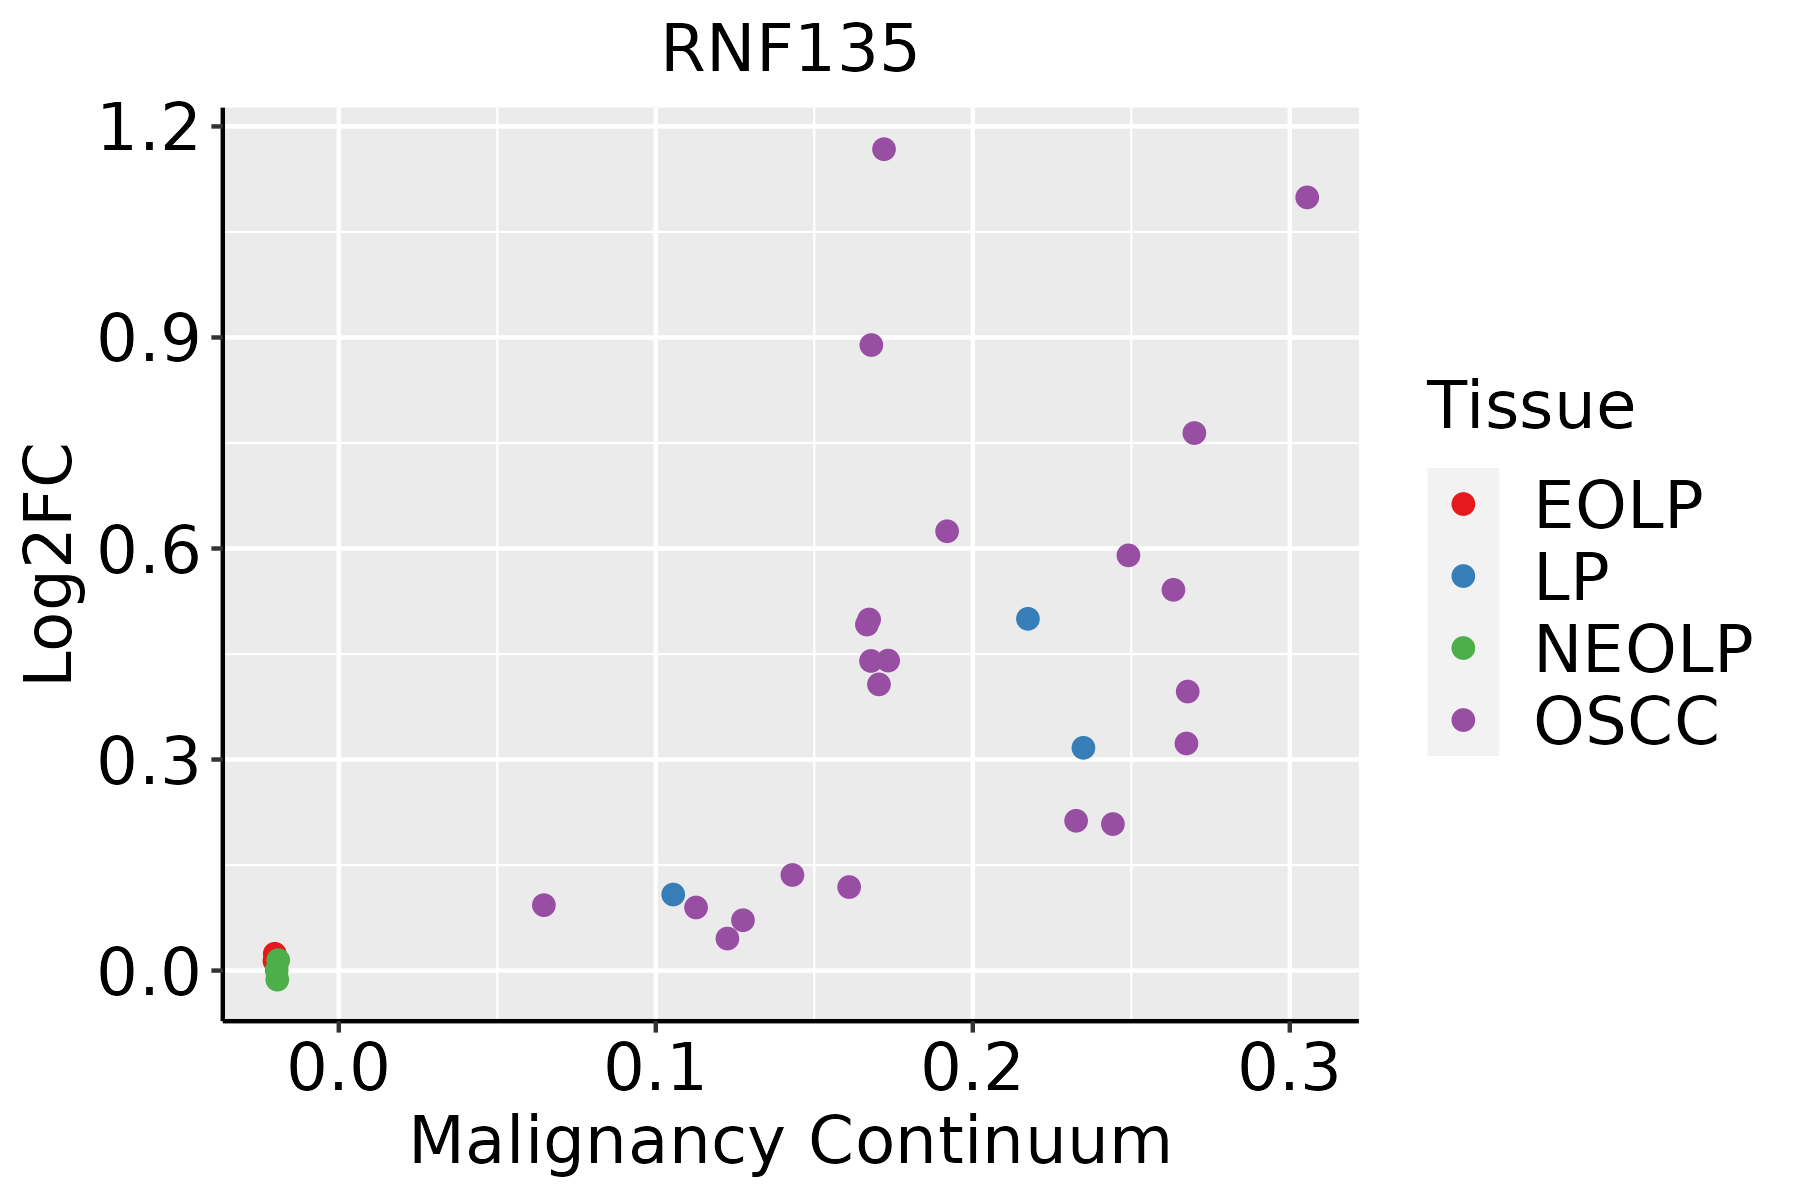 | EOLP: Erosive Oral lichen planus |
| LP: leukoplakia | ||
| NEOLP: Non-erosive oral lichen planus | ||
| OSCC: Oral squamous cell carcinoma | ||
| Thyroid | 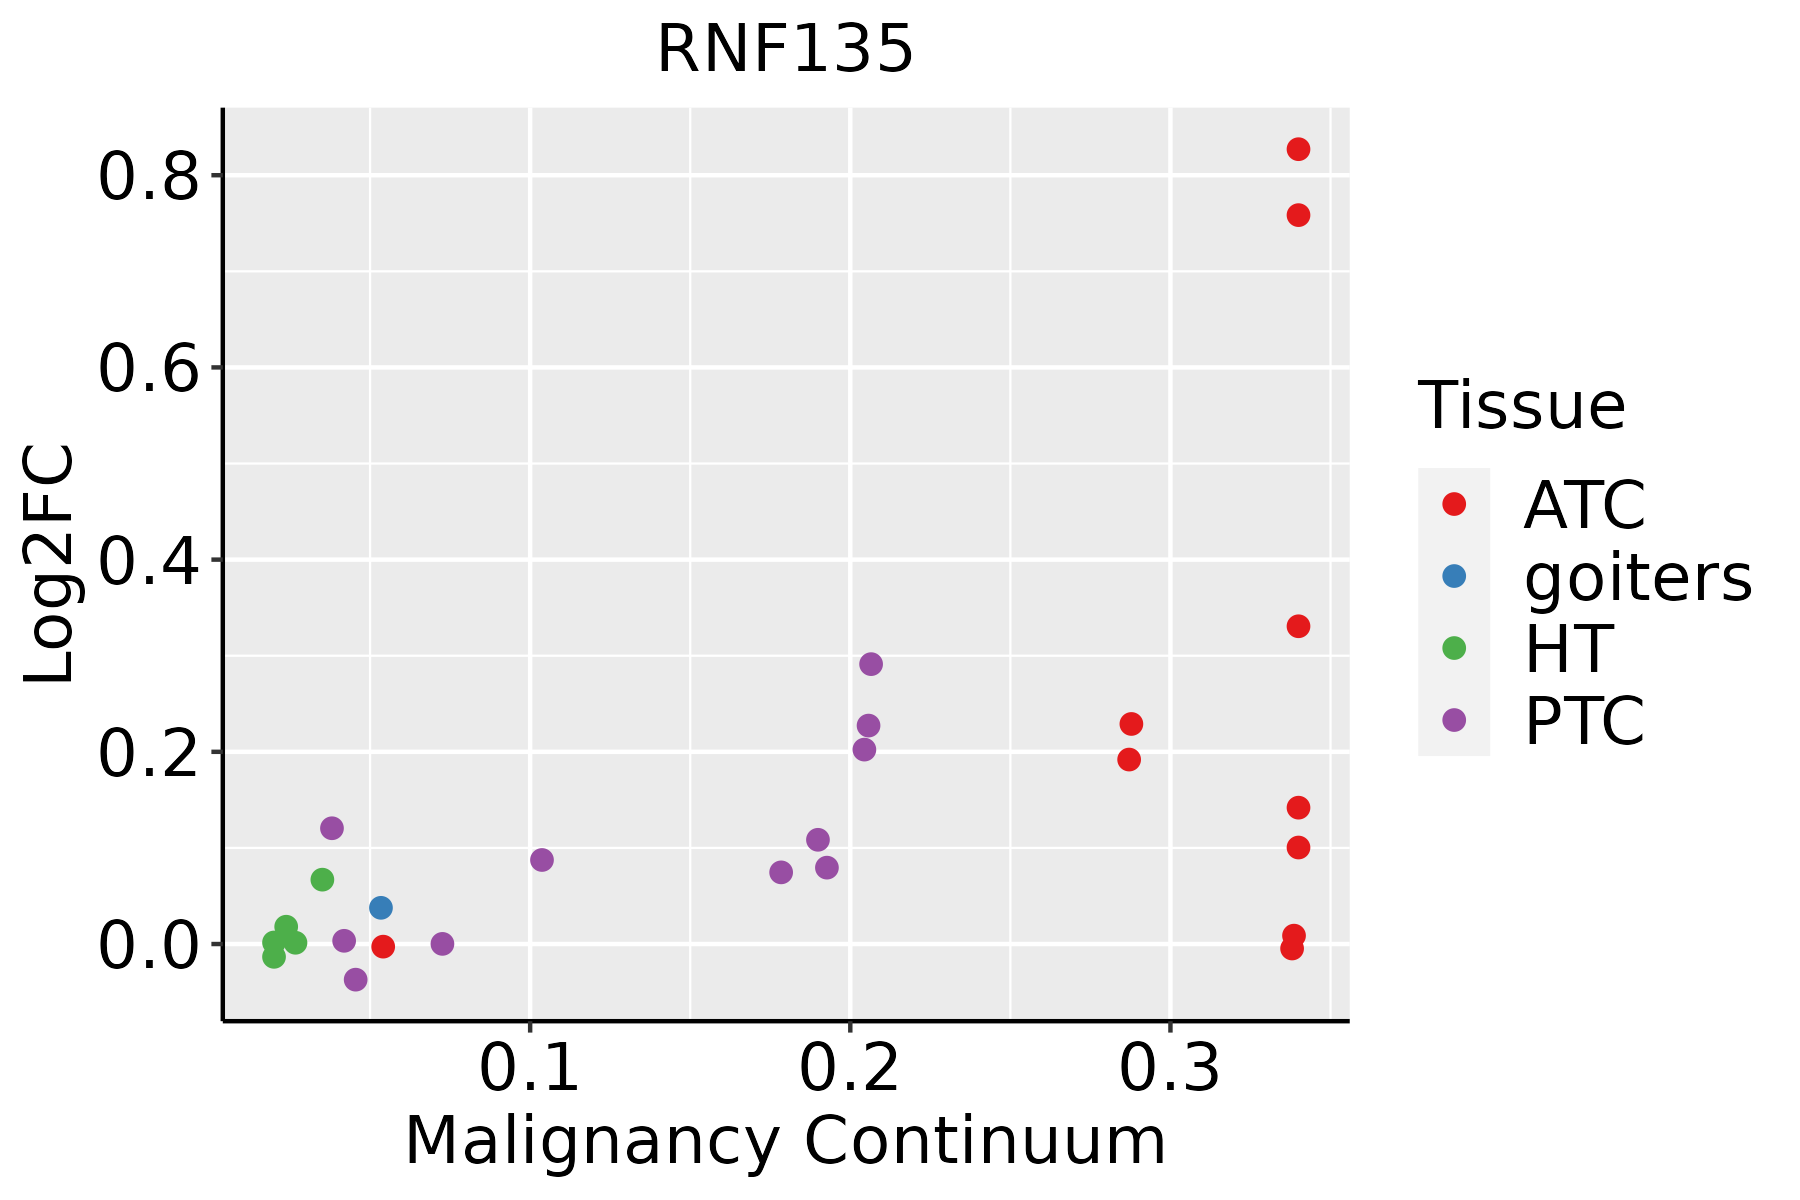 | ATC: Anaplastic thyroid cancer |
| HT: Hashimoto's thyroiditis | ||
| PTC: Papillary thyroid cancer |
| ∗log2FC in expression of this searched gene in stem-like cells from each diseased tissue sample relative to stem-like cells in normal samples in each tissue plotted against the malignancy continuum. Samples are colored based on if they are from different disease stage. |
Top |
Malignant transformation related pathway analysis |
| Find out the enriched GO biological processes and KEGG pathways involved in transition from healthy to precancer to cancer |
| Tissue | Disease Stage | Enriched GO biological Processes |
| Colorectum | AD |  |
| Colorectum | SER |  |
| Colorectum | MSS |  |
| Colorectum | MSI-H |  |
| Colorectum | FAP |  |
| ∗Top 15 enriched GO BP terms are showed in the bar plot of each disease state in each tissue. Each row represents a significant GO biological process which is colored according to the -log10(p.adjust). |
| Page: 1 2 3 4 5 6 7 8 9 |
| GO ID | Tissue | Disease Stage | Description | Gene Ratio | Bg Ratio | pvalue | p.adjust | Count |
| GO:000020916 | Esophagus | HGIN | protein polyubiquitination | 58/2587 | 236/18723 | 6.29e-06 | 1.97e-04 | 58 |
| GO:003052220 | Esophagus | HGIN | intracellular receptor signaling pathway | 62/2587 | 265/18723 | 1.63e-05 | 4.50e-04 | 62 |
| GO:005125826 | Esophagus | HGIN | protein polymerization | 66/2587 | 297/18723 | 4.96e-05 | 1.19e-03 | 66 |
| GO:00027538 | Esophagus | HGIN | cytoplasmic pattern recognition receptor signaling pathway | 19/2587 | 60/18723 | 3.07e-04 | 5.15e-03 | 19 |
| GO:00395284 | Esophagus | HGIN | cytoplasmic pattern recognition receptor signaling pathway in response to virus | 13/2587 | 34/18723 | 3.51e-04 | 5.65e-03 | 13 |
| GO:00395295 | Esophagus | HGIN | RIG-I signaling pathway | 11/2587 | 27/18723 | 5.28e-04 | 7.56e-03 | 11 |
| GO:00705345 | Esophagus | HGIN | protein K63-linked ubiquitination | 17/2587 | 56/18723 | 1.07e-03 | 1.32e-02 | 17 |
| GO:00324817 | Esophagus | HGIN | positive regulation of type I interferon production | 16/2587 | 58/18723 | 4.35e-03 | 3.84e-02 | 16 |
| GO:00985867 | Esophagus | HGIN | cellular response to virus | 21/2587 | 84/18723 | 4.35e-03 | 3.84e-02 | 21 |
| GO:000961517 | Esophagus | HGIN | response to virus | 69/2587 | 367/18723 | 4.39e-03 | 3.86e-02 | 69 |
| GO:00324794 | Esophagus | HGIN | regulation of type I interferon production | 23/2587 | 95/18723 | 4.51e-03 | 3.93e-02 | 23 |
| GO:00326064 | Esophagus | HGIN | type I interferon production | 23/2587 | 95/18723 | 4.51e-03 | 3.93e-02 | 23 |
| GO:000020917 | Esophagus | ESCC | protein polyubiquitination | 170/8552 | 236/18723 | 1.40e-16 | 1.09e-14 | 170 |
| GO:000961518 | Esophagus | ESCC | response to virus | 238/8552 | 367/18723 | 6.65e-14 | 3.32e-12 | 238 |
| GO:00516075 | Esophagus | ESCC | defense response to virus | 171/8552 | 265/18723 | 3.91e-10 | 1.05e-08 | 171 |
| GO:01405465 | Esophagus | ESCC | defense response to symbiont | 171/8552 | 265/18723 | 3.91e-10 | 1.05e-08 | 171 |
| GO:0030522110 | Esophagus | ESCC | intracellular receptor signaling pathway | 170/8552 | 265/18723 | 8.58e-10 | 2.09e-08 | 170 |
| GO:0051258111 | Esophagus | ESCC | protein polymerization | 183/8552 | 297/18723 | 1.94e-08 | 3.75e-07 | 183 |
| GO:007053413 | Esophagus | ESCC | protein K63-linked ubiquitination | 44/8552 | 56/18723 | 4.84e-07 | 6.50e-06 | 44 |
| GO:00028318 | Esophagus | ESCC | regulation of response to biotic stimulus | 191/8552 | 327/18723 | 2.12e-06 | 2.45e-05 | 191 |
| Page: 1 2 3 4 5 6 7 |
| Pathway ID | Tissue | Disease Stage | Description | Gene Ratio | Bg Ratio | pvalue | p.adjust | qvalue | Count |
| Page: 1 |
Top |
Cell-cell communication analysis |
| Identification of potential cell-cell interactions between two cell types and their ligand-receptor pairs for different disease states |
| Ligand | Receptor | LRpair | Pathway | Tissue | Disease Stage |
| Page: 1 |
Top |
Single-cell gene regulatory network inference analysis |
| Find out the significant the regulons (TFs) and the target genes of each regulon across cell types for different disease states |
| TF | Cell Type | Tissue | Disease Stage | Target Gene | RSS | Regulon Activity |
| ∗The dot plots of a searched regulon are shown for all cell subpopulations in each disease state of each tissue based on the regulon specific score inferred using pySCENIC and by calculating the average expression. |
| Page: 1 |
Top |
Somatic mutation of malignant transformation related genes |
| Annotation of somatic variants for genes involved in malignant transformation |
| Hugo Symbol | Variant Class | Variant Classification | dbSNP RS | HGVSc | HGVSp | HGVSp Short | SWISSPROT | BIOTYPE | SIFT | PolyPhen | Tumor Sample Barcode | Tissue | Histology | Sex | Age | Stage | Therapy Types | Drugs | Outcome |
| RNF135 | SNV | Missense_Mutation | c.979N>T | p.Val327Phe | p.V327F | Q8IUD6 | protein_coding | deleterious(0) | probably_damaging(0.964) | TCGA-AN-A0AM-01 | Breast | breast invasive carcinoma | Female | <65 | I/II | Unknown | Unknown | SD | |
| RNF135 | SNV | Missense_Mutation | c.929C>T | p.Ser310Phe | p.S310F | Q8IUD6 | protein_coding | deleterious(0.01) | probably_damaging(0.996) | TCGA-B6-A0RH-01 | Breast | breast invasive carcinoma | Female | <65 | I/II | Unknown | Unknown | PD | |
| RNF135 | SNV | Missense_Mutation | novel | c.1253N>T | p.Gly418Val | p.G418V | Q8IUD6 | protein_coding | deleterious(0) | probably_damaging(0.998) | TCGA-D8-A73W-01 | Breast | breast invasive carcinoma | Female | >=65 | III/IV | Hormone Therapy | tamoxiphen | PD |
| RNF135 | SNV | Missense_Mutation | novel | c.800N>T | p.Ser267Ile | p.S267I | Q8IUD6 | protein_coding | deleterious(0) | possibly_damaging(0.873) | TCGA-2W-A8YY-01 | Cervix | cervical & endocervical cancer | Female | <65 | I/II | Chemotherapy | cisplatin | CR |
| RNF135 | SNV | Missense_Mutation | rs141191751 | c.518N>G | p.Ala173Gly | p.A173G | Q8IUD6 | protein_coding | tolerated(0.2) | benign(0) | TCGA-C5-A1M6-01 | Cervix | cervical & endocervical cancer | Female | <65 | I/II | Chemotherapy | cisplatin | PD |
| RNF135 | SNV | Missense_Mutation | rs140592050 | c.1007G>A | p.Arg336His | p.R336H | Q8IUD6 | protein_coding | deleterious(0) | probably_damaging(0.989) | TCGA-UC-A7PI-01 | Cervix | cervical & endocervical cancer | Female | <65 | I/II | Unknown | Unknown | PD |
| RNF135 | SNV | Missense_Mutation | rs747613478 | c.757N>T | p.Arg253Trp | p.R253W | Q8IUD6 | protein_coding | deleterious(0.03) | benign(0.328) | TCGA-AA-3939-01 | Colorectum | colon adenocarcinoma | Male | >=65 | I/II | Unknown | Unknown | SD |
| RNF135 | SNV | Missense_Mutation | rs121918162 | c.857N>A | p.Arg286His | p.R286H | Q8IUD6 | protein_coding | tolerated(0.56) | benign(0) | TCGA-AA-A00N-01 | Colorectum | colon adenocarcinoma | Male | >=65 | I/II | Unknown | Unknown | PD |
| RNF135 | SNV | Missense_Mutation | c.1102C>A | p.Leu368Ile | p.L368I | Q8IUD6 | protein_coding | tolerated(0.11) | possibly_damaging(0.873) | TCGA-D5-6928-01 | Colorectum | colon adenocarcinoma | Male | >=65 | I/II | Unknown | Unknown | SD | |
| RNF135 | SNV | Missense_Mutation | rs373800092 | c.1006N>T | p.Arg336Cys | p.R336C | Q8IUD6 | protein_coding | deleterious(0) | probably_damaging(0.989) | TCGA-AJ-A3EK-01 | Endometrium | uterine corpus endometrioid carcinoma | Female | <65 | I/II | Chemotherapy | carboplatin | CR |
| Page: 1 2 3 |
Top |
Related drugs of malignant transformation related genes |
| Identification of chemicals and drugs interact with genes involved in malignant transfromation |
| (DGIdb 4.0) |
| Entrez ID | Symbol | Category | Interaction Types | Drug Claim Name | Drug Name | PMIDs |
| Page: 1 |

Copyright 2023-Present -The University of Texas Health Science Center at Houston |