
|
|||||
|
 | |
| |
| |
| |
| |
| |
|
Gene: RNF130 |
Gene summary for RNF130 |
| Gene information | Species | Human | Gene symbol | RNF130 | Gene ID | 55819 |
| Gene name | ring finger protein 130 | |
| Gene Alias | G1RP | |
| Cytomap | 5q35.3 | |
| Gene Type | protein-coding | GO ID | GO:0006464 | UniProtAcc | Q86XS8 |
Top |
Malignant transformation analysis |
| Identification of the aberrant gene expression in precancerous and cancerous lesions by comparing the gene expression of stem-like cells in diseased tissues with normal stem cells |
| Entrez ID | Symbol | Replicates | Species | Organ | Tissue | Adj P-value | Log2FC | Malignancy |
| 55819 | RNF130 | HTA11_3410_2000001011 | Human | Colorectum | AD | 1.03e-08 | -4.05e-01 | 0.0155 |
| 55819 | RNF130 | HTA11_2487_2000001011 | Human | Colorectum | SER | 1.81e-02 | -4.11e-01 | -0.1808 |
| 55819 | RNF130 | HTA11_99999974143_84620 | Human | Colorectum | MSS | 2.47e-04 | -3.87e-01 | 0.3005 |
| 55819 | RNF130 | A001-C-207 | Human | Colorectum | FAP | 9.94e-08 | -4.69e-01 | 0.1278 |
| 55819 | RNF130 | A015-C-203 | Human | Colorectum | FAP | 3.85e-24 | -4.37e-01 | -0.1294 |
| 55819 | RNF130 | A015-C-204 | Human | Colorectum | FAP | 1.46e-05 | -3.09e-01 | -0.0228 |
| 55819 | RNF130 | A002-C-201 | Human | Colorectum | FAP | 1.23e-12 | -3.63e-01 | 0.0324 |
| 55819 | RNF130 | A002-C-203 | Human | Colorectum | FAP | 2.45e-07 | -2.75e-01 | 0.2786 |
| 55819 | RNF130 | A001-C-119 | Human | Colorectum | FAP | 3.44e-04 | -3.86e-01 | -0.1557 |
| 55819 | RNF130 | A001-C-108 | Human | Colorectum | FAP | 1.52e-16 | -2.92e-01 | -0.0272 |
| 55819 | RNF130 | A002-C-205 | Human | Colorectum | FAP | 3.19e-20 | -5.27e-01 | -0.1236 |
| 55819 | RNF130 | A001-C-104 | Human | Colorectum | FAP | 1.05e-03 | -2.80e-01 | 0.0184 |
| 55819 | RNF130 | A015-C-006 | Human | Colorectum | FAP | 1.99e-14 | -5.33e-01 | -0.0994 |
| 55819 | RNF130 | A015-C-106 | Human | Colorectum | FAP | 8.75e-11 | -1.75e-01 | -0.0511 |
| 55819 | RNF130 | A002-C-114 | Human | Colorectum | FAP | 5.50e-19 | -5.35e-01 | -0.1561 |
| 55819 | RNF130 | A015-C-104 | Human | Colorectum | FAP | 3.11e-24 | -3.58e-01 | -0.1899 |
| 55819 | RNF130 | A001-C-014 | Human | Colorectum | FAP | 3.78e-13 | -3.80e-01 | 0.0135 |
| 55819 | RNF130 | A002-C-016 | Human | Colorectum | FAP | 3.46e-23 | -3.73e-01 | 0.0521 |
| 55819 | RNF130 | A015-C-002 | Human | Colorectum | FAP | 2.08e-09 | -4.31e-01 | -0.0763 |
| 55819 | RNF130 | A001-C-203 | Human | Colorectum | FAP | 5.58e-10 | -1.51e-01 | -0.0481 |
| Page: 1 2 3 4 5 6 7 |
| Tissue | Expression Dynamics | Abbreviation |
| Colorectum (GSE201348) | 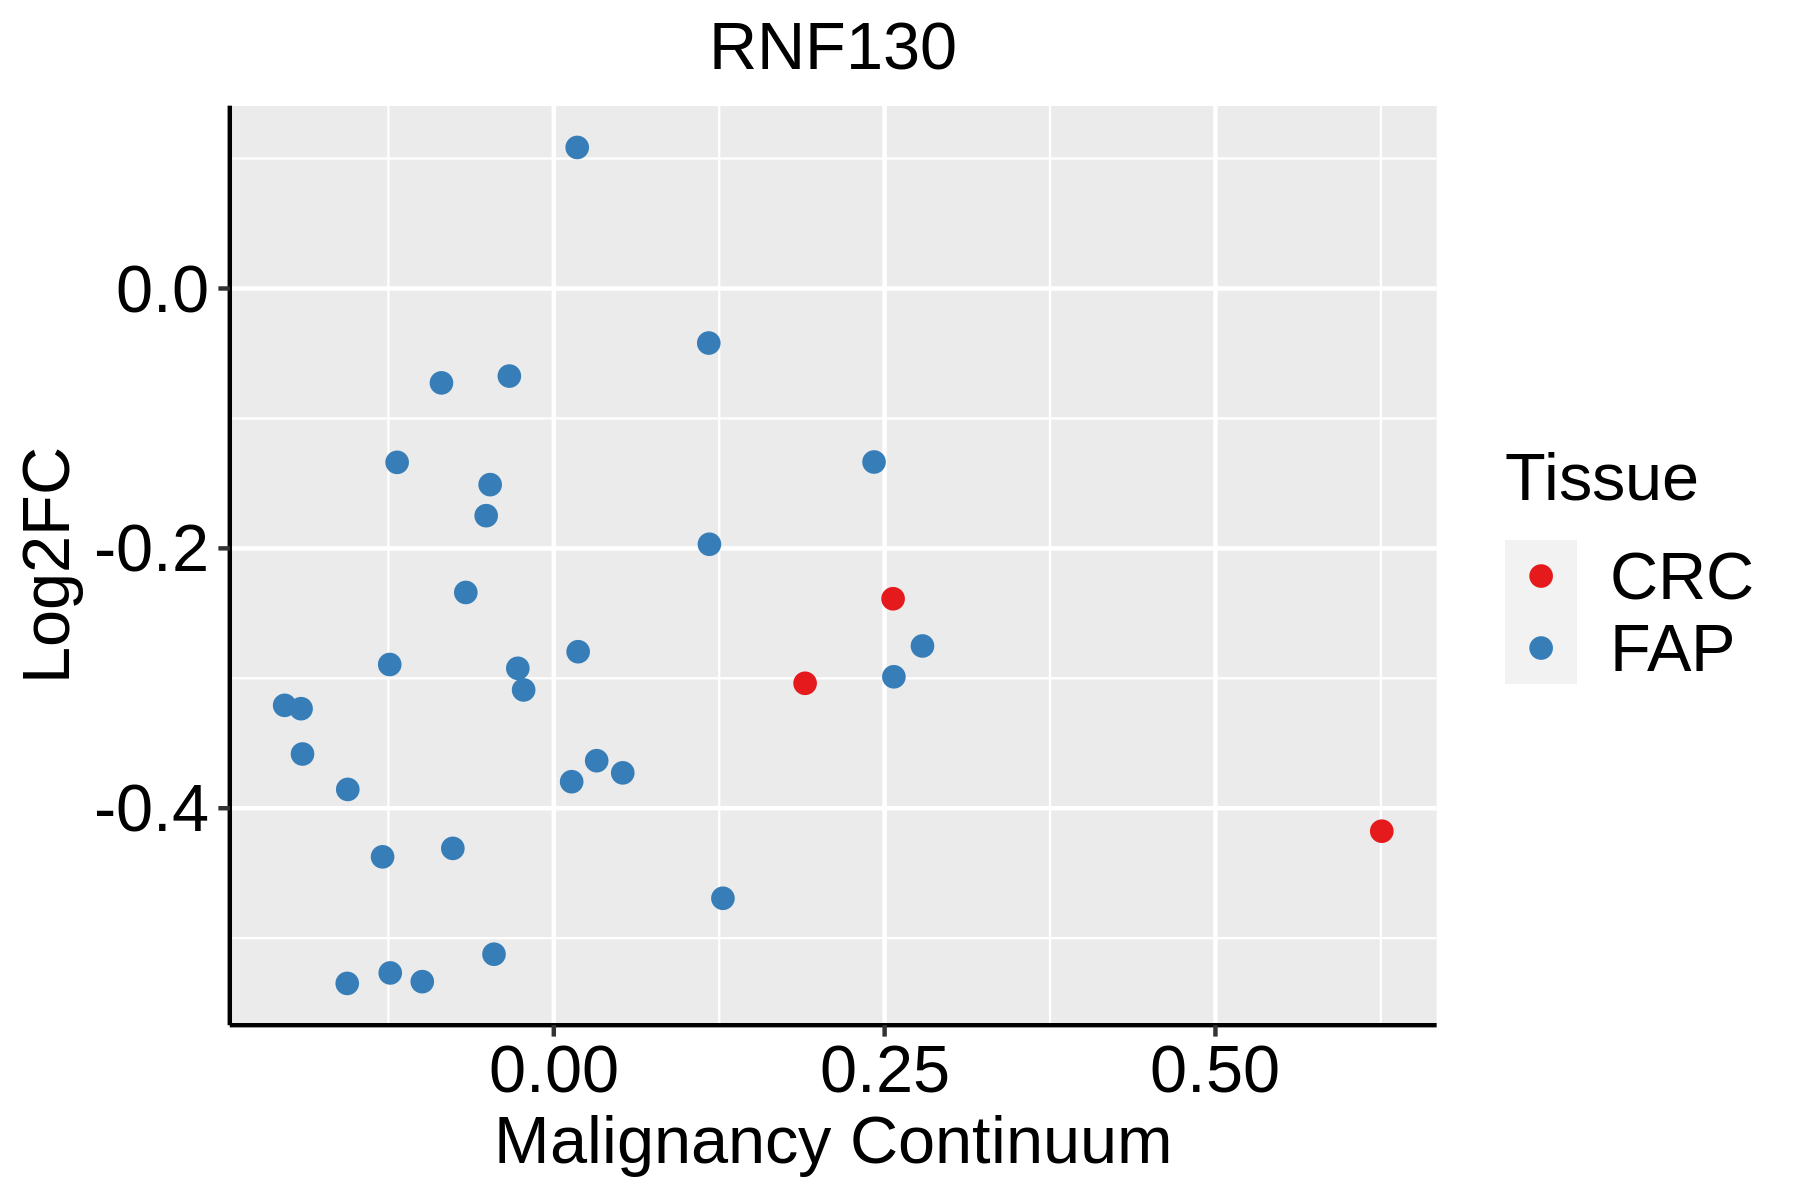 | FAP: Familial adenomatous polyposis |
| CRC: Colorectal cancer | ||
| Colorectum (HTA11) |  | AD: Adenomas |
| SER: Sessile serrated lesions | ||
| MSI-H: Microsatellite-high colorectal cancer | ||
| MSS: Microsatellite stable colorectal cancer | ||
| Esophagus | 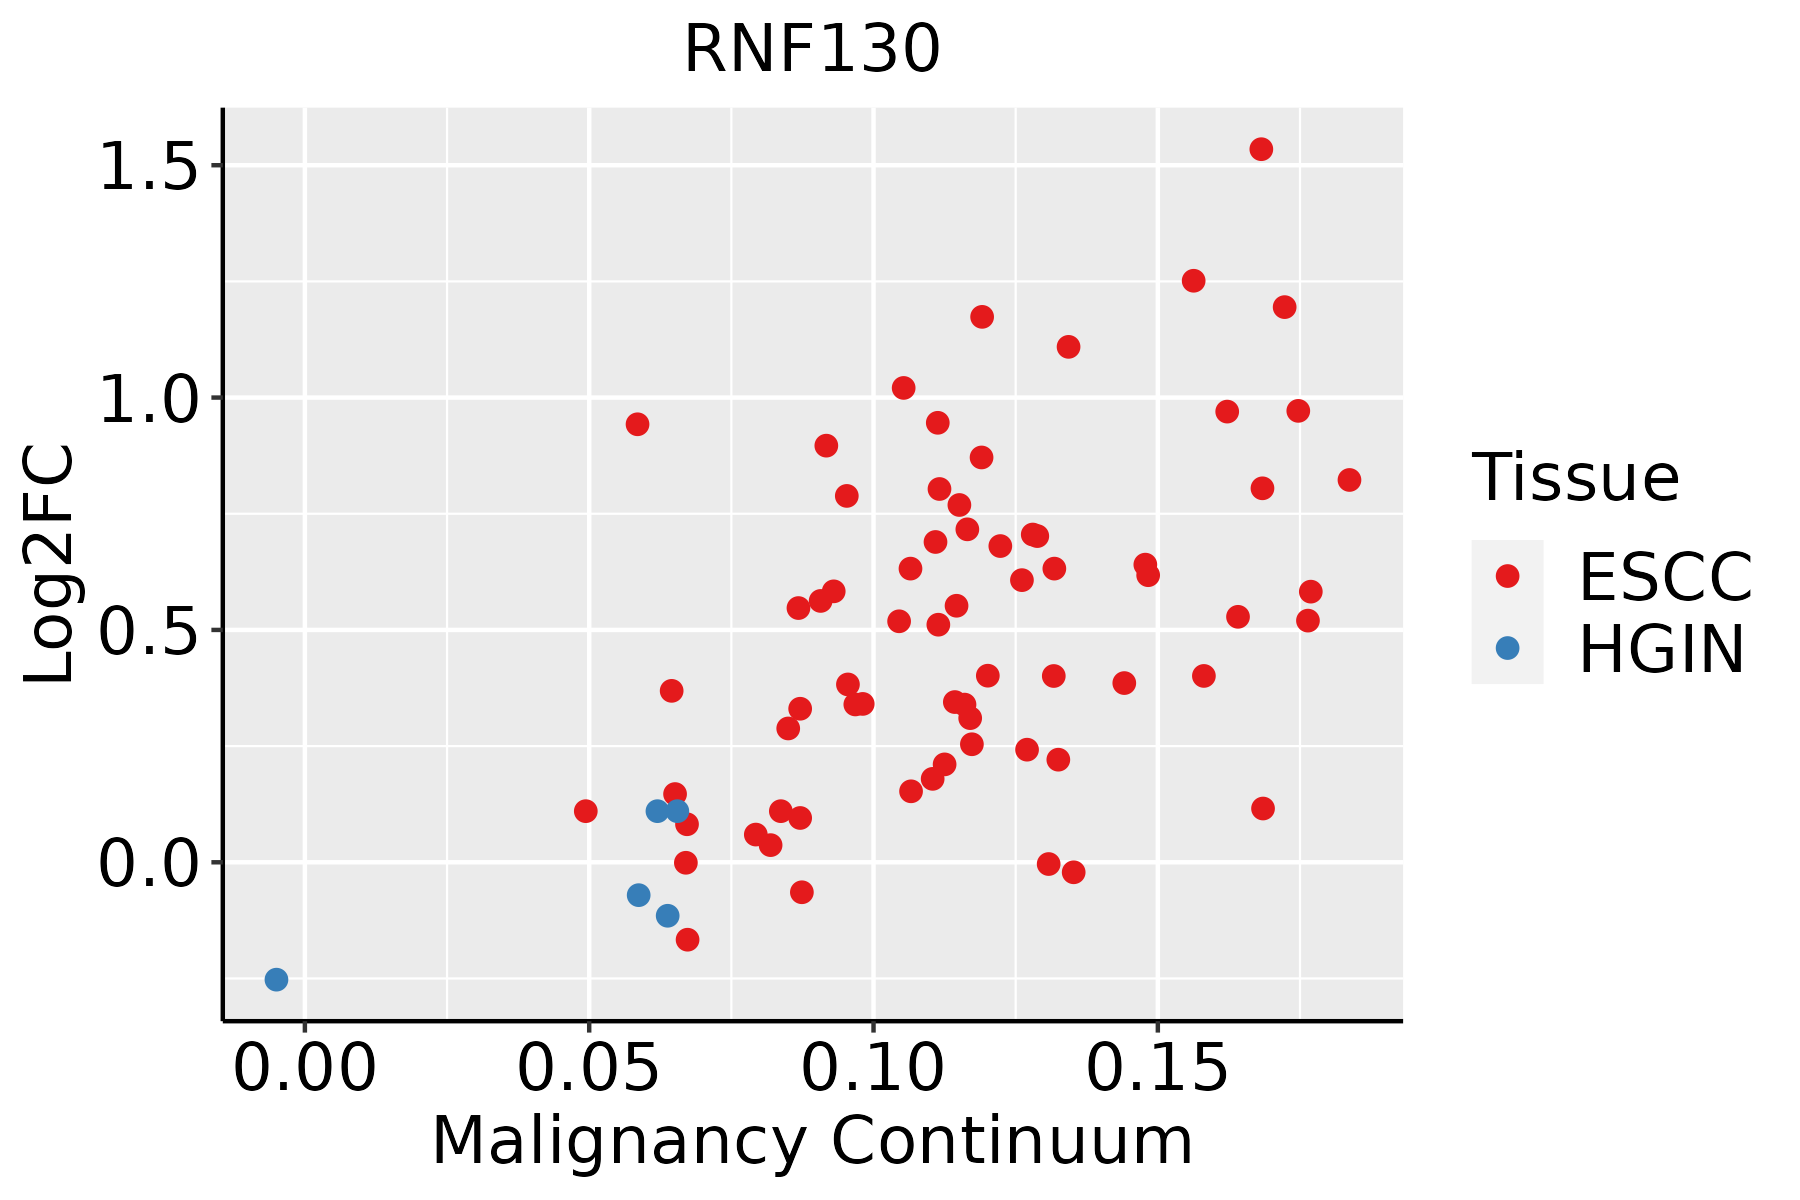 | ESCC: Esophageal squamous cell carcinoma |
| HGIN: High-grade intraepithelial neoplasias | ||
| LGIN: Low-grade intraepithelial neoplasias | ||
| Liver | 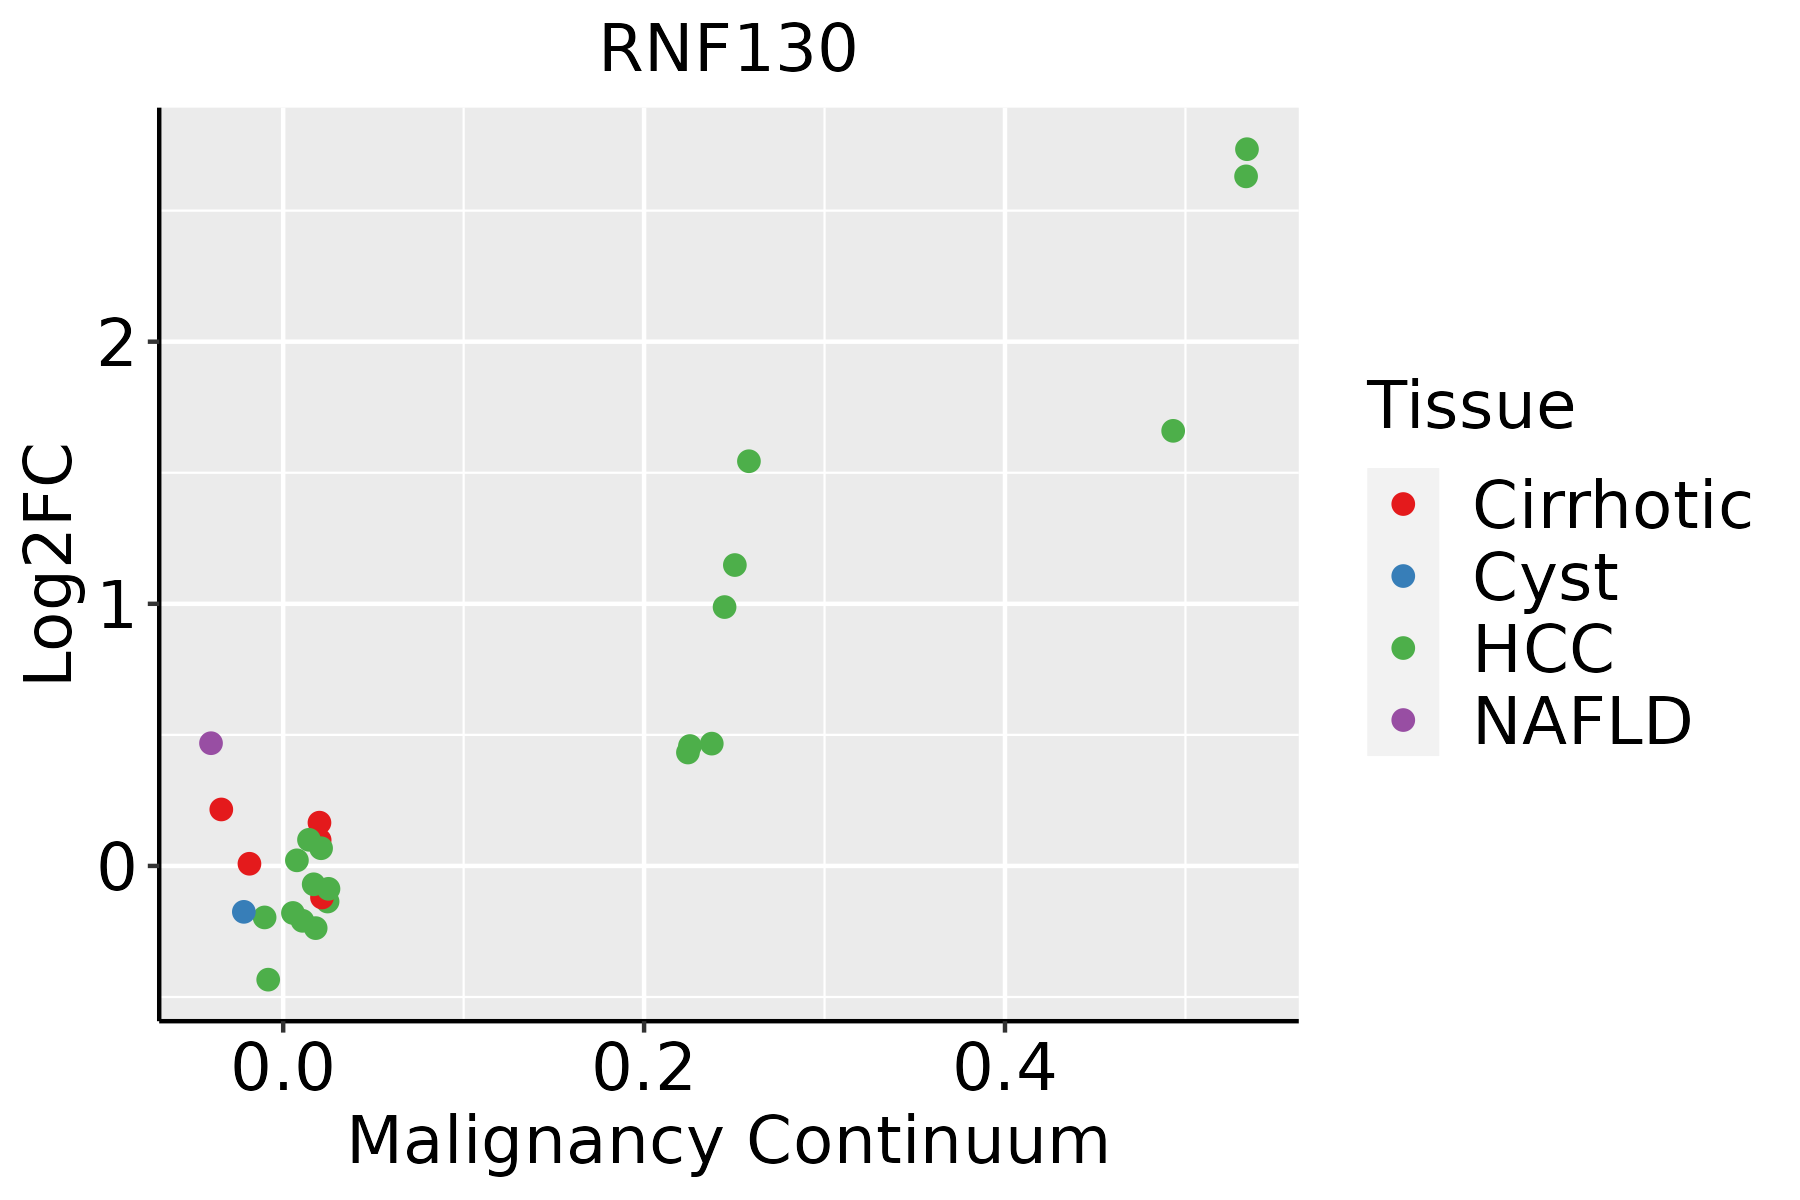 | HCC: Hepatocellular carcinoma |
| NAFLD: Non-alcoholic fatty liver disease | ||
| Oral Cavity | 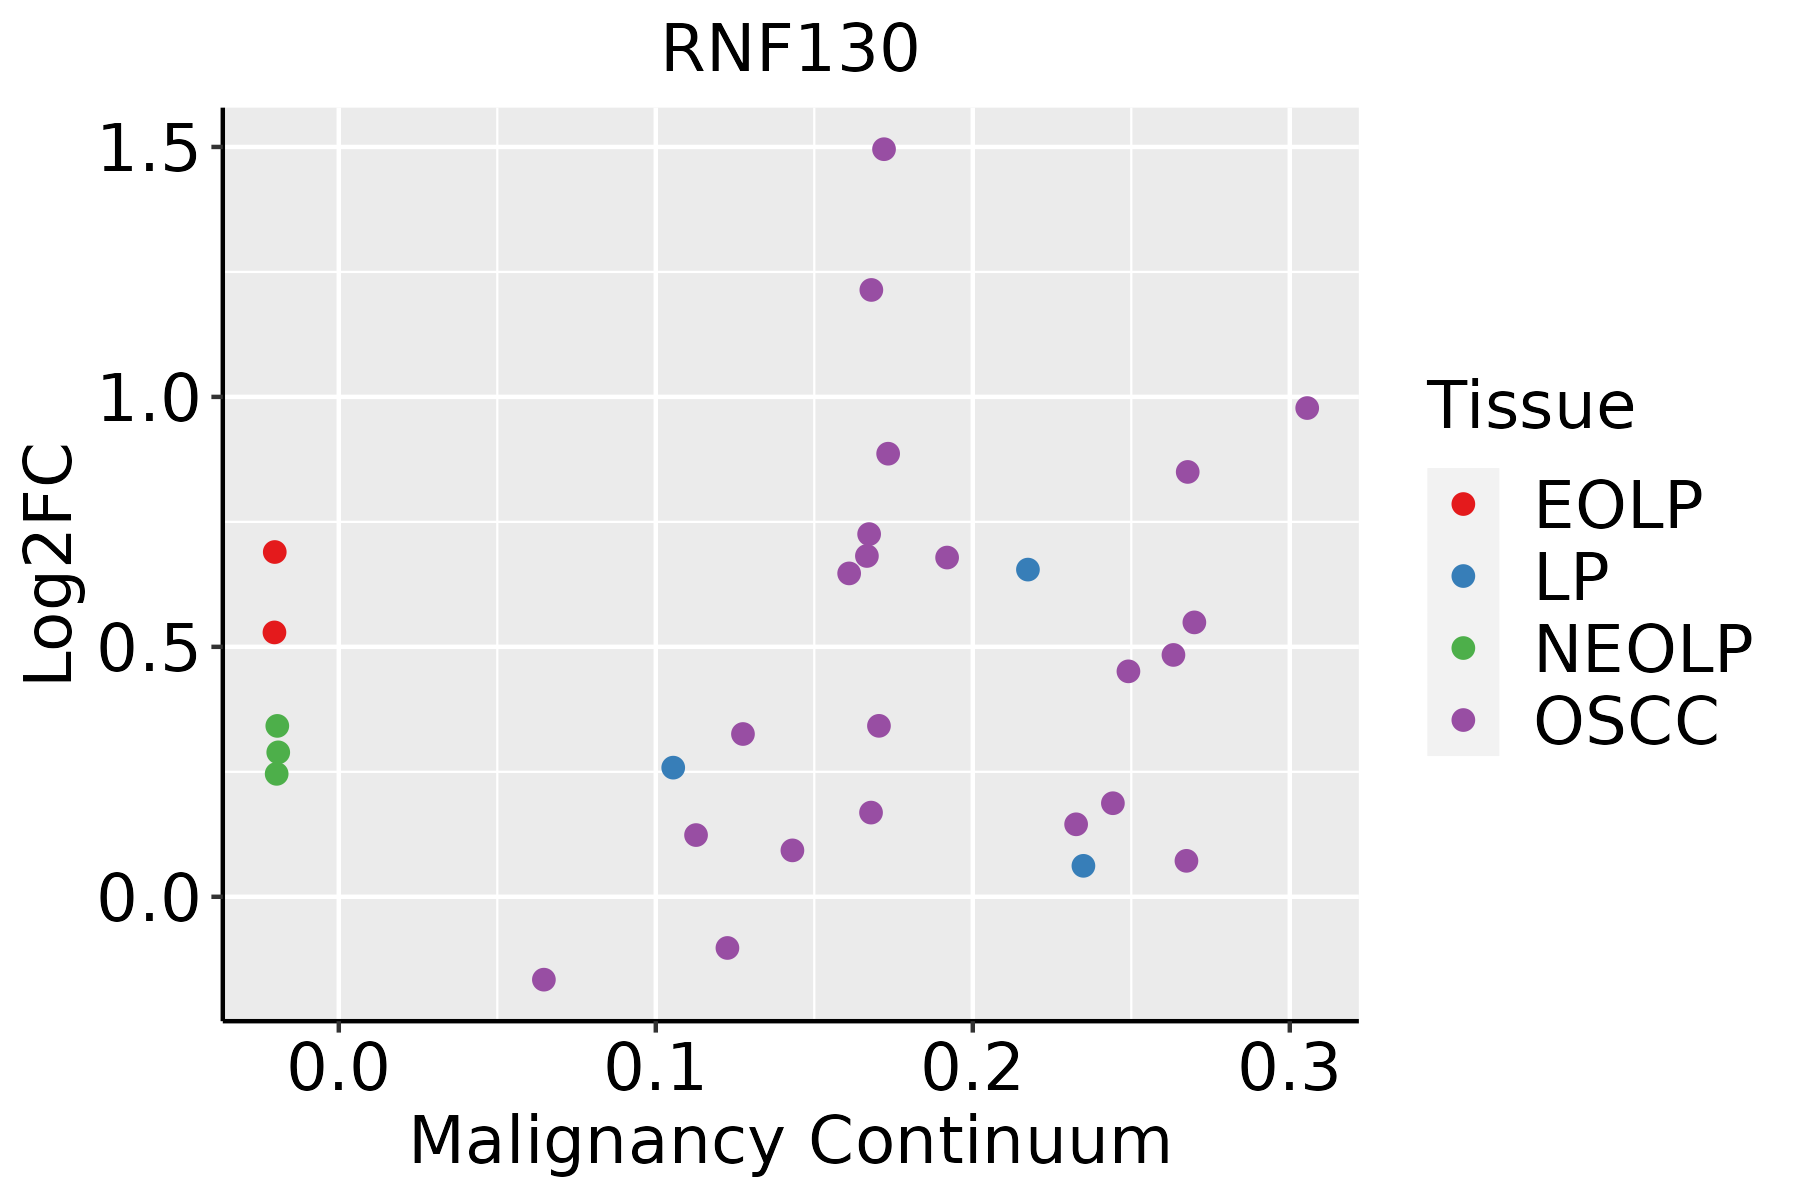 | EOLP: Erosive Oral lichen planus |
| LP: leukoplakia | ||
| NEOLP: Non-erosive oral lichen planus | ||
| OSCC: Oral squamous cell carcinoma | ||
| Thyroid | 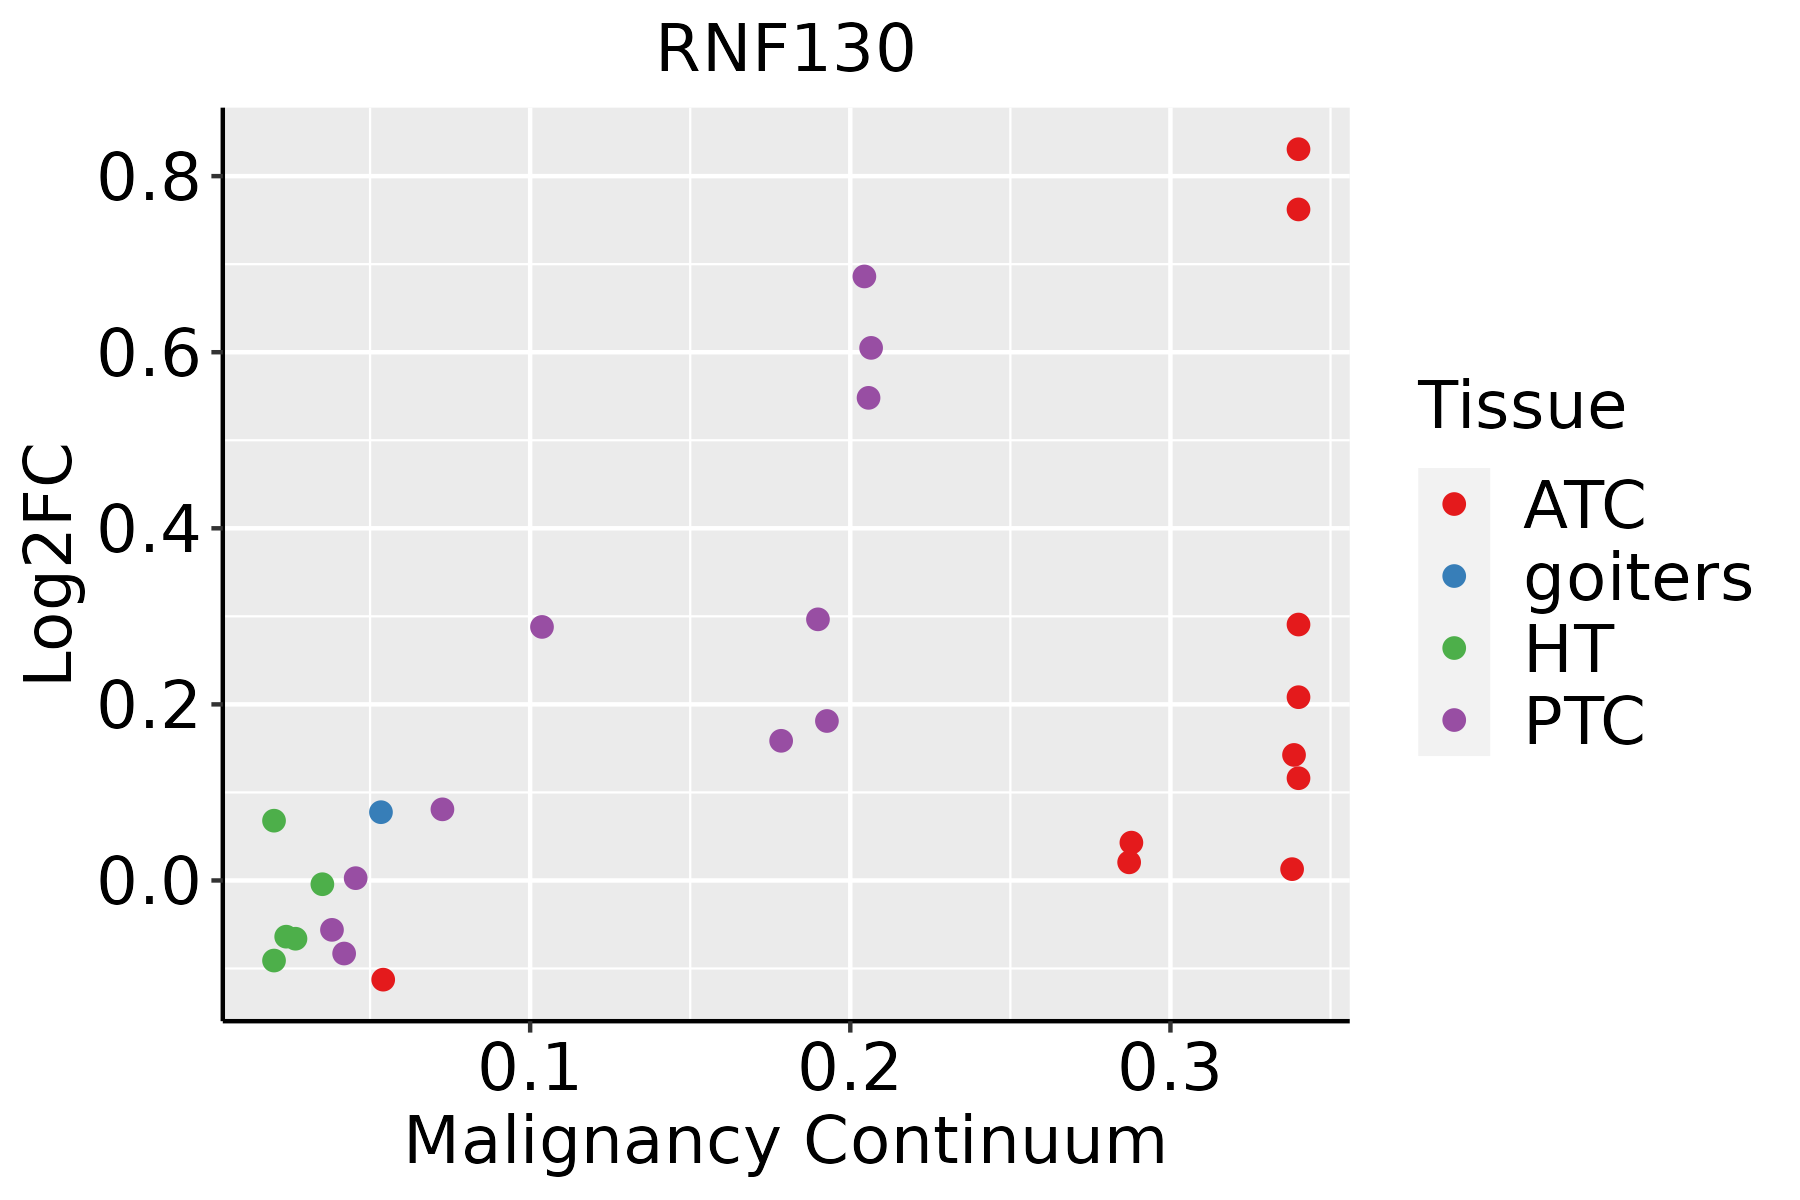 | ATC: Anaplastic thyroid cancer |
| HT: Hashimoto's thyroiditis | ||
| PTC: Papillary thyroid cancer |
| ∗log2FC in expression of this searched gene in stem-like cells from each diseased tissue sample relative to stem-like cells in normal samples in each tissue plotted against the malignancy continuum. Samples are colored based on if they are from different disease stage. |
Top |
Malignant transformation related pathway analysis |
| Find out the enriched GO biological processes and KEGG pathways involved in transition from healthy to precancer to cancer |
| Tissue | Disease Stage | Enriched GO biological Processes |
| Colorectum | AD |  |
| Colorectum | SER |  |
| Colorectum | MSS |  |
| Colorectum | MSI-H |  |
| Colorectum | FAP |  |
| ∗Top 15 enriched GO BP terms are showed in the bar plot of each disease state in each tissue. Each row represents a significant GO biological process which is colored according to the -log10(p.adjust). |
| Page: 1 2 3 4 5 6 7 8 9 |
| GO ID | Tissue | Disease Stage | Description | Gene Ratio | Bg Ratio | pvalue | p.adjust | Count |
| Page: 1 |
| Pathway ID | Tissue | Disease Stage | Description | Gene Ratio | Bg Ratio | pvalue | p.adjust | qvalue | Count |
| Page: 1 |
Top |
Cell-cell communication analysis |
| Identification of potential cell-cell interactions between two cell types and their ligand-receptor pairs for different disease states |
| Ligand | Receptor | LRpair | Pathway | Tissue | Disease Stage |
| Page: 1 |
Top |
Single-cell gene regulatory network inference analysis |
| Find out the significant the regulons (TFs) and the target genes of each regulon across cell types for different disease states |
| TF | Cell Type | Tissue | Disease Stage | Target Gene | RSS | Regulon Activity |
| ∗The dot plots of a searched regulon are shown for all cell subpopulations in each disease state of each tissue based on the regulon specific score inferred using pySCENIC and by calculating the average expression. |
| Page: 1 |
Top |
Somatic mutation of malignant transformation related genes |
| Annotation of somatic variants for genes involved in malignant transformation |
| Hugo Symbol | Variant Class | Variant Classification | dbSNP RS | HGVSc | HGVSp | HGVSp Short | SWISSPROT | BIOTYPE | SIFT | PolyPhen | Tumor Sample Barcode | Tissue | Histology | Sex | Age | Stage | Therapy Types | Drugs | Outcome |
| RNF130 | SNV | Missense_Mutation | c.805N>C | p.Glu269Gln | p.E269Q | Q86XS8 | protein_coding | deleterious(0) | probably_damaging(0.998) | TCGA-C8-A26Y-01 | Breast | breast invasive carcinoma | Female | >=65 | I/II | Unknown | Unknown | SD | |
| RNF130 | insertion | In_Frame_Ins | novel | c.285_286insAGAGGTGGGCTAGCAGAGGAGAGCCAG | p.Phe95_Phe96insArgGlyGlyLeuAlaGluGluSerGln | p.F95_F96insRGGLAEESQ | Q86XS8 | protein_coding | TCGA-AO-A0JB-01 | Breast | breast invasive carcinoma | Female | <65 | III/IV | Chemotherapy | cyclophosphamide | SD | ||
| RNF130 | SNV | Missense_Mutation | c.449N>C | p.Gly150Ala | p.G150A | Q86XS8 | protein_coding | deleterious(0.03) | possibly_damaging(0.574) | TCGA-LP-A5U2-01 | Cervix | cervical & endocervical cancer | Female | <65 | III/IV | Unknown | Unknown | SD | |
| RNF130 | SNV | Missense_Mutation | c.285C>A | p.Phe95Leu | p.F95L | Q86XS8 | protein_coding | deleterious(0.01) | benign(0.276) | TCGA-AA-3977-01 | Colorectum | colon adenocarcinoma | Male | >=65 | I/II | Unknown | Unknown | SD | |
| RNF130 | SNV | Missense_Mutation | c.682N>A | p.Asp228Asn | p.D228N | Q86XS8 | protein_coding | tolerated(0.4) | benign(0.246) | TCGA-AA-A010-01 | Colorectum | colon adenocarcinoma | Female | <65 | I/II | Chemotherapy | folinic | CR | |
| RNF130 | SNV | Missense_Mutation | c.694C>T | p.Arg232Cys | p.R232C | Q86XS8 | protein_coding | deleterious(0) | probably_damaging(0.972) | TCGA-G4-6628-01 | Colorectum | colon adenocarcinoma | Male | >=65 | I/II | Unknown | Unknown | SD | |
| RNF130 | SNV | Missense_Mutation | c.1246N>T | p.Val416Leu | p.V416L | Q86XS8 | protein_coding | tolerated_low_confidence(0.41) | benign(0) | TCGA-AG-A015-01 | Colorectum | rectum adenocarcinoma | Female | <65 | I/II | Unknown | Unknown | PD | |
| RNF130 | SNV | Missense_Mutation | c.818N>T | p.Gln273Leu | p.Q273L | Q86XS8 | protein_coding | tolerated(0.33) | benign(0) | TCGA-F5-6571-01 | Colorectum | rectum adenocarcinoma | Female | <65 | I/II | Chemotherapy | capecitabine | SD | |
| RNF130 | deletion | Frame_Shift_Del | c.305_308delNNNN | p.Lys102SerfsTer28 | p.K102Sfs*28 | Q86XS8 | protein_coding | TCGA-A6-6653-01 | Colorectum | colon adenocarcinoma | Male | >=65 | I/II | Unknown | Unknown | SD | |||
| RNF130 | SNV | Missense_Mutation | rs370848810 | c.697N>T | p.Arg233Cys | p.R233C | Q86XS8 | protein_coding | deleterious(0) | benign(0.143) | TCGA-A5-A0G1-01 | Endometrium | uterine corpus endometrioid carcinoma | Female | >=65 | I/II | Unknown | Unknown | SD |
| Page: 1 2 3 4 |
Top |
Related drugs of malignant transformation related genes |
| Identification of chemicals and drugs interact with genes involved in malignant transfromation |
| (DGIdb 4.0) |
| Entrez ID | Symbol | Category | Interaction Types | Drug Claim Name | Drug Name | PMIDs |
| Page: 1 |

Copyright 2023-Present -The University of Texas Health Science Center at Houston |