| Tissue | Expression Dynamics | Abbreviation |
| Cervix | 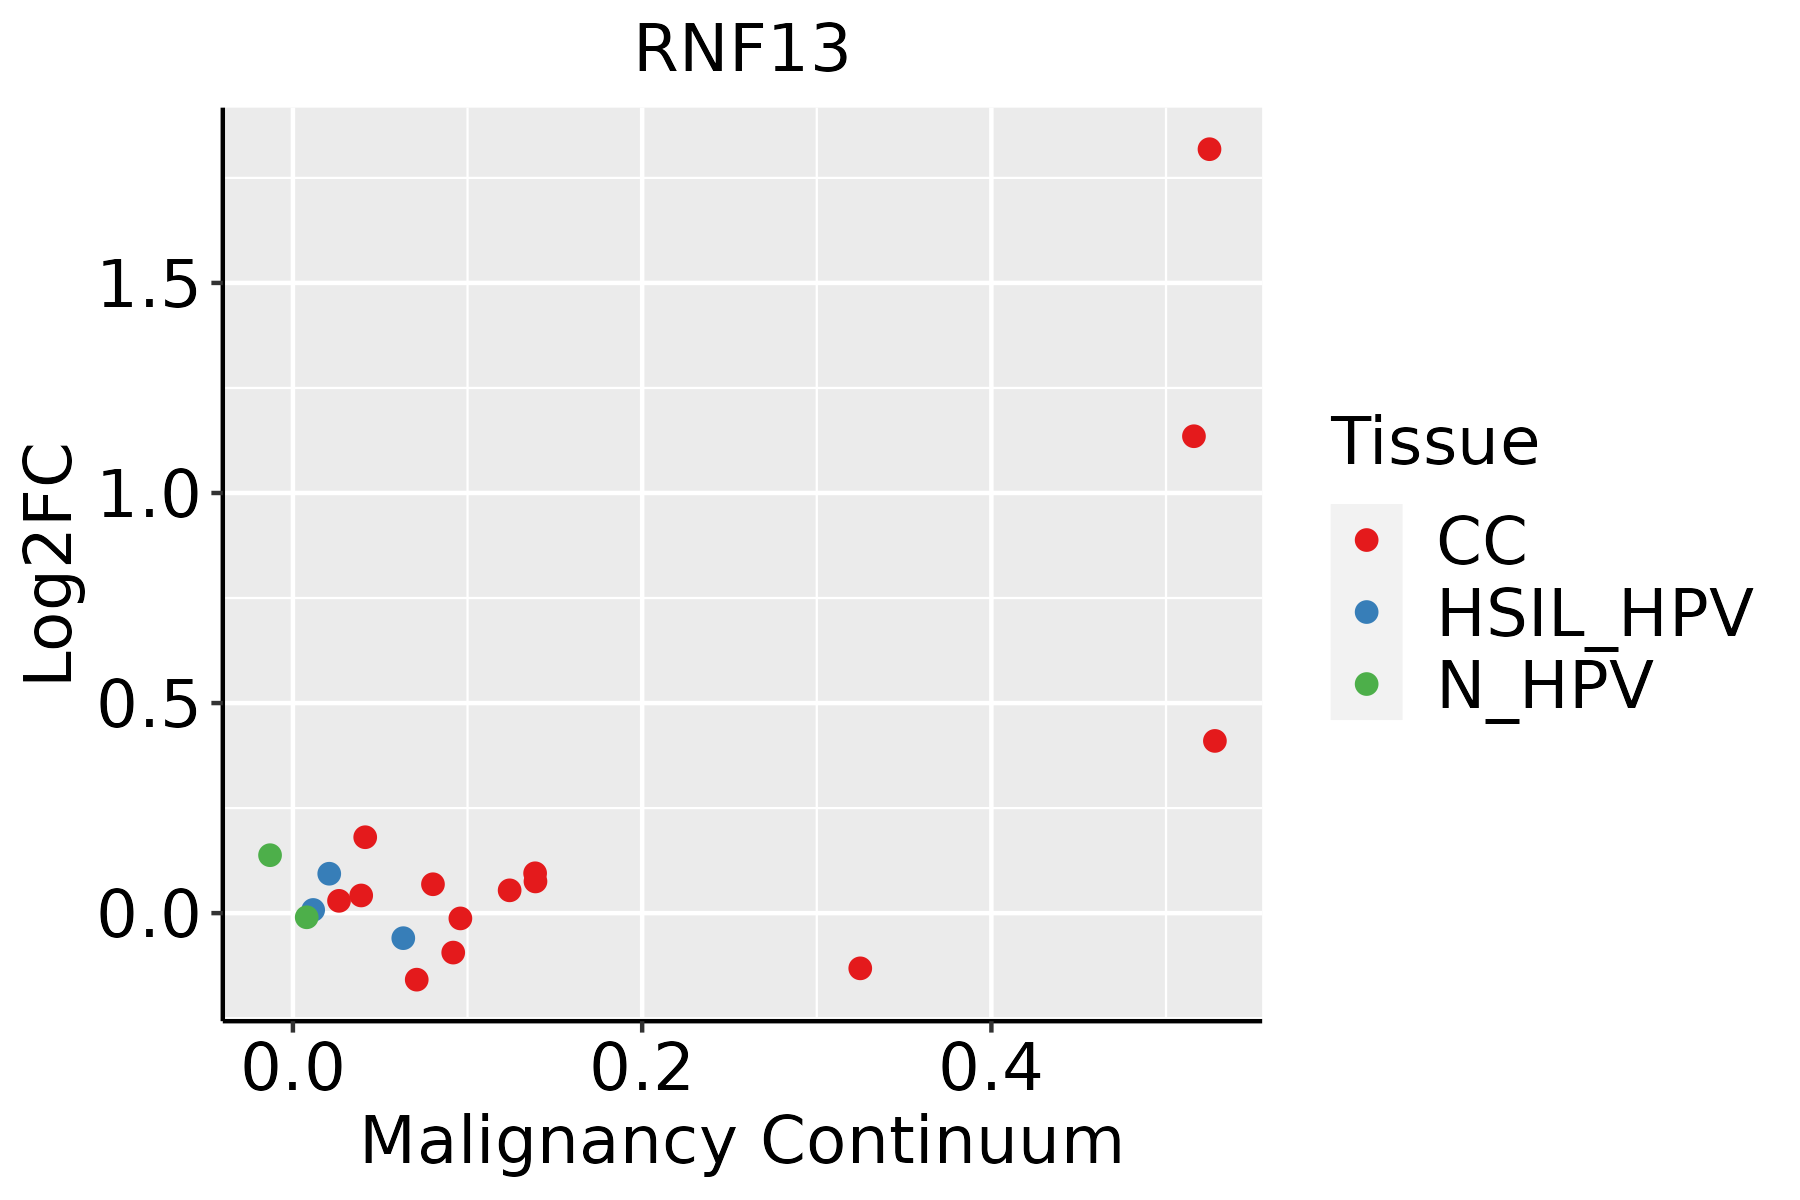 | CC: Cervix cancer |
| HSIL_HPV: HPV-infected high-grade squamous intraepithelial lesions |
| N_HPV: HPV-infected normal cervix |
| Colorectum (GSE201348) |  | FAP: Familial adenomatous polyposis |
| CRC: Colorectal cancer |
| Colorectum (HTA11) |  | AD: Adenomas |
| SER: Sessile serrated lesions |
| MSI-H: Microsatellite-high colorectal cancer |
| MSS: Microsatellite stable colorectal cancer |
| Esophagus | 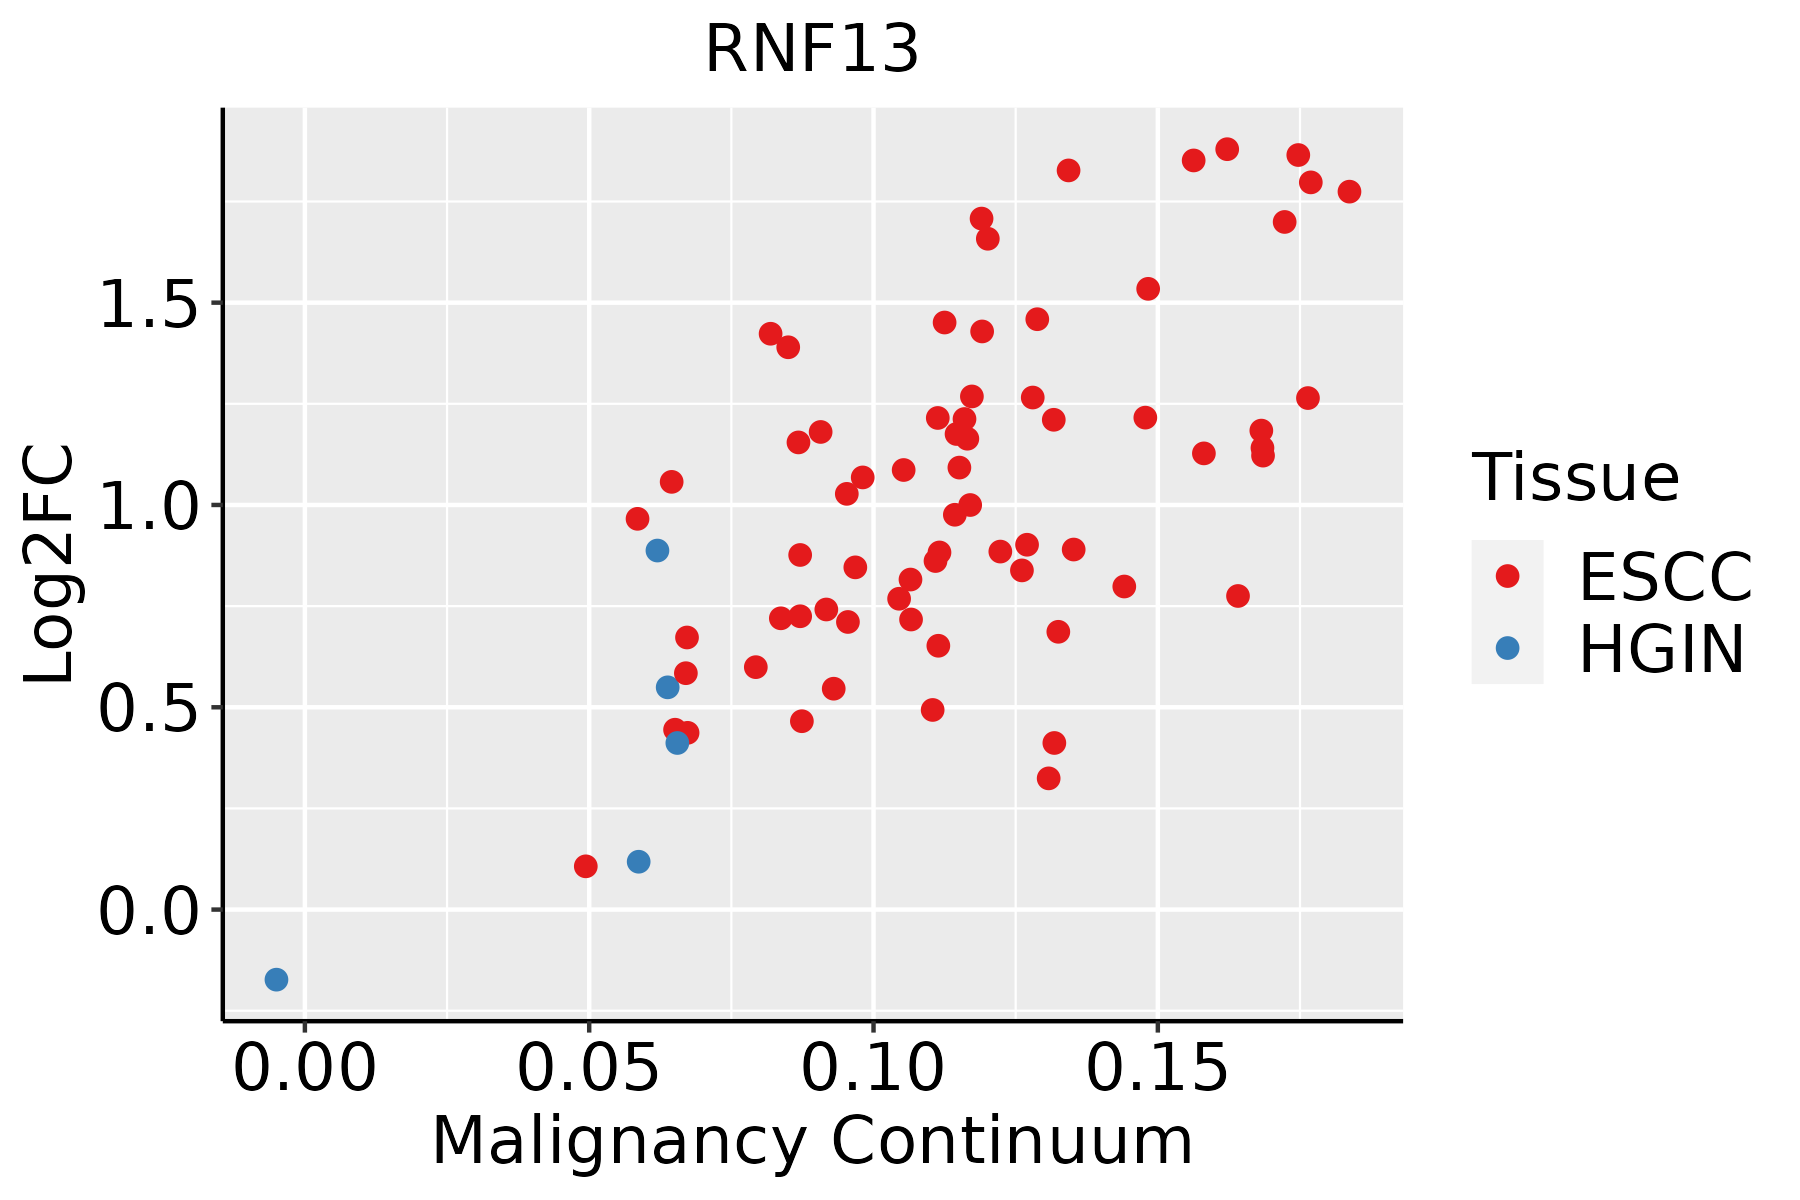 | ESCC: Esophageal squamous cell carcinoma |
| HGIN: High-grade intraepithelial neoplasias |
| LGIN: Low-grade intraepithelial neoplasias |
| Liver |  | HCC: Hepatocellular carcinoma |
| NAFLD: Non-alcoholic fatty liver disease |
| Lung | 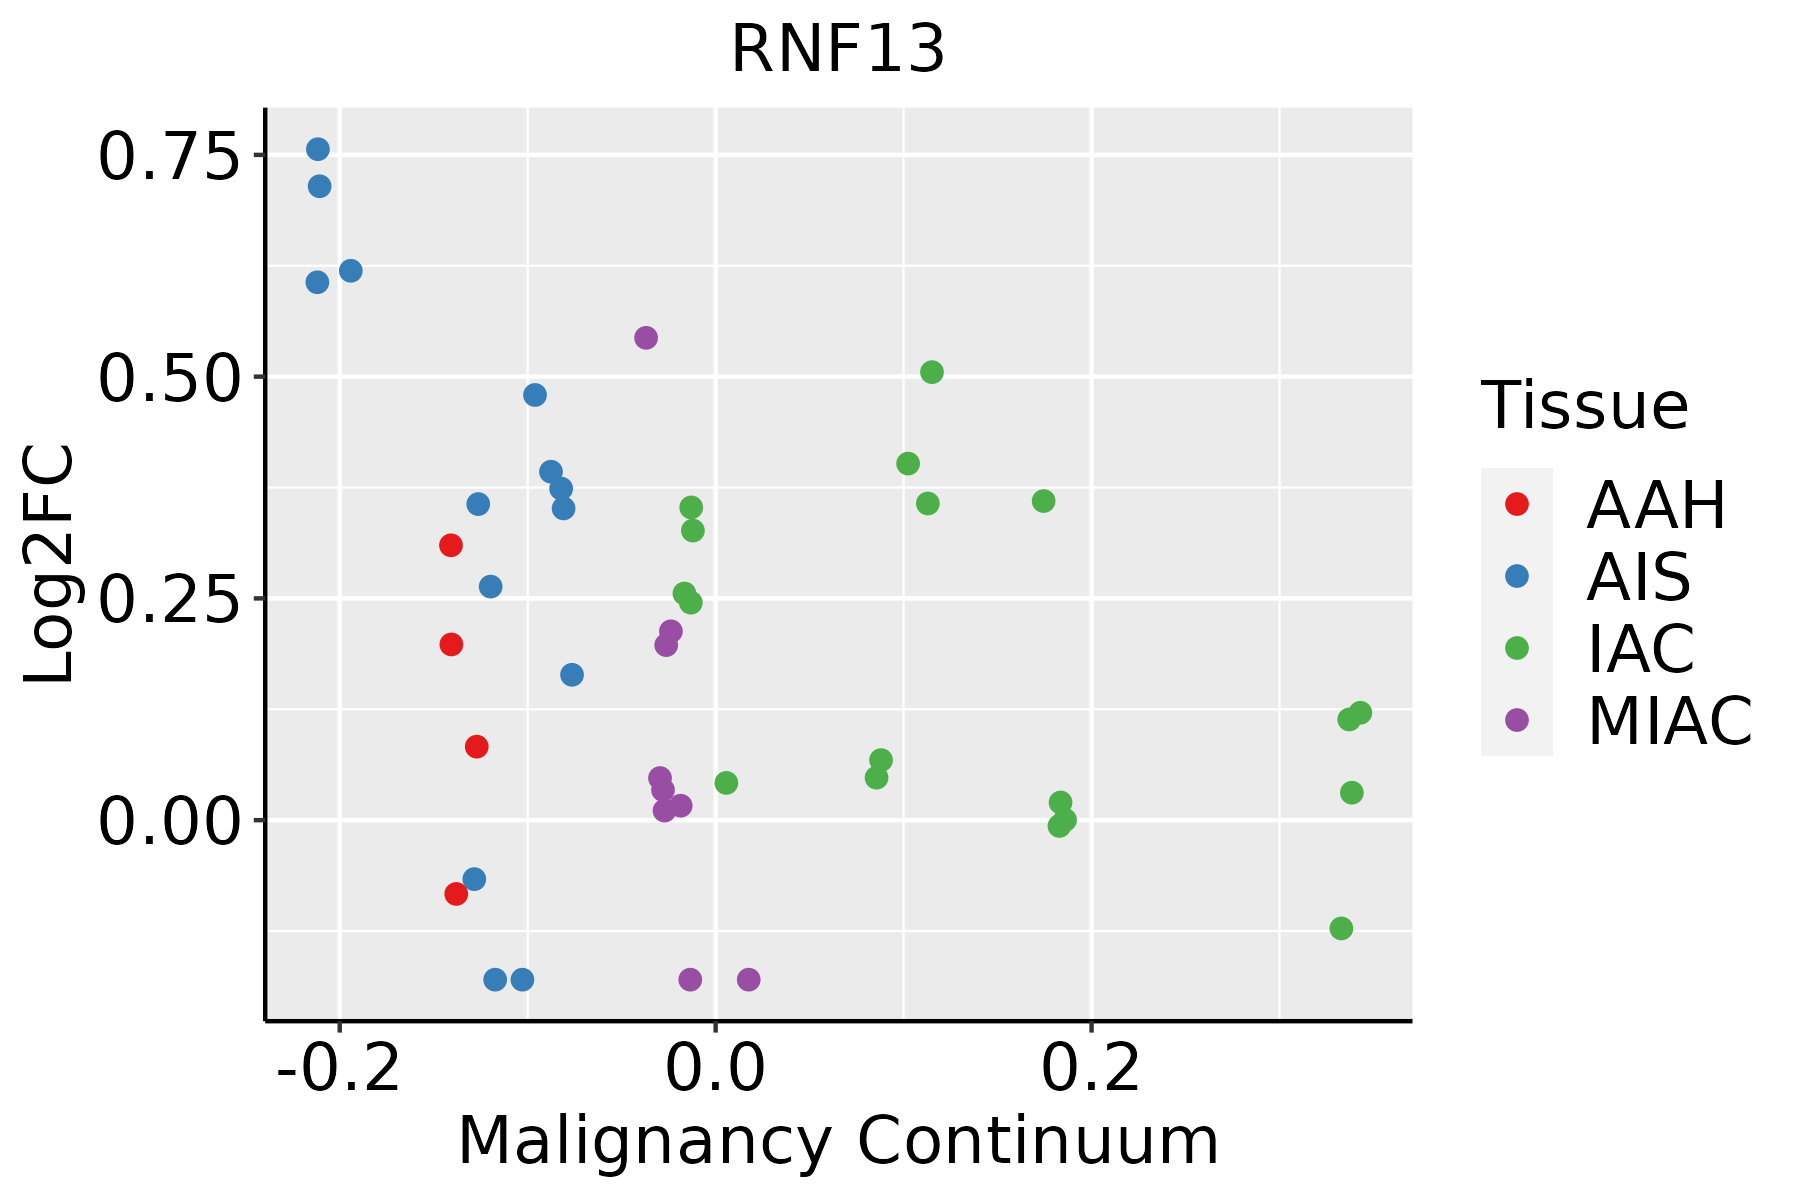 | AAH: Atypical adenomatous hyperplasia |
| AIS: Adenocarcinoma in situ |
| IAC: Invasive lung adenocarcinoma |
| MIA: Minimally invasive adenocarcinoma |
| Oral Cavity | 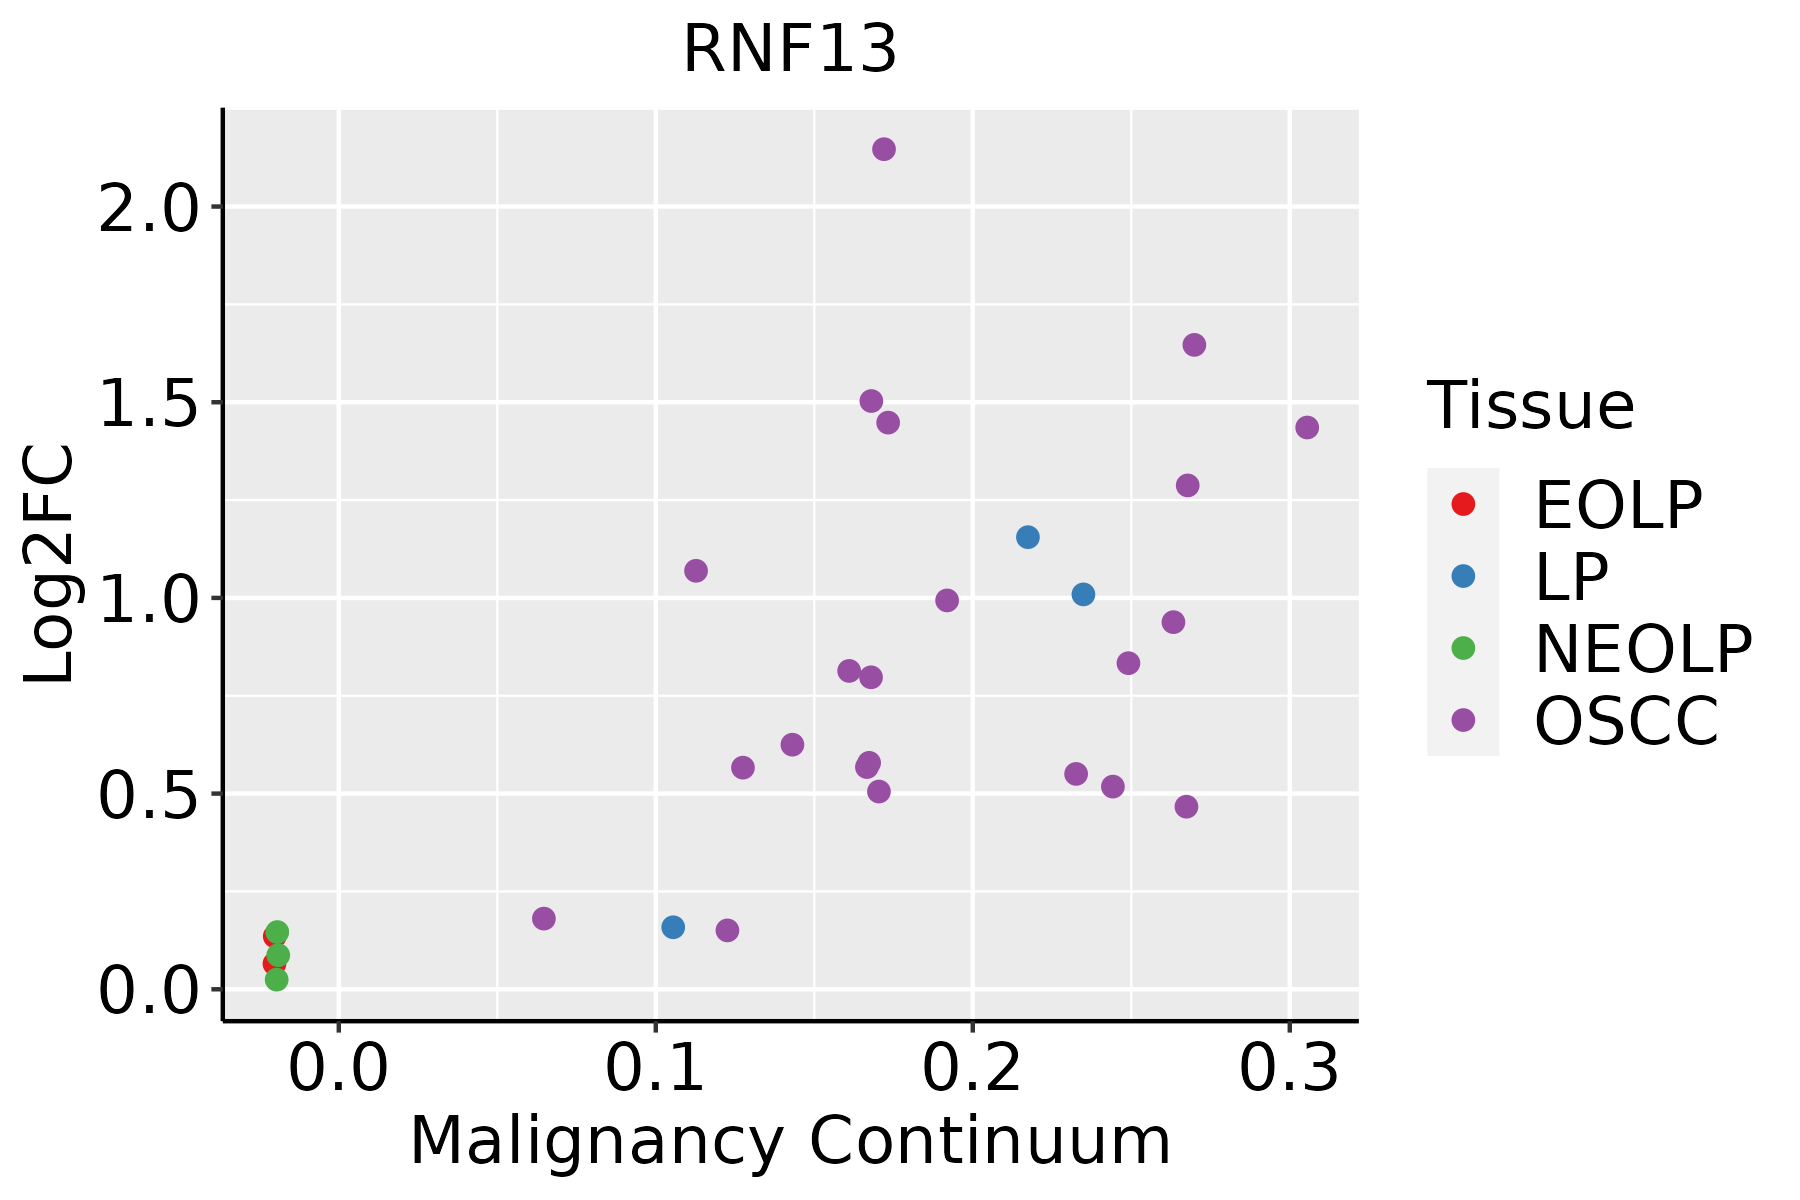 | EOLP: Erosive Oral lichen planus |
| LP: leukoplakia |
| NEOLP: Non-erosive oral lichen planus |
| OSCC: Oral squamous cell carcinoma |
| Skin | 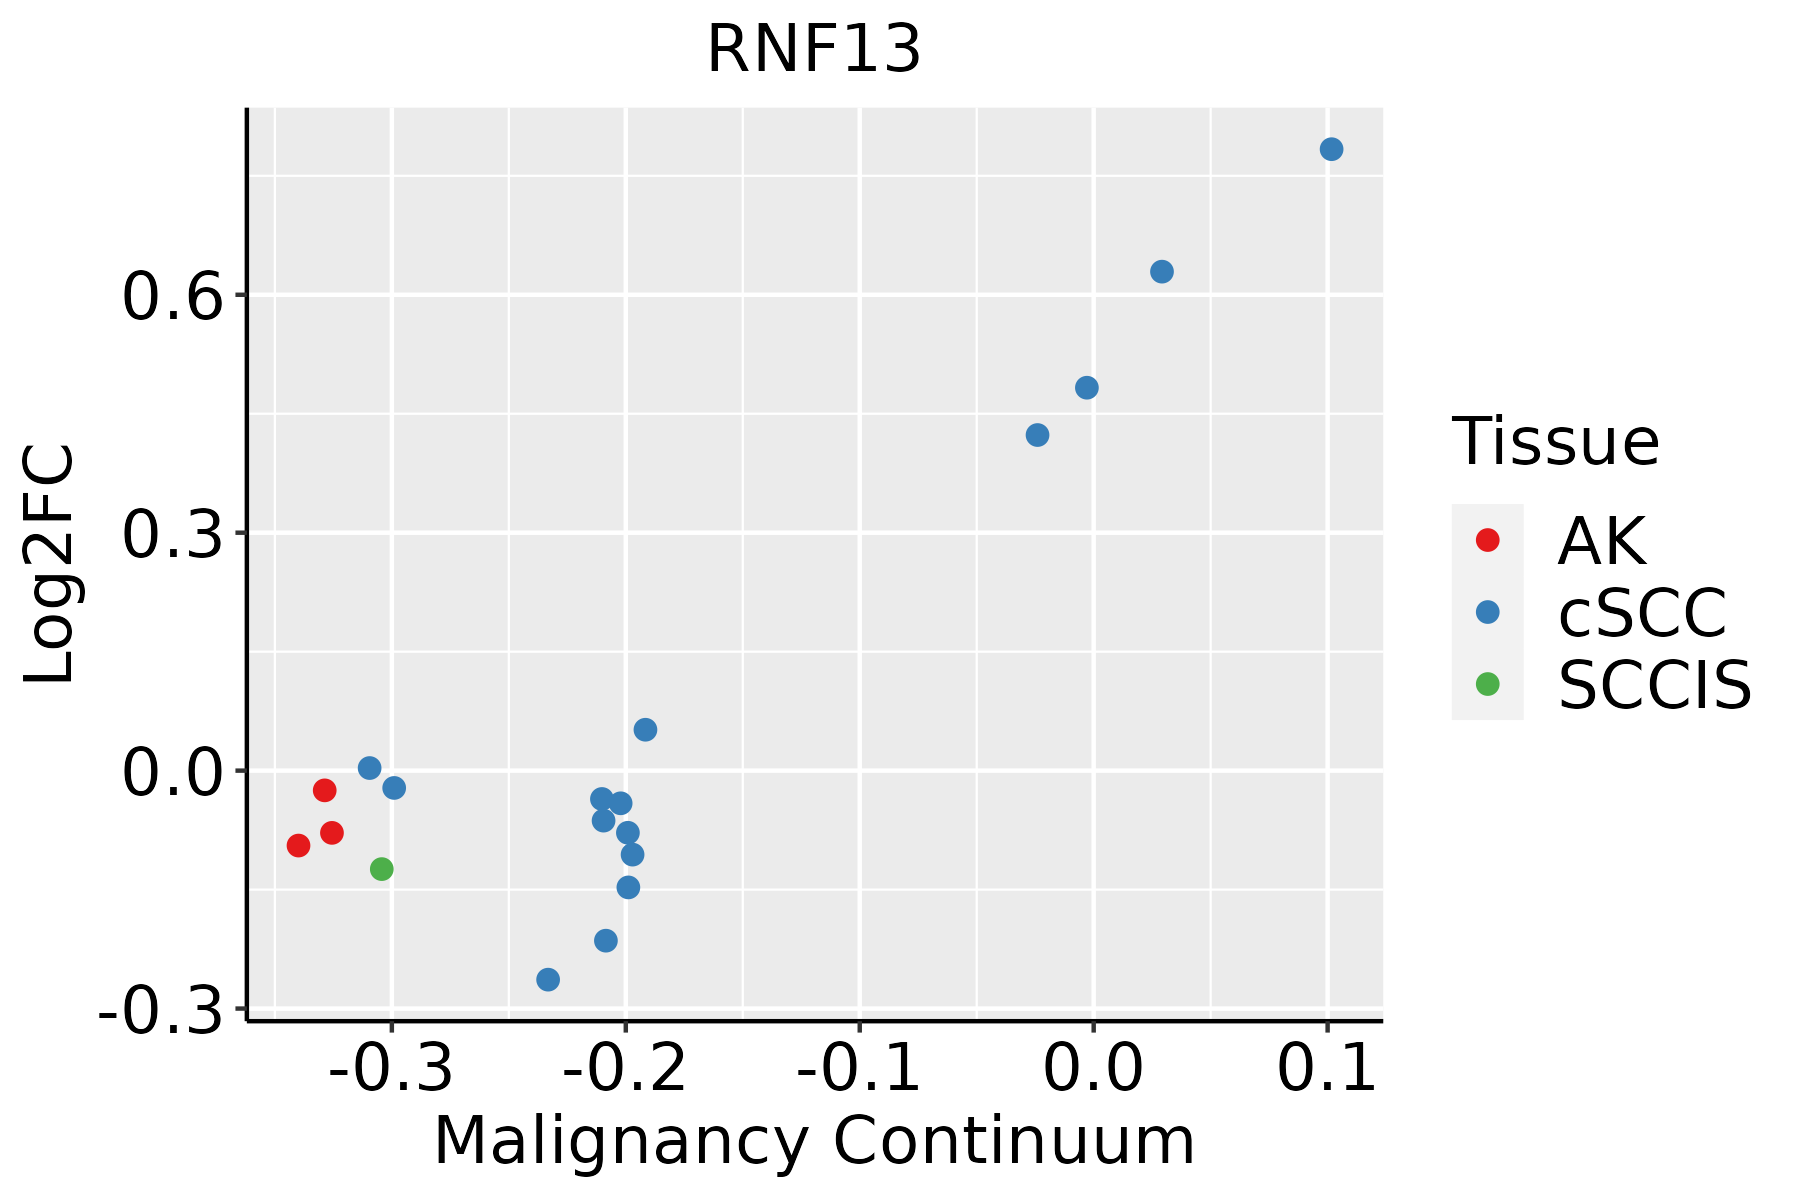 | AK: Actinic keratosis |
| cSCC: Cutaneous squamous cell carcinoma |
| SCCIS:squamous cell carcinoma in situ |
| Thyroid | 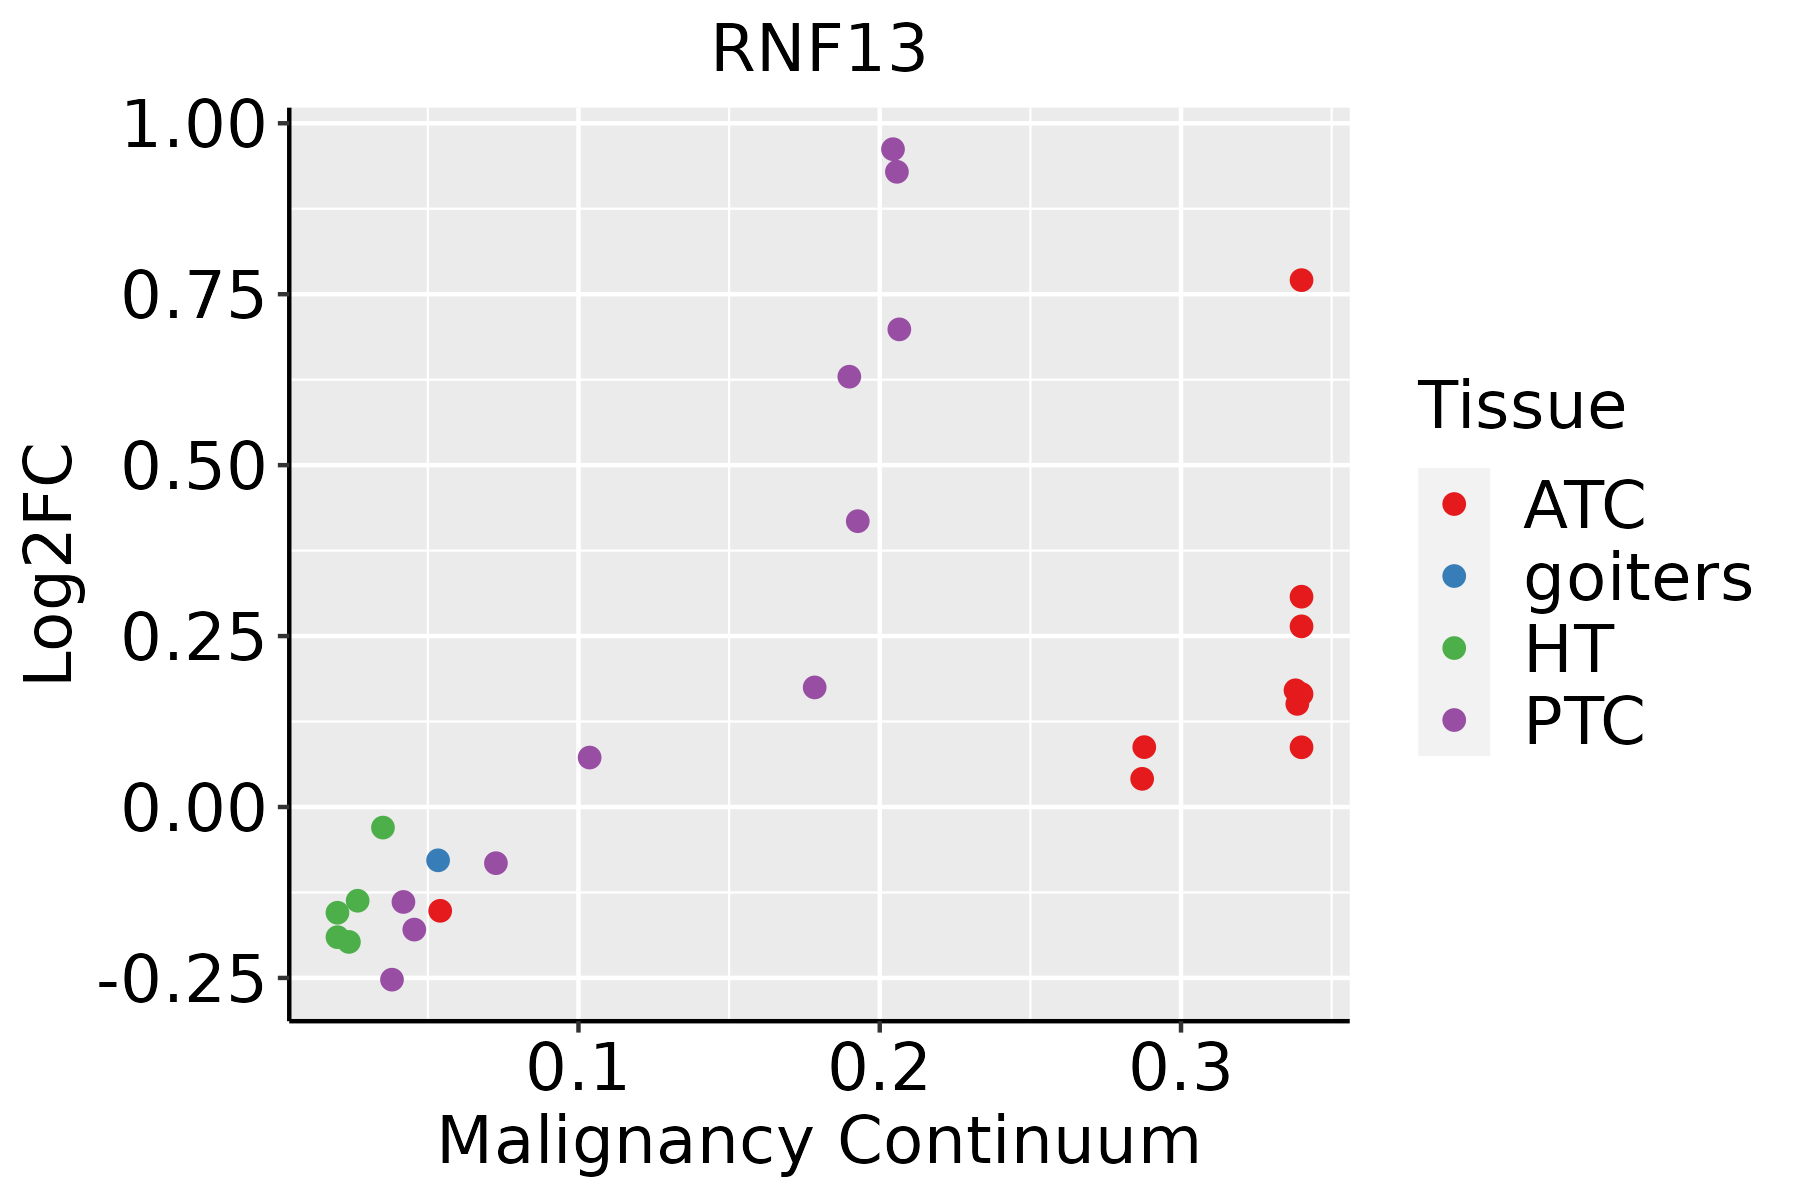 | ATC: Anaplastic thyroid cancer |
| HT: Hashimoto's thyroiditis |
| PTC: Papillary thyroid cancer |
| GO ID | Tissue | Disease Stage | Description | Gene Ratio | Bg Ratio | pvalue | p.adjust | Count |
| GO:00310988 | Cervix | CC | stress-activated protein kinase signaling cascade | 58/2311 | 247/18723 | 8.02e-07 | 2.89e-05 | 58 |
| GO:00703027 | Cervix | CC | regulation of stress-activated protein kinase signaling cascade | 46/2311 | 195/18723 | 9.35e-06 | 2.11e-04 | 46 |
| GO:00703043 | Cervix | CC | positive regulation of stress-activated protein kinase signaling cascade | 27/2311 | 128/18723 | 3.49e-03 | 2.26e-02 | 27 |
| GO:00518656 | Cervix | CC | protein autoubiquitination | 17/2311 | 73/18723 | 6.71e-03 | 3.70e-02 | 17 |
| GO:0031098 | Colorectum | AD | stress-activated protein kinase signaling cascade | 74/3918 | 247/18723 | 4.80e-04 | 5.27e-03 | 74 |
| GO:0051865 | Colorectum | AD | protein autoubiquitination | 28/3918 | 73/18723 | 4.87e-04 | 5.30e-03 | 28 |
| GO:0070302 | Colorectum | AD | regulation of stress-activated protein kinase signaling cascade | 58/3918 | 195/18723 | 2.21e-03 | 1.74e-02 | 58 |
| GO:00310981 | Colorectum | SER | stress-activated protein kinase signaling cascade | 54/2897 | 247/18723 | 4.65e-03 | 3.67e-02 | 54 |
| GO:00310982 | Colorectum | MSS | stress-activated protein kinase signaling cascade | 67/3467 | 247/18723 | 5.28e-04 | 5.99e-03 | 67 |
| GO:00518651 | Colorectum | MSS | protein autoubiquitination | 25/3467 | 73/18723 | 1.00e-03 | 1.00e-02 | 25 |
| GO:00703021 | Colorectum | MSS | regulation of stress-activated protein kinase signaling cascade | 52/3467 | 195/18723 | 3.07e-03 | 2.34e-02 | 52 |
| GO:00310983 | Colorectum | FAP | stress-activated protein kinase signaling cascade | 61/2622 | 247/18723 | 4.79e-06 | 1.57e-04 | 61 |
| GO:00703022 | Colorectum | FAP | regulation of stress-activated protein kinase signaling cascade | 48/2622 | 195/18723 | 5.14e-05 | 1.04e-03 | 48 |
| GO:00518652 | Colorectum | FAP | protein autoubiquitination | 22/2622 | 73/18723 | 2.88e-04 | 3.77e-03 | 22 |
| GO:0070304 | Colorectum | FAP | positive regulation of stress-activated protein kinase signaling cascade | 31/2622 | 128/18723 | 1.35e-03 | 1.24e-02 | 31 |
| GO:00310984 | Colorectum | CRC | stress-activated protein kinase signaling cascade | 51/2078 | 247/18723 | 8.35e-06 | 3.00e-04 | 51 |
| GO:00703023 | Colorectum | CRC | regulation of stress-activated protein kinase signaling cascade | 41/2078 | 195/18723 | 3.99e-05 | 9.63e-04 | 41 |
| GO:00518653 | Colorectum | CRC | protein autoubiquitination | 18/2078 | 73/18723 | 8.33e-04 | 1.04e-02 | 18 |
| GO:00703041 | Colorectum | CRC | positive regulation of stress-activated protein kinase signaling cascade | 25/2078 | 128/18723 | 3.44e-03 | 2.92e-02 | 25 |
| GO:000020916 | Esophagus | HGIN | protein polyubiquitination | 58/2587 | 236/18723 | 6.29e-06 | 1.97e-04 | 58 |
| Hugo Symbol | Variant Class | Variant Classification | dbSNP RS | HGVSc | HGVSp | HGVSp Short | SWISSPROT | BIOTYPE | SIFT | PolyPhen | Tumor Sample Barcode | Tissue | Histology | Sex | Age | Stage | Therapy Types | Drugs | Outcome |
| RNF13 | SNV | Missense_Mutation | | c.32N>T | p.Ser11Leu | p.S11L | O43567 | protein_coding | deleterious_low_confidence(0.03) | benign(0.007) | TCGA-AC-A23H-01 | Breast | breast invasive carcinoma | Female | >=65 | I/II | Unknown | Unknown | PD |
| RNF13 | SNV | Missense_Mutation | novel | c.11C>T | p.Ser4Phe | p.S4F | O43567 | protein_coding | deleterious_low_confidence(0.01) | probably_damaging(0.986) | TCGA-BH-A2L8-01 | Breast | breast invasive carcinoma | Female | <65 | I/II | Chemotherapy | cytoxan | CR |
| RNF13 | SNV | Missense_Mutation | novel | c.755N>G | p.Lys252Arg | p.K252R | O43567 | protein_coding | tolerated(0.13) | benign(0.057) | TCGA-CA-6717-01 | Colorectum | colon adenocarcinoma | Male | <65 | I/II | Chemotherapy | oxaliplatin | CR |
| RNF13 | deletion | Frame_Shift_Del | | c.494delN | p.Gly168AlafsTer5 | p.G168Afs*5 | O43567 | protein_coding | | | TCGA-G4-6304-01 | Colorectum | colon adenocarcinoma | Female | >=65 | I/II | Chemotherapy | fluorouracil | PD |
| RNF13 | SNV | Missense_Mutation | novel | c.226N>A | p.Ala76Thr | p.A76T | O43567 | protein_coding | deleterious(0.03) | possibly_damaging(0.641) | TCGA-A5-A1OF-01 | Endometrium | uterine corpus endometrioid carcinoma | Female | <65 | I/II | Unknown | Unknown | SD |
| RNF13 | SNV | Missense_Mutation | novel | c.661G>T | p.Asp221Tyr | p.D221Y | O43567 | protein_coding | deleterious(0) | possibly_damaging(0.468) | TCGA-AP-A1E0-01 | Endometrium | uterine corpus endometrioid carcinoma | Female | <65 | III/IV | Chemotherapy | paclitaxel | SD |
| RNF13 | SNV | Missense_Mutation | rs751133228 | c.670N>G | p.Lys224Glu | p.K224E | O43567 | protein_coding | deleterious(0.03) | benign(0.212) | TCGA-AP-A3K1-01 | Endometrium | uterine corpus endometrioid carcinoma | Female | <65 | III/IV | Chemotherapy | carboplatin | PD |
| RNF13 | SNV | Missense_Mutation | novel | c.617N>A | p.Phe206Tyr | p.F206Y | O43567 | protein_coding | tolerated(0.62) | benign(0.031) | TCGA-BG-A222-01 | Endometrium | uterine corpus endometrioid carcinoma | Female | <65 | I/II | Unknown | Unknown | SD |
| RNF13 | SNV | Missense_Mutation | novel | c.1103N>G | p.Gln368Arg | p.Q368R | O43567 | protein_coding | deleterious_low_confidence(0) | probably_damaging(0.932) | TCGA-BG-A222-01 | Endometrium | uterine corpus endometrioid carcinoma | Female | <65 | I/II | Unknown | Unknown | SD |
| RNF13 | SNV | Missense_Mutation | | c.977N>C | p.Leu326Ser | p.L326S | O43567 | protein_coding | deleterious(0) | benign(0.05) | TCGA-BS-A0UJ-01 | Endometrium | uterine corpus endometrioid carcinoma | Female | >=65 | I/II | Unknown | Unknown | SD |


