
|
|||||
|
 | |
| |
| |
| |
| |
| |
|
Gene: RNF128 |
Gene summary for RNF128 |
| Gene information | Species | Human | Gene symbol | RNF128 | Gene ID | 79589 |
| Gene name | ring finger protein 128 | |
| Gene Alias | GRAIL | |
| Cytomap | Xq22.3 | |
| Gene Type | protein-coding | GO ID | GO:0001816 | UniProtAcc | Q8TEB7 |
Top |
Malignant transformation analysis |
| Identification of the aberrant gene expression in precancerous and cancerous lesions by comparing the gene expression of stem-like cells in diseased tissues with normal stem cells |
| Entrez ID | Symbol | Replicates | Species | Organ | Tissue | Adj P-value | Log2FC | Malignancy |
| 79589 | RNF128 | LZE24T | Human | Esophagus | ESCC | 4.37e-04 | 1.32e-01 | 0.0596 |
| 79589 | RNF128 | P5T-E | Human | Esophagus | ESCC | 5.12e-12 | 1.66e-01 | 0.1327 |
| 79589 | RNF128 | P17T-E | Human | Esophagus | ESCC | 1.79e-02 | 2.43e-01 | 0.1278 |
| 79589 | RNF128 | P20T-E | Human | Esophagus | ESCC | 1.03e-07 | 1.69e-01 | 0.1124 |
| 79589 | RNF128 | P24T-E | Human | Esophagus | ESCC | 1.10e-02 | 1.27e-01 | 0.1287 |
| 79589 | RNF128 | P26T-E | Human | Esophagus | ESCC | 3.38e-11 | 2.50e-01 | 0.1276 |
| 79589 | RNF128 | P30T-E | Human | Esophagus | ESCC | 1.42e-04 | 2.20e-01 | 0.137 |
| 79589 | RNF128 | P32T-E | Human | Esophagus | ESCC | 1.19e-05 | 2.88e-01 | 0.1666 |
| 79589 | RNF128 | P37T-E | Human | Esophagus | ESCC | 7.93e-21 | 5.08e-01 | 0.1371 |
| 79589 | RNF128 | P39T-E | Human | Esophagus | ESCC | 1.35e-09 | 8.12e-02 | 0.0894 |
| 79589 | RNF128 | P40T-E | Human | Esophagus | ESCC | 4.72e-03 | 1.55e-01 | 0.109 |
| 79589 | RNF128 | P42T-E | Human | Esophagus | ESCC | 2.24e-02 | 1.95e-01 | 0.1175 |
| 79589 | RNF128 | P44T-E | Human | Esophagus | ESCC | 4.53e-08 | 1.78e-01 | 0.1096 |
| 79589 | RNF128 | P47T-E | Human | Esophagus | ESCC | 4.09e-04 | 6.05e-02 | 0.1067 |
| 79589 | RNF128 | P48T-E | Human | Esophagus | ESCC | 9.15e-03 | -2.19e-02 | 0.0959 |
| 79589 | RNF128 | P49T-E | Human | Esophagus | ESCC | 4.80e-08 | 8.74e-01 | 0.1768 |
| 79589 | RNF128 | P54T-E | Human | Esophagus | ESCC | 3.47e-06 | 7.06e-02 | 0.0975 |
| 79589 | RNF128 | P57T-E | Human | Esophagus | ESCC | 1.02e-06 | 1.67e-01 | 0.0926 |
| 79589 | RNF128 | P62T-E | Human | Esophagus | ESCC | 1.59e-30 | 4.65e-01 | 0.1302 |
| 79589 | RNF128 | P74T-E | Human | Esophagus | ESCC | 1.03e-02 | 1.52e-01 | 0.1479 |
| Page: 1 2 |
| Tissue | Expression Dynamics | Abbreviation |
| Esophagus | 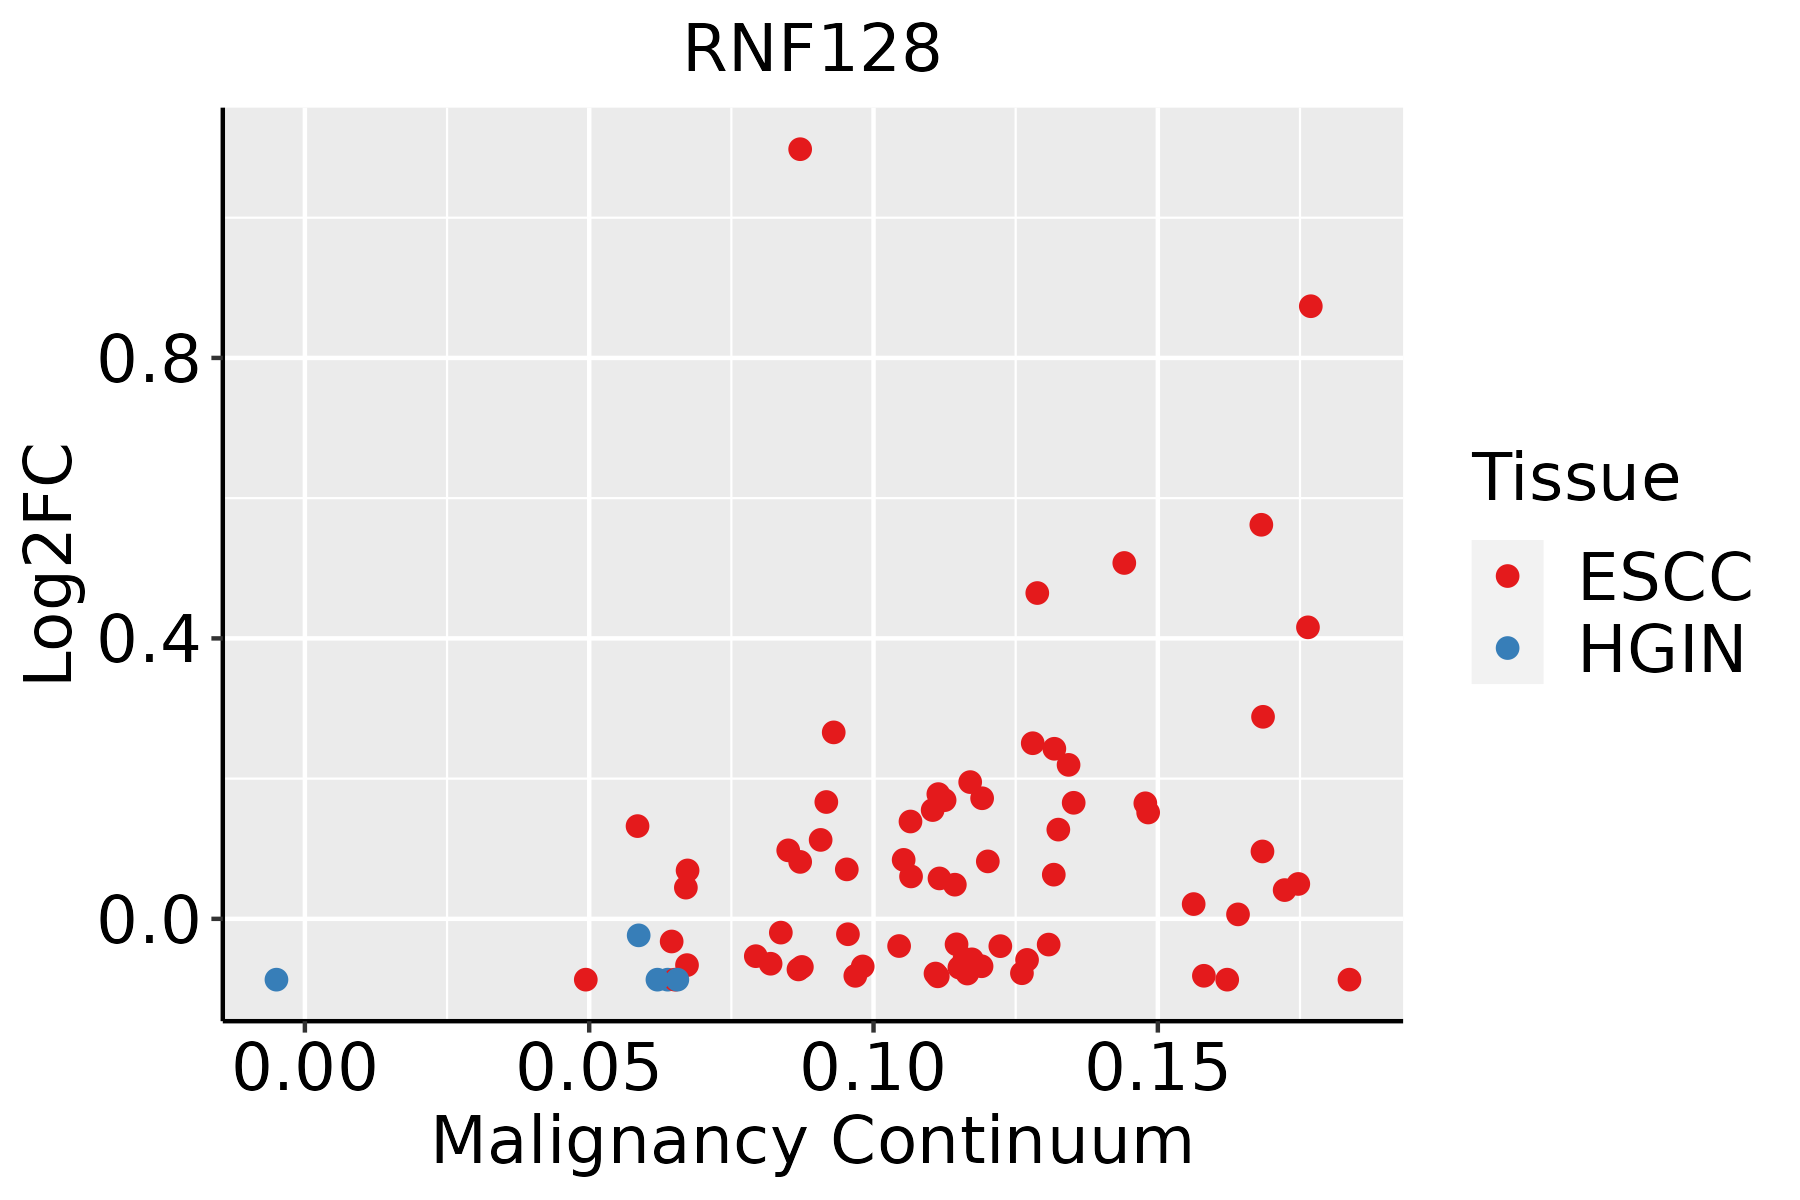 | ESCC: Esophageal squamous cell carcinoma |
| HGIN: High-grade intraepithelial neoplasias | ||
| LGIN: Low-grade intraepithelial neoplasias | ||
| Liver | 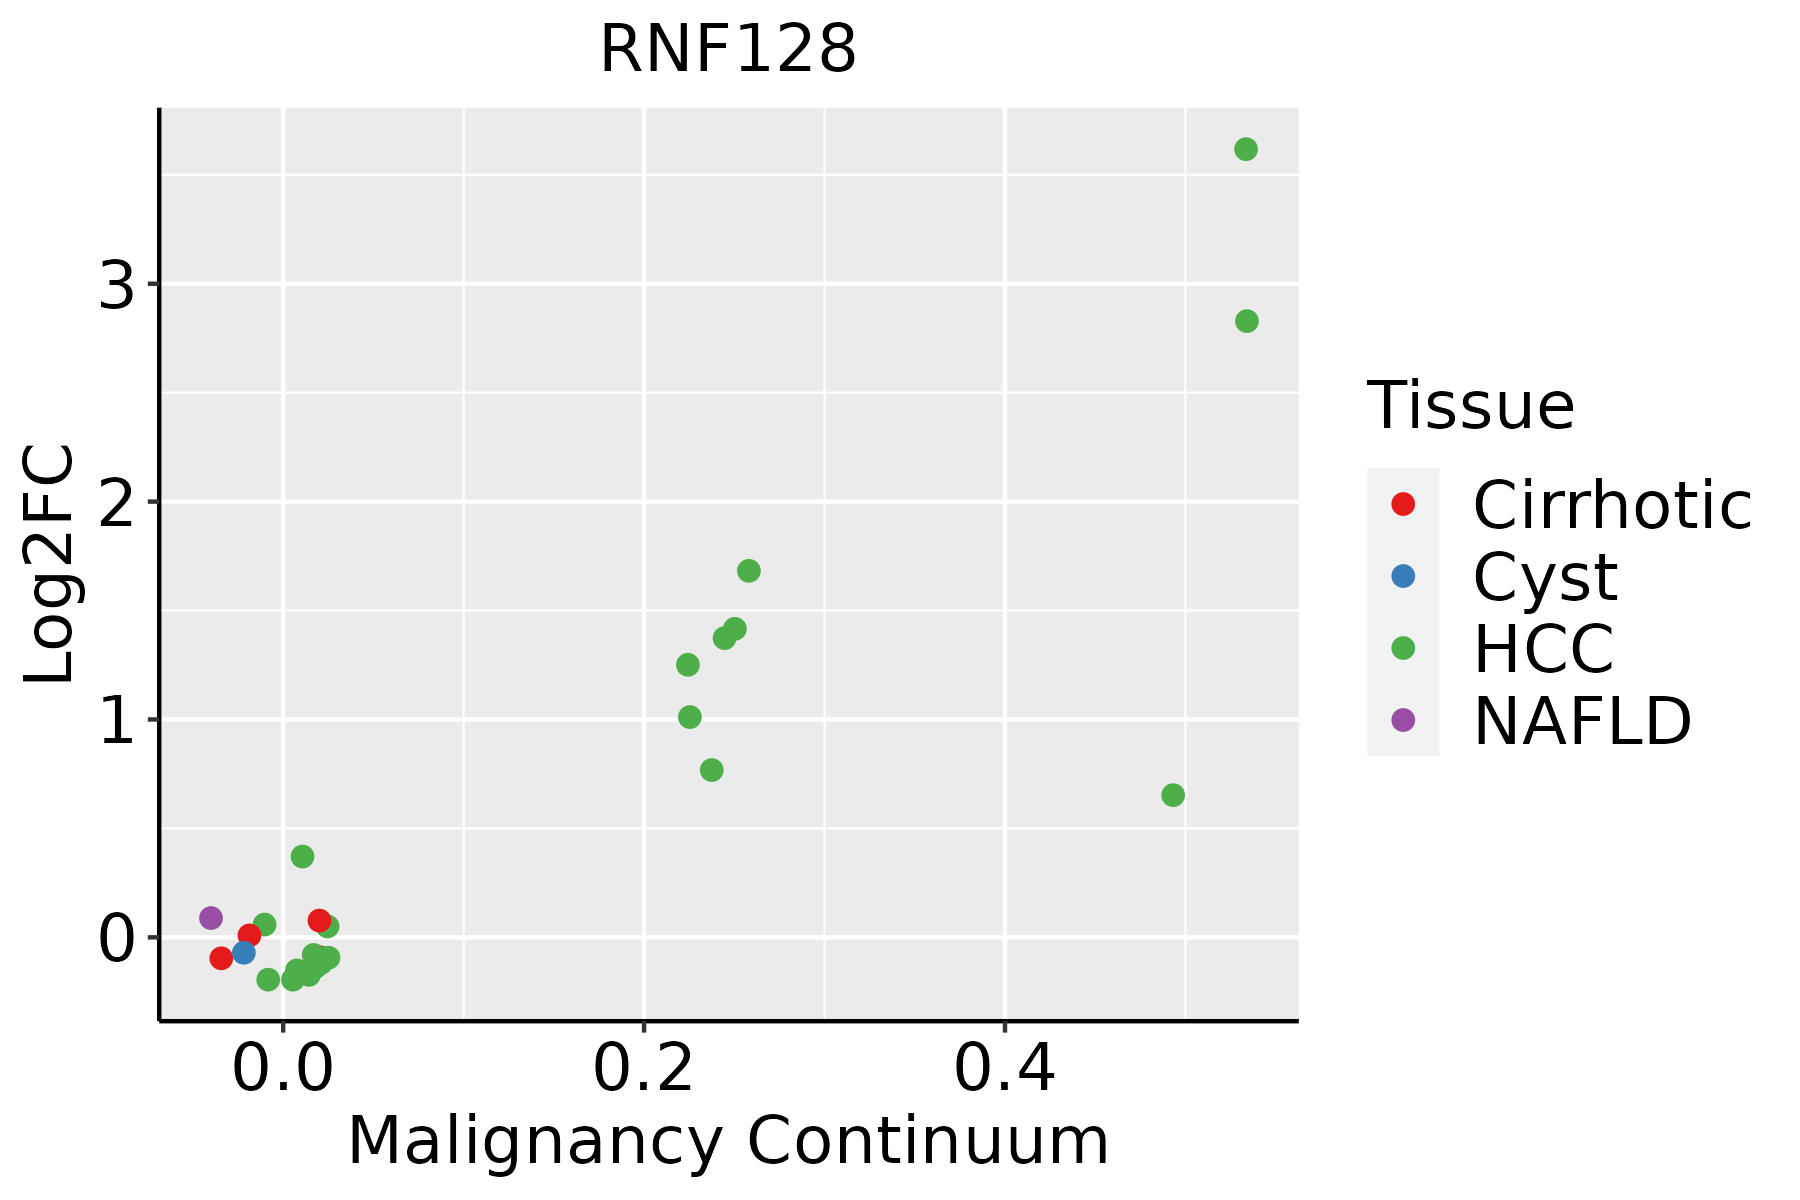 | HCC: Hepatocellular carcinoma |
| NAFLD: Non-alcoholic fatty liver disease |
| ∗log2FC in expression of this searched gene in stem-like cells from each diseased tissue sample relative to stem-like cells in normal samples in each tissue plotted against the malignancy continuum. Samples are colored based on if they are from different disease stage. |
Top |
Malignant transformation related pathway analysis |
| Find out the enriched GO biological processes and KEGG pathways involved in transition from healthy to precancer to cancer |
| Tissue | Disease Stage | Enriched GO biological Processes |
| Colorectum | AD |  |
| Colorectum | SER |  |
| Colorectum | MSS |  |
| Colorectum | MSI-H |  |
| Colorectum | FAP |  |
| ∗Top 15 enriched GO BP terms are showed in the bar plot of each disease state in each tissue. Each row represents a significant GO biological process which is colored according to the -log10(p.adjust). |
| Page: 1 2 3 4 5 6 7 8 9 |
| GO ID | Tissue | Disease Stage | Description | Gene Ratio | Bg Ratio | pvalue | p.adjust | Count |
| GO:0042176111 | Esophagus | ESCC | regulation of protein catabolic process | 280/8552 | 391/18723 | 8.65e-26 | 2.39e-23 | 280 |
| GO:0031647111 | Esophagus | ESCC | regulation of protein stability | 223/8552 | 298/18723 | 5.76e-25 | 1.52e-22 | 223 |
| GO:0009896111 | Esophagus | ESCC | positive regulation of catabolic process | 332/8552 | 492/18723 | 4.36e-23 | 9.22e-21 | 332 |
| GO:0031331111 | Esophagus | ESCC | positive regulation of cellular catabolic process | 292/8552 | 427/18723 | 8.67e-22 | 1.53e-19 | 292 |
| GO:1903362111 | Esophagus | ESCC | regulation of cellular protein catabolic process | 188/8552 | 255/18723 | 5.12e-20 | 6.62e-18 | 188 |
| GO:0045732111 | Esophagus | ESCC | positive regulation of protein catabolic process | 167/8552 | 231/18723 | 1.47e-16 | 1.14e-14 | 167 |
| GO:1903364111 | Esophagus | ESCC | positive regulation of cellular protein catabolic process | 117/8552 | 155/18723 | 3.25e-14 | 1.66e-12 | 117 |
| GO:00726659 | Esophagus | ESCC | protein localization to vacuole | 52/8552 | 67/18723 | 9.14e-08 | 1.52e-06 | 52 |
| GO:00614626 | Esophagus | ESCC | protein localization to lysosome | 34/8552 | 46/18723 | 9.39e-05 | 6.70e-04 | 34 |
| GO:00070393 | Esophagus | ESCC | protein catabolic process in the vacuole | 16/8552 | 19/18723 | 6.45e-04 | 3.43e-03 | 16 |
| GO:004217612 | Liver | Cirrhotic | regulation of protein catabolic process | 181/4634 | 391/18723 | 7.94e-21 | 2.77e-18 | 181 |
| GO:000989612 | Liver | Cirrhotic | positive regulation of catabolic process | 215/4634 | 492/18723 | 1.13e-20 | 3.56e-18 | 215 |
| GO:003133112 | Liver | Cirrhotic | positive regulation of cellular catabolic process | 190/4634 | 427/18723 | 1.94e-19 | 4.18e-17 | 190 |
| GO:003164712 | Liver | Cirrhotic | regulation of protein stability | 144/4634 | 298/18723 | 6.74e-19 | 1.28e-16 | 144 |
| GO:190336212 | Liver | Cirrhotic | regulation of cellular protein catabolic process | 124/4634 | 255/18723 | 9.85e-17 | 1.26e-14 | 124 |
| GO:004573212 | Liver | Cirrhotic | positive regulation of protein catabolic process | 112/4634 | 231/18723 | 3.89e-15 | 4.21e-13 | 112 |
| GO:190336412 | Liver | Cirrhotic | positive regulation of cellular protein catabolic process | 80/4634 | 155/18723 | 5.04e-13 | 3.86e-11 | 80 |
| GO:007266511 | Liver | Cirrhotic | protein localization to vacuole | 37/4634 | 67/18723 | 9.11e-08 | 2.66e-06 | 37 |
| GO:00614622 | Liver | Cirrhotic | protein localization to lysosome | 24/4634 | 46/18723 | 5.75e-05 | 6.58e-04 | 24 |
| GO:0007039 | Liver | Cirrhotic | protein catabolic process in the vacuole | 11/4634 | 19/18723 | 2.09e-03 | 1.29e-02 | 11 |
| Page: 1 2 |
| Pathway ID | Tissue | Disease Stage | Description | Gene Ratio | Bg Ratio | pvalue | p.adjust | qvalue | Count |
| Page: 1 |
Top |
Cell-cell communication analysis |
| Identification of potential cell-cell interactions between two cell types and their ligand-receptor pairs for different disease states |
| Ligand | Receptor | LRpair | Pathway | Tissue | Disease Stage |
| Page: 1 |
Top |
Single-cell gene regulatory network inference analysis |
| Find out the significant the regulons (TFs) and the target genes of each regulon across cell types for different disease states |
| TF | Cell Type | Tissue | Disease Stage | Target Gene | RSS | Regulon Activity |
| ∗The dot plots of a searched regulon are shown for all cell subpopulations in each disease state of each tissue based on the regulon specific score inferred using pySCENIC and by calculating the average expression. |
| Page: 1 |
Top |
Somatic mutation of malignant transformation related genes |
| Annotation of somatic variants for genes involved in malignant transformation |
| Hugo Symbol | Variant Class | Variant Classification | dbSNP RS | HGVSc | HGVSp | HGVSp Short | SWISSPROT | BIOTYPE | SIFT | PolyPhen | Tumor Sample Barcode | Tissue | Histology | Sex | Age | Stage | Therapy Types | Drugs | Outcome |
| RNF128 | SNV | Missense_Mutation | rs764287121 | c.16N>G | p.Arg6Gly | p.R6G | Q8TEB7 | protein_coding | tolerated(0.06) | benign(0.003) | TCGA-A8-A099-01 | Breast | breast invasive carcinoma | Female | >=65 | III/IV | Hormone Therapy | exemestane | SD |
| RNF128 | SNV | Missense_Mutation | c.454C>T | p.Arg152Cys | p.R152C | Q8TEB7 | protein_coding | deleterious(0) | possibly_damaging(0.847) | TCGA-D8-A1XQ-01 | Breast | breast invasive carcinoma | Female | >=65 | I/II | Unknown | Unknown | SD | |
| RNF128 | SNV | Missense_Mutation | c.290N>A | p.Arg97Lys | p.R97K | Q8TEB7 | protein_coding | deleterious(0.03) | probably_damaging(0.933) | TCGA-EW-A1PB-01 | Breast | breast invasive carcinoma | Female | >=65 | III/IV | Unknown | Unknown | SD | |
| RNF128 | SNV | Missense_Mutation | c.103G>A | p.Gly35Ser | p.G35S | Q8TEB7 | protein_coding | tolerated(0.88) | benign(0.003) | TCGA-EW-A1PC-01 | Breast | breast invasive carcinoma | Female | >=65 | I/II | Hormone Therapy | tamoxiphen | SD | |
| RNF128 | insertion | Nonsense_Mutation | novel | c.699_700insTTATAAAT | p.Arg235Ter | p.R235* | Q8TEB7 | protein_coding | TCGA-B6-A0I6-01 | Breast | breast invasive carcinoma | Female | <65 | I/II | Unknown | Unknown | PD | ||
| RNF128 | insertion | In_Frame_Ins | novel | c.700_701insTGGGTGCTCCTGTATTGGGTGCATATATATTTAGGA | p.Leu234_Arg235insGlyAlaProValLeuGlyAlaTyrIlePheArgIle | p.L234_R235insGAPVLGAYIFRI | Q8TEB7 | protein_coding | TCGA-B6-A0I6-01 | Breast | breast invasive carcinoma | Female | <65 | I/II | Unknown | Unknown | PD | ||
| RNF128 | SNV | Missense_Mutation | c.431T>C | p.Val144Ala | p.V144A | Q8TEB7 | protein_coding | deleterious(0) | probably_damaging(0.993) | TCGA-EA-A410-01 | Cervix | cervical & endocervical cancer | Female | <65 | I/II | Unknown | Unknown | SD | |
| RNF128 | SNV | Missense_Mutation | rs146627932 | c.157N>A | p.Val53Ile | p.V53I | Q8TEB7 | protein_coding | tolerated(0.12) | benign(0.061) | TCGA-FU-A3EO-01 | Cervix | cervical & endocervical cancer | Female | <65 | I/II | Unknown | Unknown | SD |
| RNF128 | SNV | Missense_Mutation | novel | c.1190C>A | p.Ser397Tyr | p.S397Y | Q8TEB7 | protein_coding | tolerated(0.34) | possibly_damaging(0.598) | TCGA-AZ-4315-01 | Colorectum | colon adenocarcinoma | Male | <65 | I/II | Unknown | Unknown | SD |
| RNF128 | SNV | Missense_Mutation | rs750124343 | c.781N>T | p.Arg261Cys | p.R261C | Q8TEB7 | protein_coding | deleterious(0) | probably_damaging(0.921) | TCGA-DM-A0X9-01 | Colorectum | colon adenocarcinoma | Female | >=65 | I/II | Unknown | Unknown | SD |
| Page: 1 2 3 4 5 6 7 8 |
Top |
Related drugs of malignant transformation related genes |
| Identification of chemicals and drugs interact with genes involved in malignant transfromation |
| (DGIdb 4.0) |
| Entrez ID | Symbol | Category | Interaction Types | Drug Claim Name | Drug Name | PMIDs |
| Page: 1 |

Copyright 2023-Present -The University of Texas Health Science Center at Houston |