
|
|||||
|
 | |
| |
| |
| |
| |
| |
|
Gene: RNF121 |
Gene summary for RNF121 |
| Gene information | Species | Human | Gene symbol | RNF121 | Gene ID | 55298 |
| Gene name | ring finger protein 121 | |
| Gene Alias | RNF121 | |
| Cytomap | 11q13.4 | |
| Gene Type | protein-coding | GO ID | GO:0006464 | UniProtAcc | C9JQY5 |
Top |
Malignant transformation analysis |
| Identification of the aberrant gene expression in precancerous and cancerous lesions by comparing the gene expression of stem-like cells in diseased tissues with normal stem cells |
| Entrez ID | Symbol | Replicates | Species | Organ | Tissue | Adj P-value | Log2FC | Malignancy |
| 55298 | RNF121 | LZE4T | Human | Esophagus | ESCC | 1.33e-18 | 5.66e-01 | 0.0811 |
| 55298 | RNF121 | LZE5T | Human | Esophagus | ESCC | 4.02e-02 | 1.88e-01 | 0.0514 |
| 55298 | RNF121 | LZE20T | Human | Esophagus | ESCC | 5.52e-06 | 1.52e-01 | 0.0662 |
| 55298 | RNF121 | LZE22T | Human | Esophagus | ESCC | 9.57e-09 | 6.18e-01 | 0.068 |
| 55298 | RNF121 | LZE24T | Human | Esophagus | ESCC | 6.97e-14 | 3.45e-01 | 0.0596 |
| 55298 | RNF121 | P1T-E | Human | Esophagus | ESCC | 2.67e-03 | 2.43e-01 | 0.0875 |
| 55298 | RNF121 | P2T-E | Human | Esophagus | ESCC | 2.99e-55 | 9.12e-01 | 0.1177 |
| 55298 | RNF121 | P4T-E | Human | Esophagus | ESCC | 4.00e-21 | 4.89e-01 | 0.1323 |
| 55298 | RNF121 | P5T-E | Human | Esophagus | ESCC | 3.25e-04 | 1.09e-01 | 0.1327 |
| 55298 | RNF121 | P8T-E | Human | Esophagus | ESCC | 9.97e-13 | 1.96e-01 | 0.0889 |
| 55298 | RNF121 | P9T-E | Human | Esophagus | ESCC | 2.06e-09 | 1.61e-01 | 0.1131 |
| 55298 | RNF121 | P10T-E | Human | Esophagus | ESCC | 4.19e-15 | 2.46e-01 | 0.116 |
| 55298 | RNF121 | P11T-E | Human | Esophagus | ESCC | 1.36e-09 | 4.19e-01 | 0.1426 |
| 55298 | RNF121 | P12T-E | Human | Esophagus | ESCC | 1.33e-19 | 3.53e-01 | 0.1122 |
| 55298 | RNF121 | P15T-E | Human | Esophagus | ESCC | 2.74e-08 | 1.69e-01 | 0.1149 |
| 55298 | RNF121 | P16T-E | Human | Esophagus | ESCC | 8.97e-19 | 3.24e-01 | 0.1153 |
| 55298 | RNF121 | P17T-E | Human | Esophagus | ESCC | 1.59e-08 | 3.24e-01 | 0.1278 |
| 55298 | RNF121 | P20T-E | Human | Esophagus | ESCC | 5.43e-35 | 6.76e-01 | 0.1124 |
| 55298 | RNF121 | P21T-E | Human | Esophagus | ESCC | 4.48e-20 | 3.39e-01 | 0.1617 |
| 55298 | RNF121 | P22T-E | Human | Esophagus | ESCC | 1.89e-09 | 2.30e-01 | 0.1236 |
| Page: 1 2 3 4 |
| Tissue | Expression Dynamics | Abbreviation |
| Esophagus | 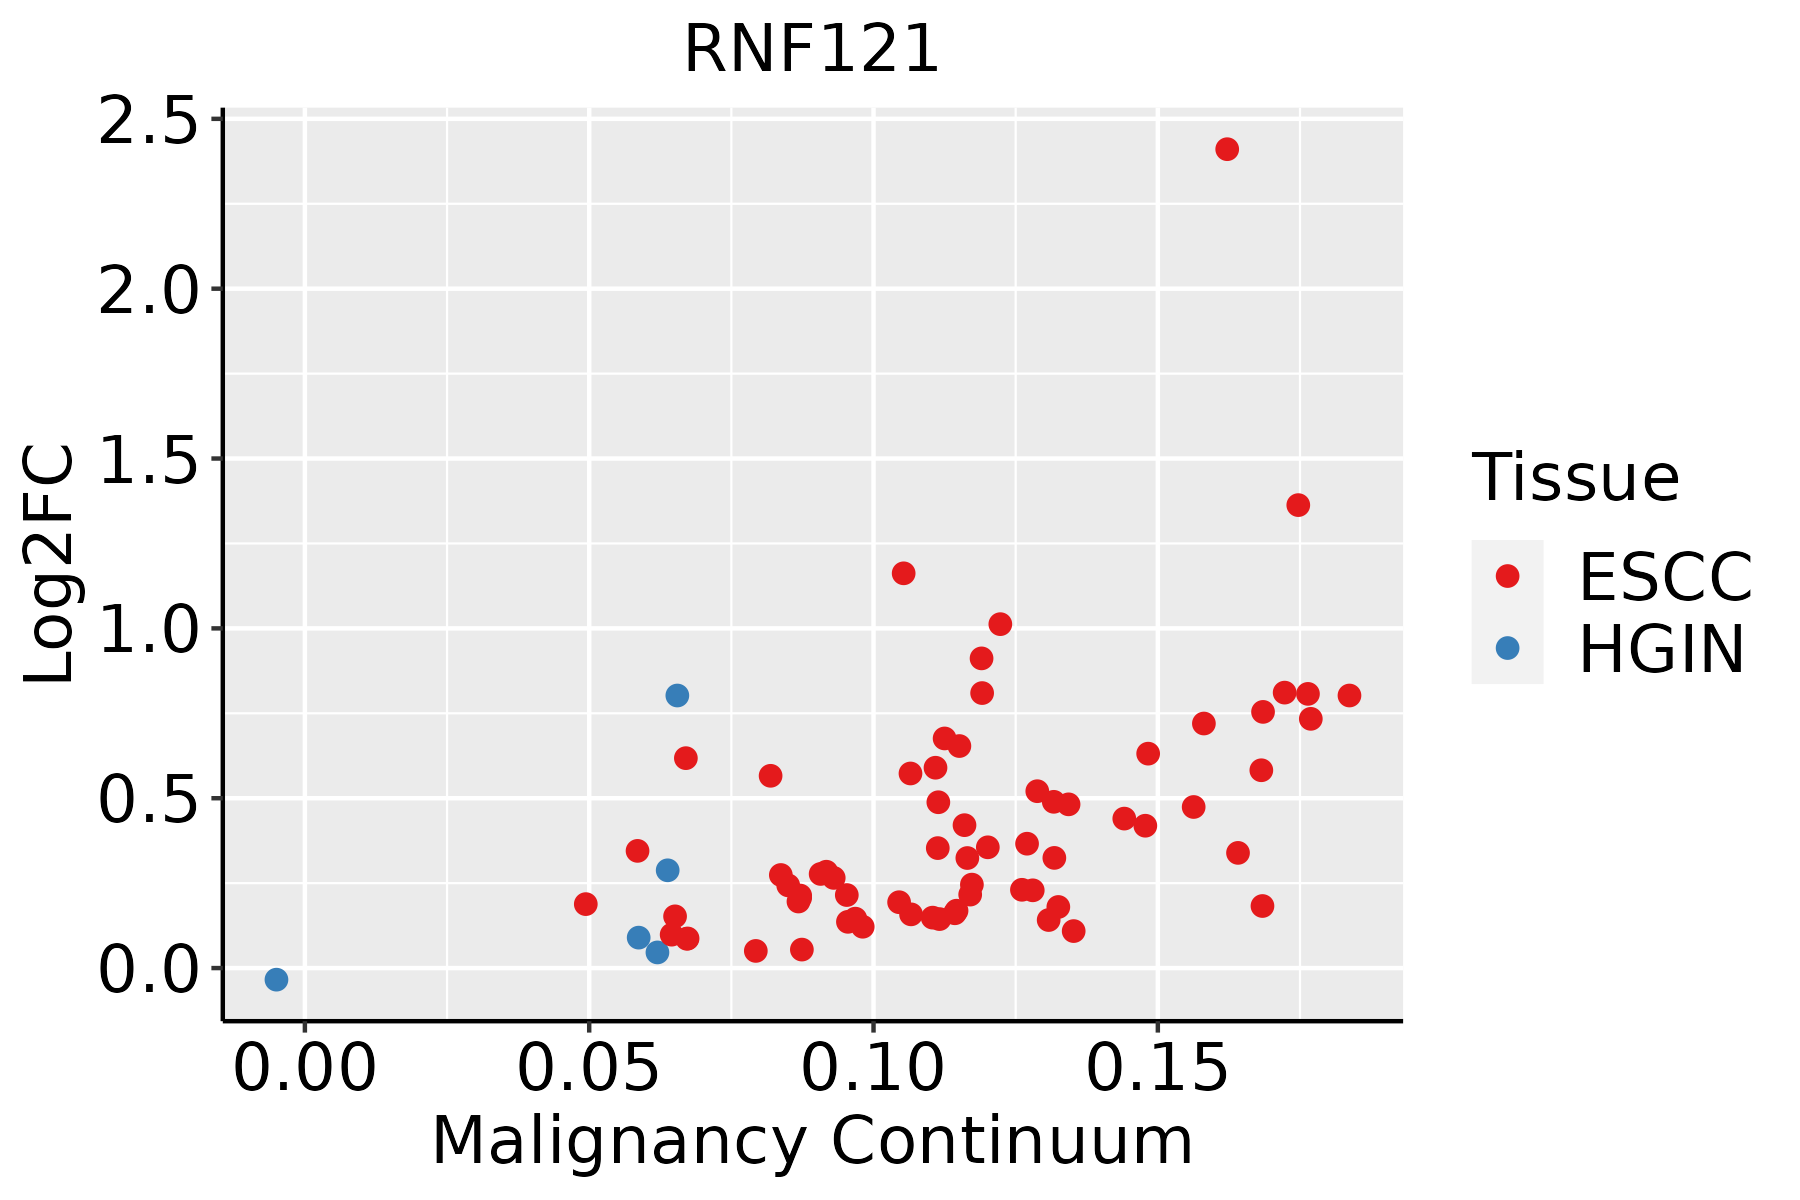 | ESCC: Esophageal squamous cell carcinoma |
| HGIN: High-grade intraepithelial neoplasias | ||
| LGIN: Low-grade intraepithelial neoplasias | ||
| Oral Cavity |  | EOLP: Erosive Oral lichen planus |
| LP: leukoplakia | ||
| NEOLP: Non-erosive oral lichen planus | ||
| OSCC: Oral squamous cell carcinoma |
| ∗log2FC in expression of this searched gene in stem-like cells from each diseased tissue sample relative to stem-like cells in normal samples in each tissue plotted against the malignancy continuum. Samples are colored based on if they are from different disease stage. |
Top |
Malignant transformation related pathway analysis |
| Find out the enriched GO biological processes and KEGG pathways involved in transition from healthy to precancer to cancer |
| Tissue | Disease Stage | Enriched GO biological Processes |
| Colorectum | AD |  |
| Colorectum | SER |  |
| Colorectum | MSS |  |
| Colorectum | MSI-H |  |
| Colorectum | FAP |  |
| ∗Top 15 enriched GO BP terms are showed in the bar plot of each disease state in each tissue. Each row represents a significant GO biological process which is colored according to the -log10(p.adjust). |
| Page: 1 2 3 4 5 6 7 8 9 |
| GO ID | Tissue | Disease Stage | Description | Gene Ratio | Bg Ratio | pvalue | p.adjust | Count |
| GO:0010498111 | Esophagus | ESCC | proteasomal protein catabolic process | 369/8552 | 490/18723 | 1.13e-41 | 1.80e-38 | 369 |
| GO:0043161111 | Esophagus | ESCC | proteasome-mediated ubiquitin-dependent protein catabolic process | 312/8552 | 412/18723 | 3.53e-36 | 4.48e-33 | 312 |
| GO:0034976111 | Esophagus | ESCC | response to endoplasmic reticulum stress | 192/8552 | 256/18723 | 7.15e-22 | 1.30e-19 | 192 |
| GO:003650315 | Esophagus | ESCC | ERAD pathway | 82/8552 | 107/18723 | 5.80e-11 | 1.84e-09 | 82 |
| GO:003043314 | Esophagus | ESCC | ubiquitin-dependent ERAD pathway | 66/8552 | 85/18723 | 1.64e-09 | 3.78e-08 | 66 |
| GO:001049820 | Oral cavity | OSCC | proteasomal protein catabolic process | 336/7305 | 490/18723 | 5.45e-41 | 8.63e-38 | 336 |
| GO:004316120 | Oral cavity | OSCC | proteasome-mediated ubiquitin-dependent protein catabolic process | 285/7305 | 412/18723 | 5.68e-36 | 5.99e-33 | 285 |
| GO:003497620 | Oral cavity | OSCC | response to endoplasmic reticulum stress | 178/7305 | 256/18723 | 2.59e-23 | 6.06e-21 | 178 |
| GO:00304334 | Oral cavity | OSCC | ubiquitin-dependent ERAD pathway | 65/7305 | 85/18723 | 2.12e-12 | 8.99e-11 | 65 |
| GO:00365035 | Oral cavity | OSCC | ERAD pathway | 76/7305 | 107/18723 | 1.76e-11 | 6.11e-10 | 76 |
| GO:0010498110 | Oral cavity | LP | proteasomal protein catabolic process | 224/4623 | 490/18723 | 9.57e-25 | 4.00e-22 | 224 |
| GO:0043161110 | Oral cavity | LP | proteasome-mediated ubiquitin-dependent protein catabolic process | 190/4623 | 412/18723 | 1.08e-21 | 2.93e-19 | 190 |
| GO:0034976110 | Oral cavity | LP | response to endoplasmic reticulum stress | 133/4623 | 256/18723 | 3.84e-21 | 9.24e-19 | 133 |
| GO:003043313 | Oral cavity | LP | ubiquitin-dependent ERAD pathway | 50/4623 | 85/18723 | 2.12e-11 | 1.48e-09 | 50 |
| GO:003650314 | Oral cavity | LP | ERAD pathway | 57/4623 | 107/18723 | 1.99e-10 | 1.08e-08 | 57 |
| Page: 1 |
| Pathway ID | Tissue | Disease Stage | Description | Gene Ratio | Bg Ratio | pvalue | p.adjust | qvalue | Count |
| Page: 1 |
Top |
Cell-cell communication analysis |
| Identification of potential cell-cell interactions between two cell types and their ligand-receptor pairs for different disease states |
| Ligand | Receptor | LRpair | Pathway | Tissue | Disease Stage |
| Page: 1 |
Top |
Single-cell gene regulatory network inference analysis |
| Find out the significant the regulons (TFs) and the target genes of each regulon across cell types for different disease states |
| TF | Cell Type | Tissue | Disease Stage | Target Gene | RSS | Regulon Activity |
| ∗The dot plots of a searched regulon are shown for all cell subpopulations in each disease state of each tissue based on the regulon specific score inferred using pySCENIC and by calculating the average expression. |
| Page: 1 |
Top |
Somatic mutation of malignant transformation related genes |
| Annotation of somatic variants for genes involved in malignant transformation |
| Hugo Symbol | Variant Class | Variant Classification | dbSNP RS | HGVSc | HGVSp | HGVSp Short | SWISSPROT | BIOTYPE | SIFT | PolyPhen | Tumor Sample Barcode | Tissue | Histology | Sex | Age | Stage | Therapy Types | Drugs | Outcome |
| RNF121 | SNV | Missense_Mutation | c.804G>C | p.Lys268Asn | p.K268N | Q9H920 | protein_coding | deleterious(0) | probably_damaging(0.999) | TCGA-A2-A0SY-01 | Breast | breast invasive carcinoma | Female | <65 | III/IV | Hormone Therapy | arimidex | SD | |
| RNF121 | SNV | Missense_Mutation | novel | c.863N>T | p.Pro288Leu | p.P288L | Q9H920 | protein_coding | deleterious(0.03) | possibly_damaging(0.794) | TCGA-2W-A8YY-01 | Cervix | cervical & endocervical cancer | Female | <65 | I/II | Chemotherapy | cisplatin | CR |
| RNF121 | SNV | Missense_Mutation | rs757824081 | c.730G>C | p.Glu244Gln | p.E244Q | Q9H920 | protein_coding | deleterious(0.02) | probably_damaging(0.999) | TCGA-UC-A7PF-01 | Cervix | cervical & endocervical cancer | Female | <65 | I/II | Unknown | Unknown | SD |
| RNF121 | insertion | Frame_Shift_Ins | novel | c.679_680insTGTGTGTGTGT | p.Ala227ValfsTer57 | p.A227Vfs*57 | Q9H920 | protein_coding | TCGA-DS-A1OB-01 | Cervix | cervical & endocervical cancer | Female | <65 | I/II | Chemotherapy | carboplatin | PD | ||
| RNF121 | SNV | Missense_Mutation | c.133C>T | p.Arg45Cys | p.R45C | Q9H920 | protein_coding | deleterious(0) | possibly_damaging(0.739) | TCGA-AA-3833-01 | Colorectum | colon adenocarcinoma | Female | <65 | I/II | Unknown | Unknown | SD | |
| RNF121 | SNV | Missense_Mutation | novel | c.350N>C | p.Phe117Ser | p.F117S | Q9H920 | protein_coding | tolerated(0.15) | benign(0.203) | TCGA-CA-6717-01 | Colorectum | colon adenocarcinoma | Male | <65 | I/II | Chemotherapy | oxaliplatin | CR |
| RNF121 | SNV | Missense_Mutation | c.133C>A | p.Arg45Ser | p.R45S | Q9H920 | protein_coding | deleterious(0.04) | benign(0.211) | TCGA-CM-5861-01 | Colorectum | colon adenocarcinoma | Female | <65 | I/II | Unknown | Unknown | PD | |
| RNF121 | SNV | Missense_Mutation | rs774437950 | c.641N>T | p.Ser214Leu | p.S214L | Q9H920 | protein_coding | deleterious(0.02) | benign(0.129) | TCGA-A5-A0GP-01 | Endometrium | uterine corpus endometrioid carcinoma | Female | <65 | I/II | Unknown | Unknown | SD |
| RNF121 | SNV | Missense_Mutation | rs535881615 | c.112N>A | p.Ala38Thr | p.A38T | Q9H920 | protein_coding | tolerated(0.49) | benign(0.158) | TCGA-AP-A059-01 | Endometrium | uterine corpus endometrioid carcinoma | Female | >=65 | I/II | Unknown | Unknown | SD |
| RNF121 | SNV | Missense_Mutation | rs868704947 | c.467N>T | p.Ala156Val | p.A156V | Q9H920 | protein_coding | tolerated(0.99) | benign(0.001) | TCGA-AX-A2HJ-01 | Endometrium | uterine corpus endometrioid carcinoma | Female | <65 | I/II | Unknown | Unknown | SD |
| Page: 1 2 3 |
Top |
Related drugs of malignant transformation related genes |
| Identification of chemicals and drugs interact with genes involved in malignant transfromation |
| (DGIdb 4.0) |
| Entrez ID | Symbol | Category | Interaction Types | Drug Claim Name | Drug Name | PMIDs |
| Page: 1 |

Copyright 2023-Present -The University of Texas Health Science Center at Houston |