
|
|||||
|
 | |
| |
| |
| |
| |
| |
|
Gene: RNF115 |
Gene summary for RNF115 |
| Gene information | Species | Human | Gene symbol | RNF115 | Gene ID | 27246 |
| Gene name | ring finger protein 115 | |
| Gene Alias | BCA2 | |
| Cytomap | 1q21.1 | |
| Gene Type | protein-coding | GO ID | GO:0000209 | UniProtAcc | Q9Y4L5 |
Top |
Malignant transformation analysis |
| Identification of the aberrant gene expression in precancerous and cancerous lesions by comparing the gene expression of stem-like cells in diseased tissues with normal stem cells |
| Entrez ID | Symbol | Replicates | Species | Organ | Tissue | Adj P-value | Log2FC | Malignancy |
| 27246 | RNF115 | CCI_2 | Human | Cervix | CC | 1.52e-03 | 5.63e-01 | 0.5249 |
| 27246 | RNF115 | CCI_3 | Human | Cervix | CC | 7.65e-09 | 7.06e-01 | 0.516 |
| 27246 | RNF115 | LZE2T | Human | Esophagus | ESCC | 9.95e-07 | 6.22e-01 | 0.082 |
| 27246 | RNF115 | LZE4T | Human | Esophagus | ESCC | 2.78e-10 | 2.63e-01 | 0.0811 |
| 27246 | RNF115 | LZE5T | Human | Esophagus | ESCC | 4.96e-05 | 2.90e-01 | 0.0514 |
| 27246 | RNF115 | LZE7T | Human | Esophagus | ESCC | 1.64e-03 | 2.11e-01 | 0.0667 |
| 27246 | RNF115 | LZE20T | Human | Esophagus | ESCC | 2.07e-06 | 1.99e-01 | 0.0662 |
| 27246 | RNF115 | LZE22D1 | Human | Esophagus | HGIN | 3.83e-06 | 2.71e-01 | 0.0595 |
| 27246 | RNF115 | LZE22T | Human | Esophagus | ESCC | 6.11e-12 | 6.01e-01 | 0.068 |
| 27246 | RNF115 | LZE24T | Human | Esophagus | ESCC | 5.67e-43 | 9.93e-01 | 0.0596 |
| 27246 | RNF115 | LZE21T | Human | Esophagus | ESCC | 1.24e-06 | 3.56e-01 | 0.0655 |
| 27246 | RNF115 | P1T-E | Human | Esophagus | ESCC | 2.47e-17 | 5.69e-01 | 0.0875 |
| 27246 | RNF115 | P2T-E | Human | Esophagus | ESCC | 1.31e-52 | 9.20e-01 | 0.1177 |
| 27246 | RNF115 | P4T-E | Human | Esophagus | ESCC | 8.20e-29 | 5.32e-01 | 0.1323 |
| 27246 | RNF115 | P5T-E | Human | Esophagus | ESCC | 9.56e-34 | 6.17e-01 | 0.1327 |
| 27246 | RNF115 | P8T-E | Human | Esophagus | ESCC | 9.64e-34 | 5.79e-01 | 0.0889 |
| 27246 | RNF115 | P9T-E | Human | Esophagus | ESCC | 9.85e-40 | 7.61e-01 | 0.1131 |
| 27246 | RNF115 | P10T-E | Human | Esophagus | ESCC | 2.72e-36 | 6.12e-01 | 0.116 |
| 27246 | RNF115 | P11T-E | Human | Esophagus | ESCC | 1.93e-29 | 7.73e-01 | 0.1426 |
| 27246 | RNF115 | P12T-E | Human | Esophagus | ESCC | 7.46e-28 | 4.80e-01 | 0.1122 |
| Page: 1 2 3 4 5 6 7 8 |
| Tissue | Expression Dynamics | Abbreviation |
| Cervix | 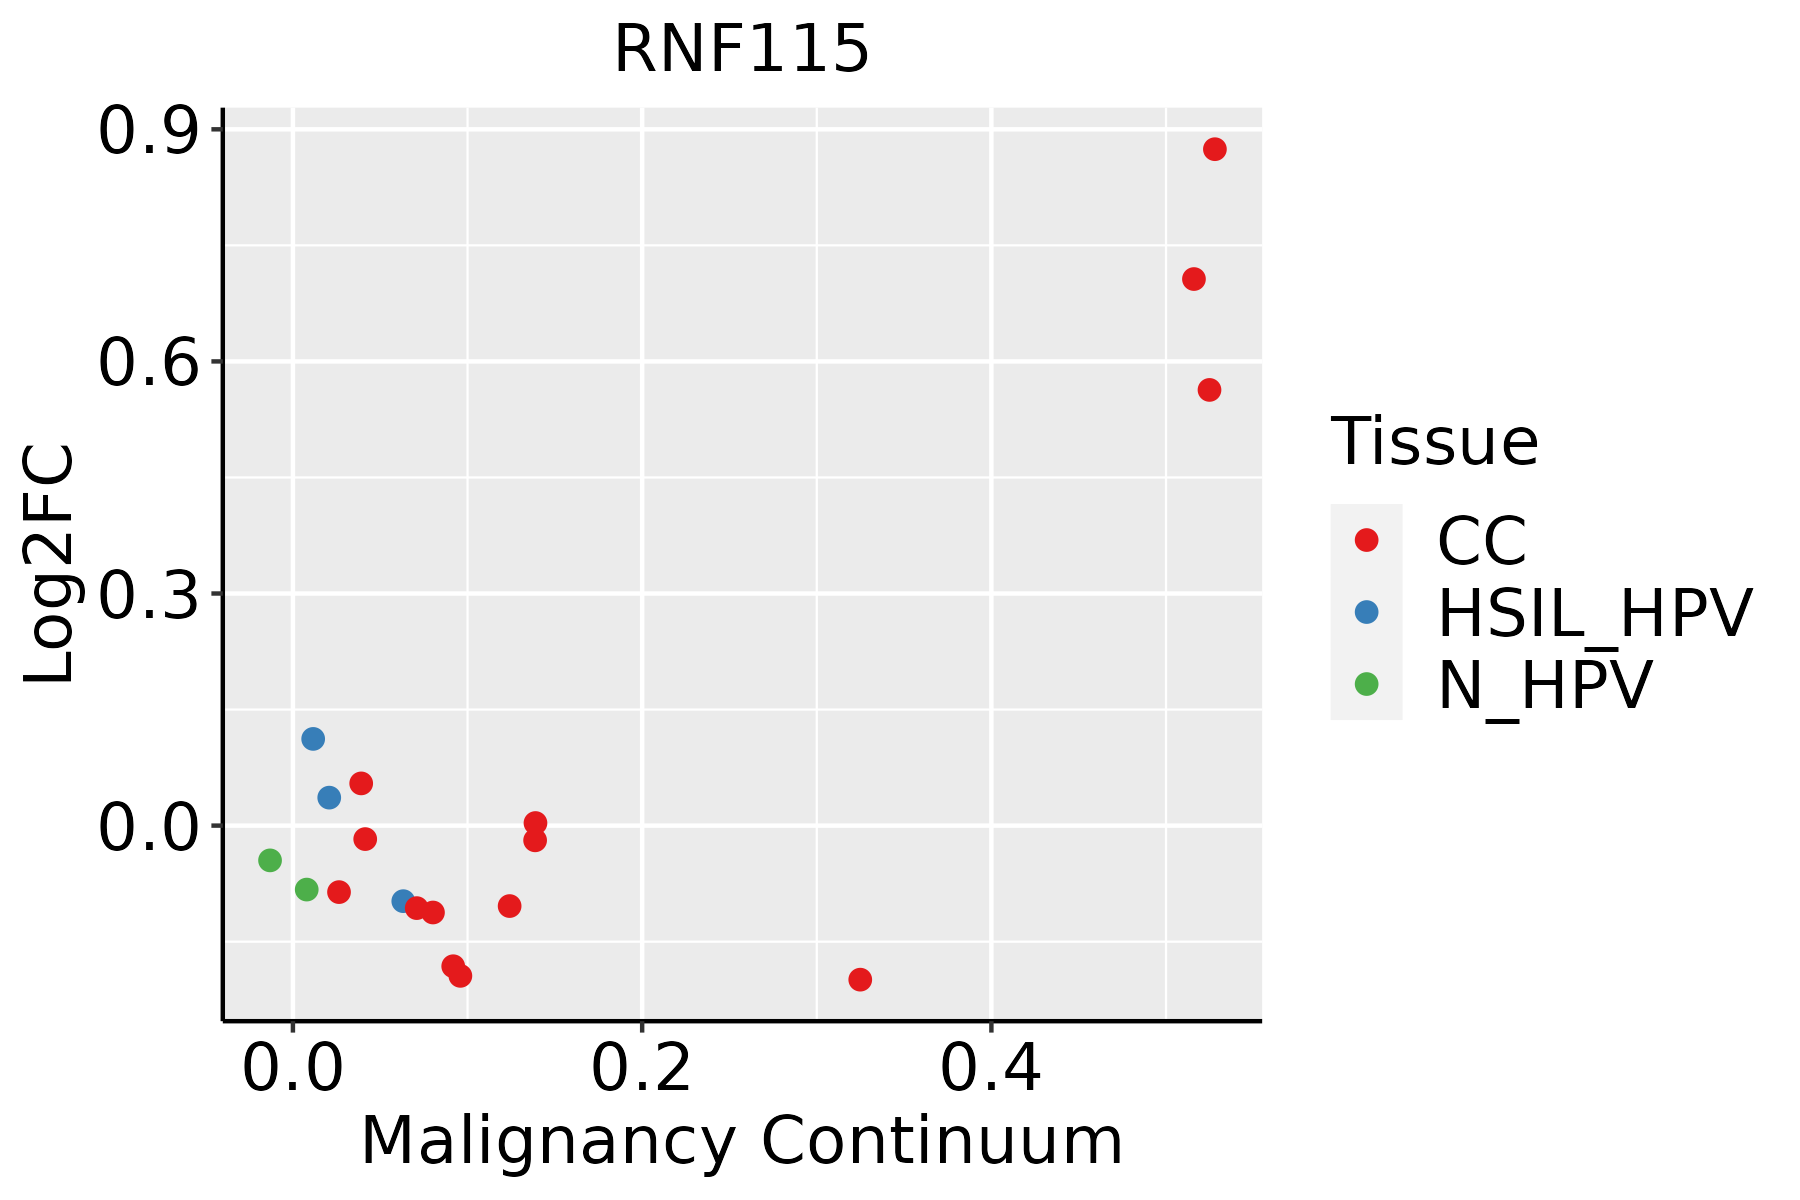 | CC: Cervix cancer |
| HSIL_HPV: HPV-infected high-grade squamous intraepithelial lesions | ||
| N_HPV: HPV-infected normal cervix | ||
| Esophagus | 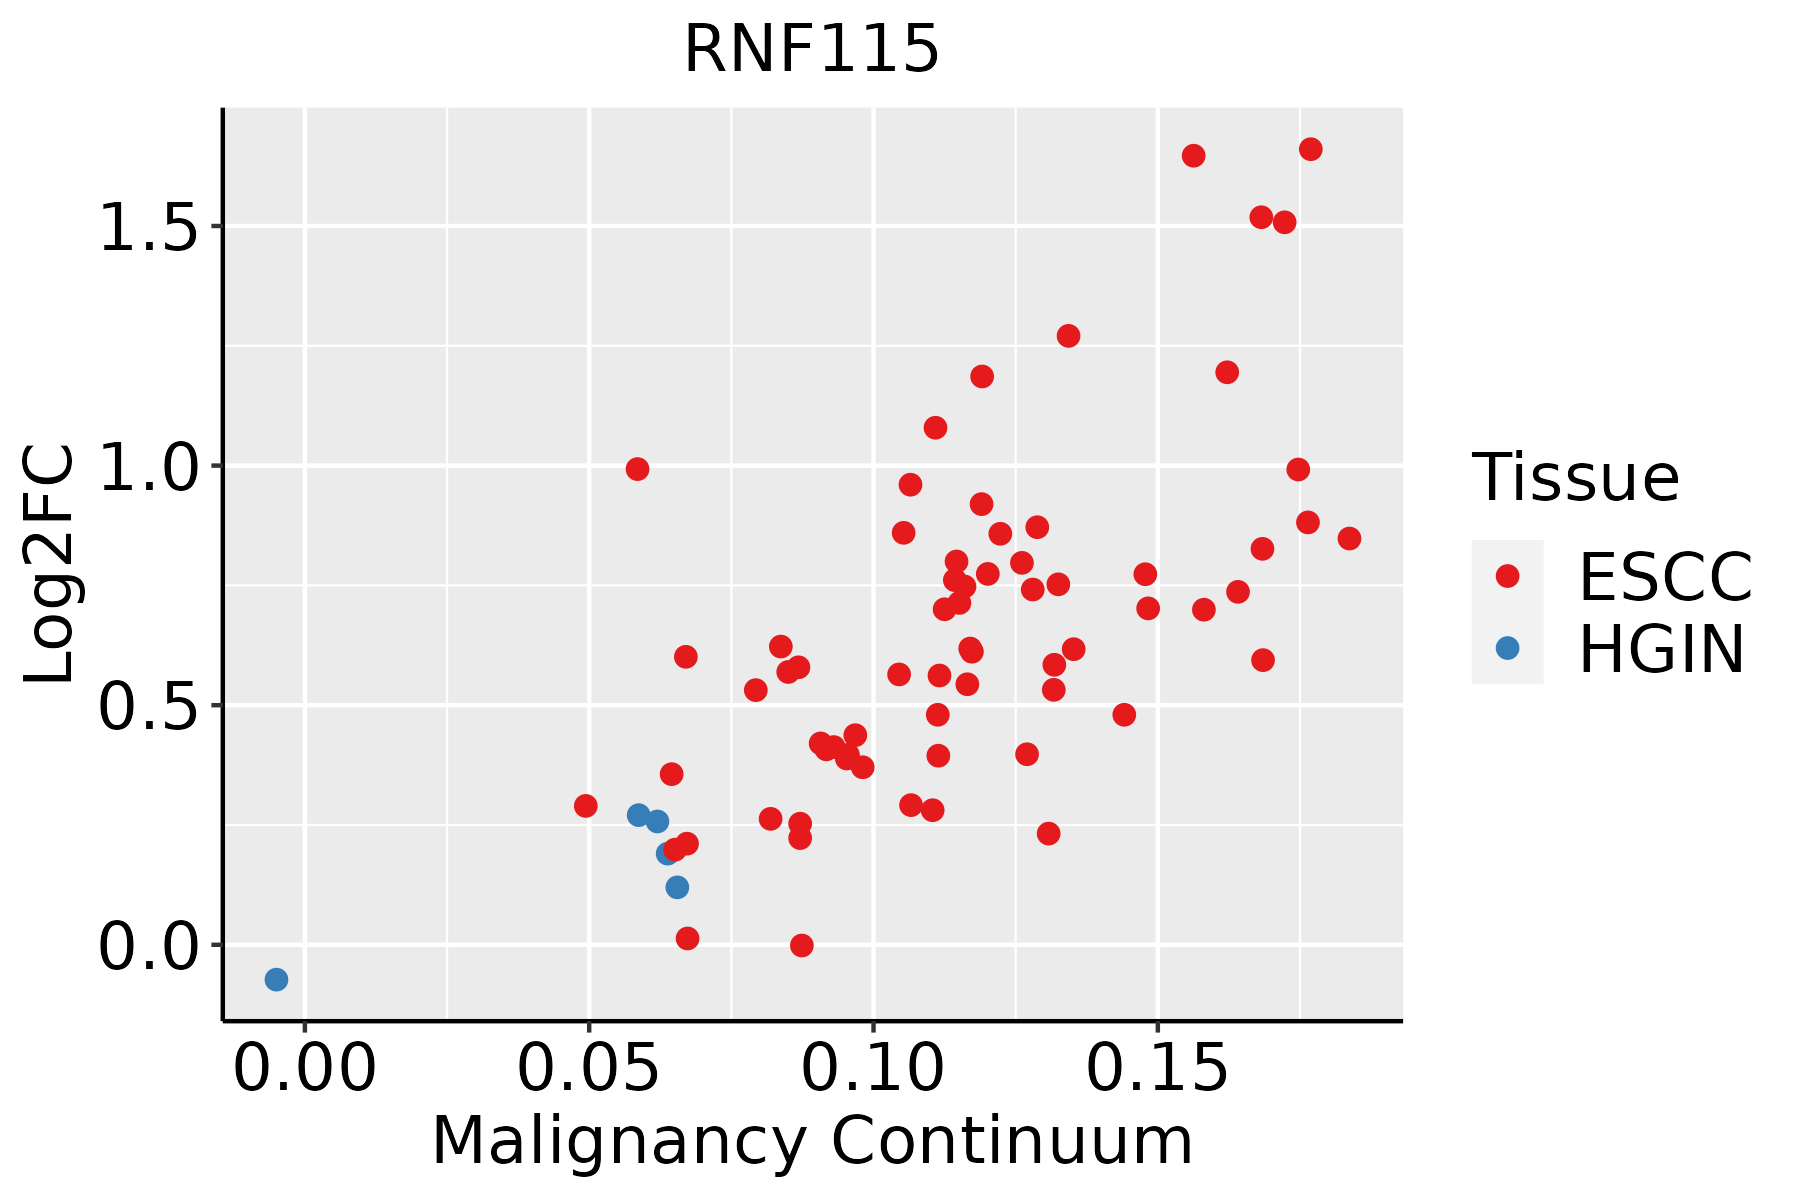 | ESCC: Esophageal squamous cell carcinoma |
| HGIN: High-grade intraepithelial neoplasias | ||
| LGIN: Low-grade intraepithelial neoplasias | ||
| Liver | 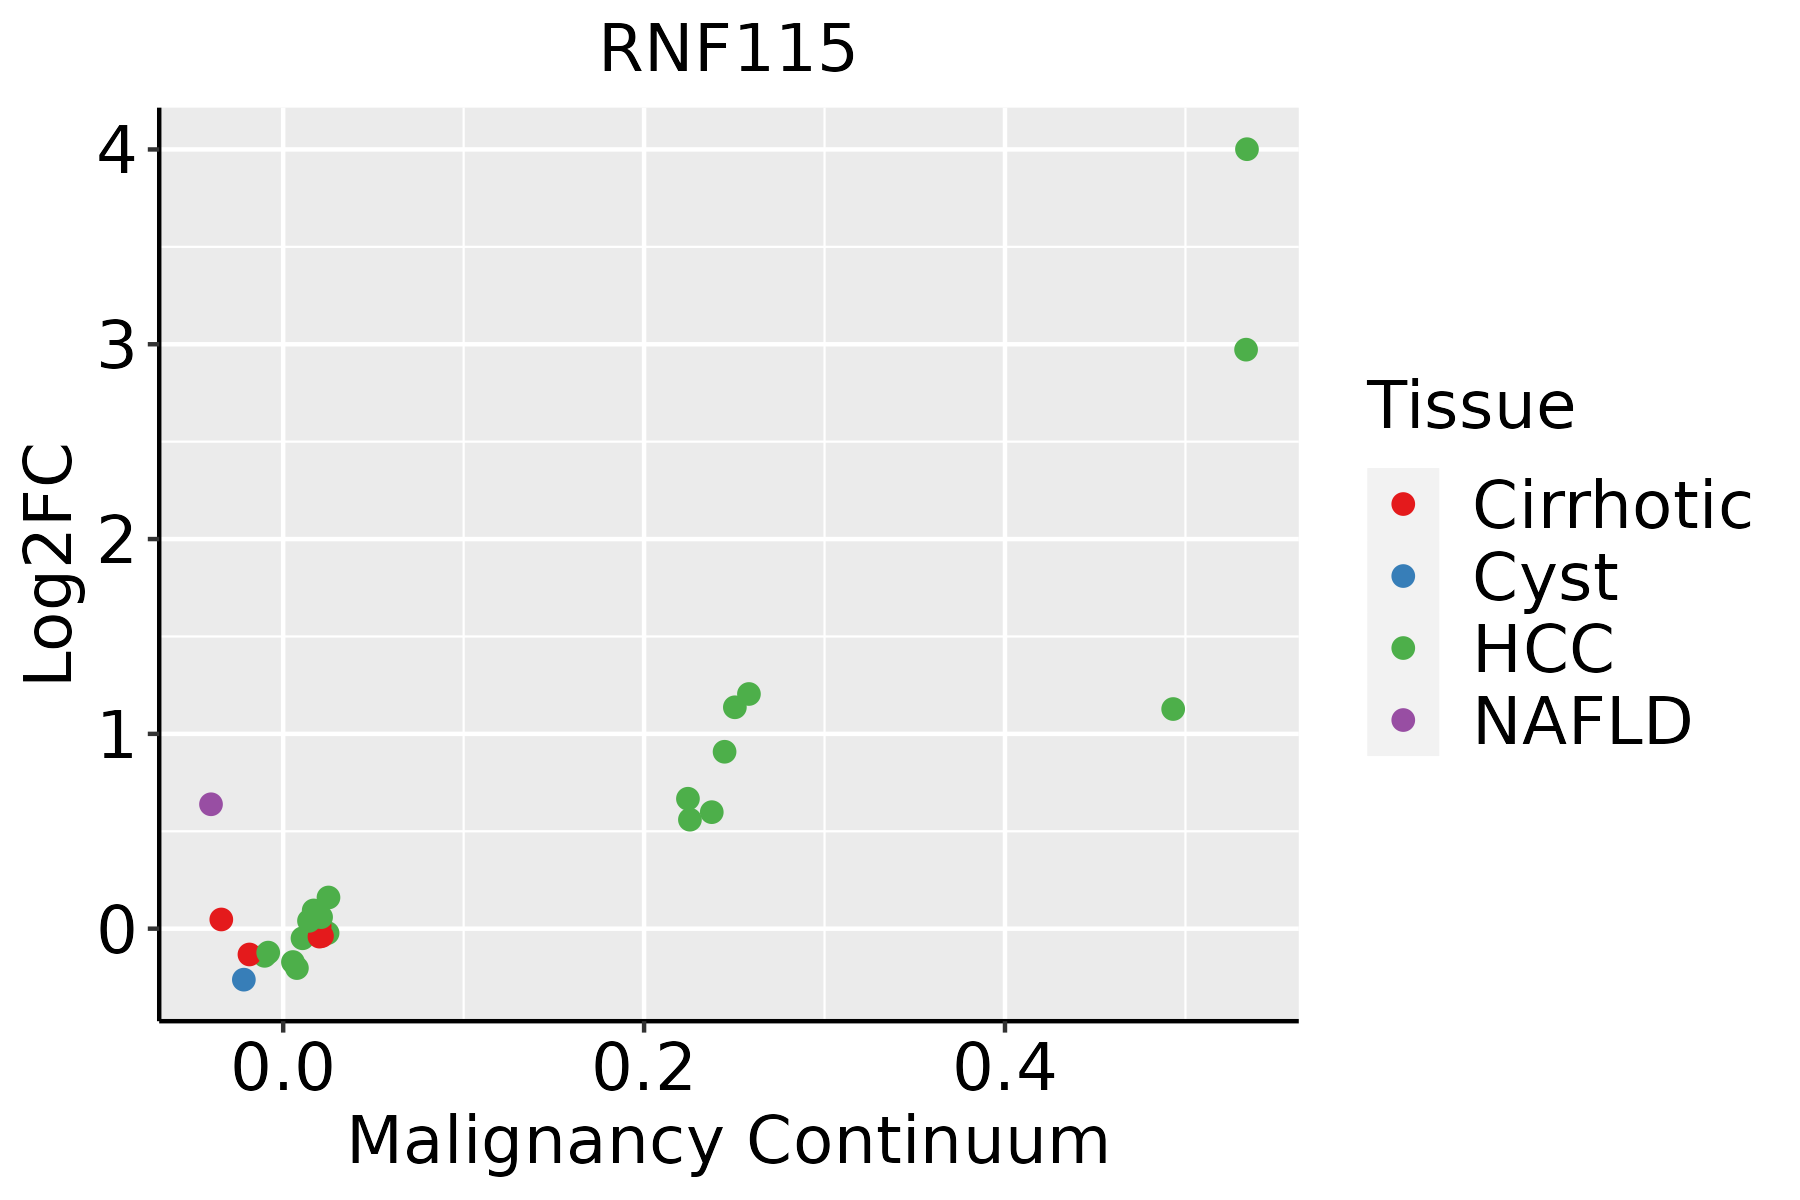 | HCC: Hepatocellular carcinoma |
| NAFLD: Non-alcoholic fatty liver disease | ||
| Lung | 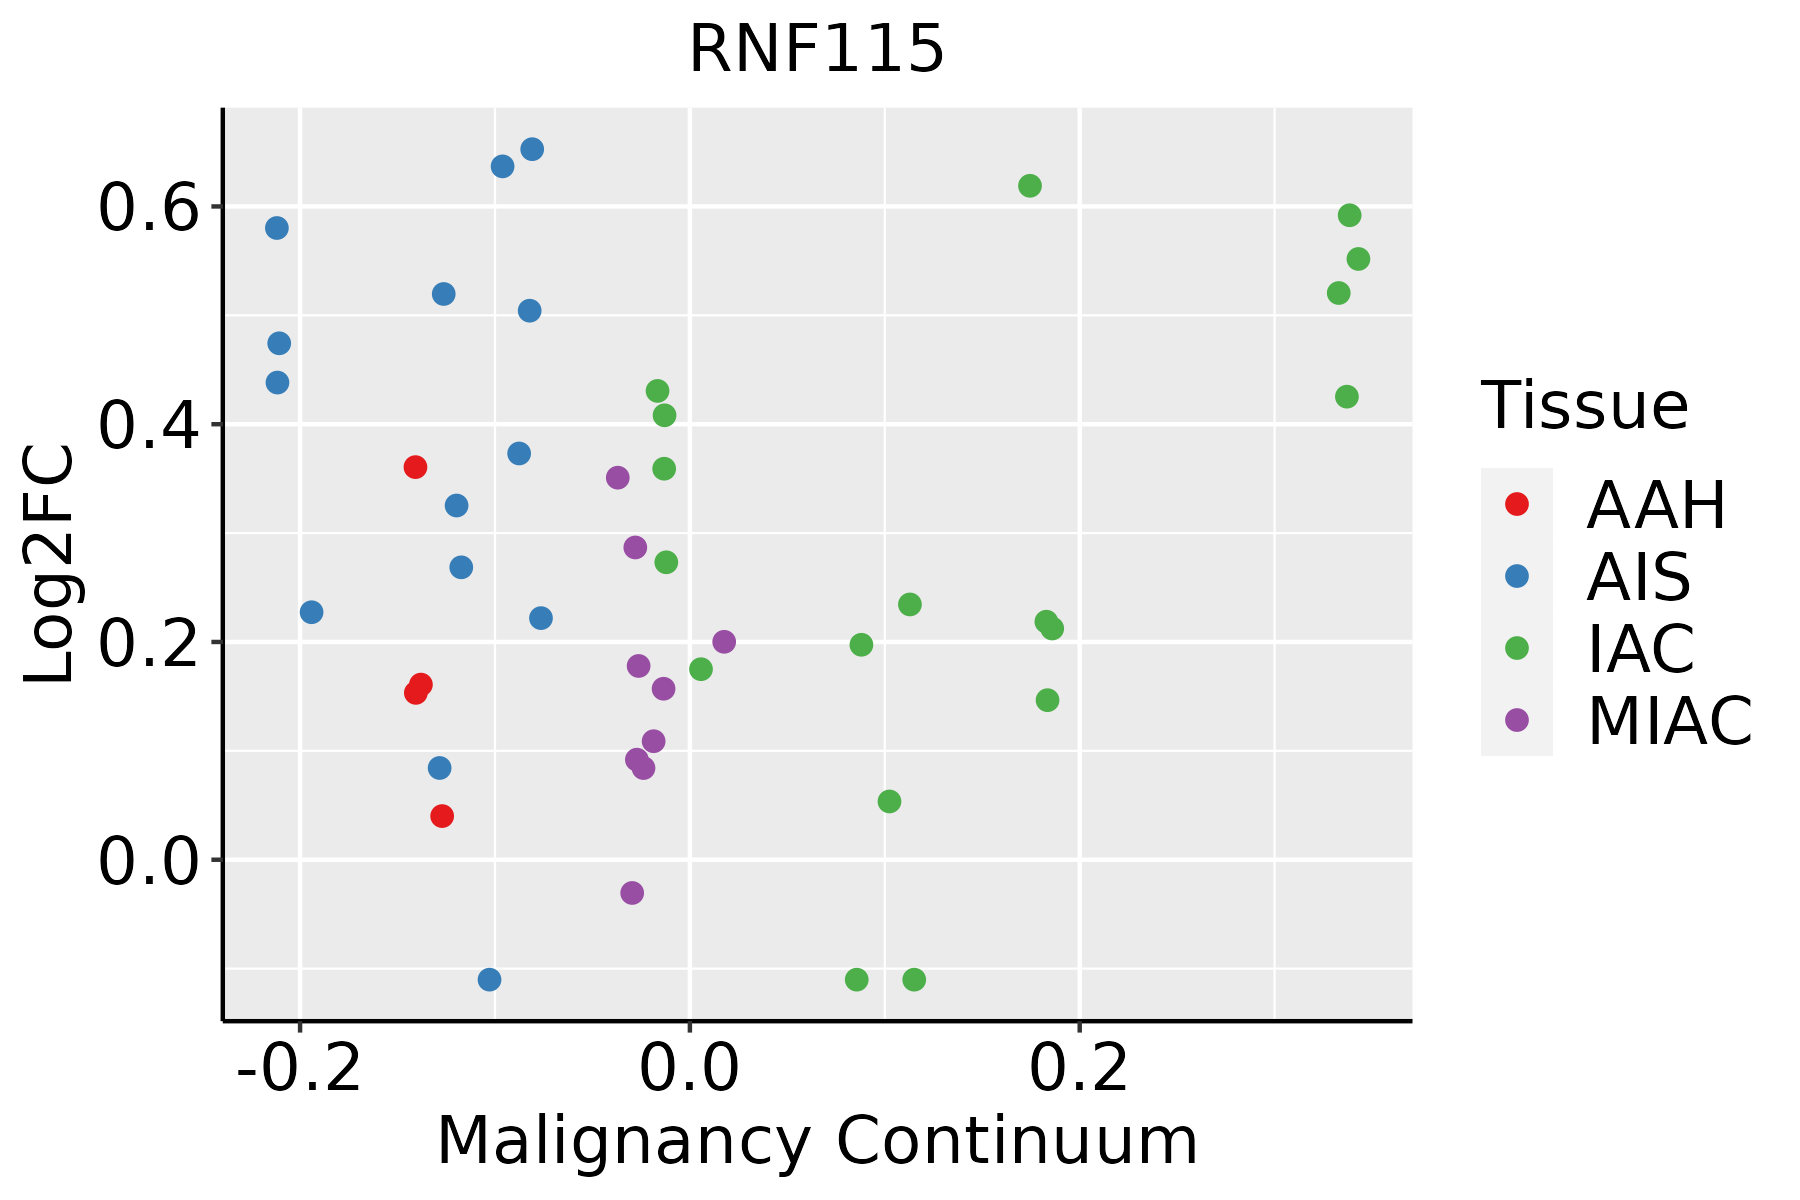 | AAH: Atypical adenomatous hyperplasia |
| AIS: Adenocarcinoma in situ | ||
| IAC: Invasive lung adenocarcinoma | ||
| MIA: Minimally invasive adenocarcinoma | ||
| Oral Cavity | 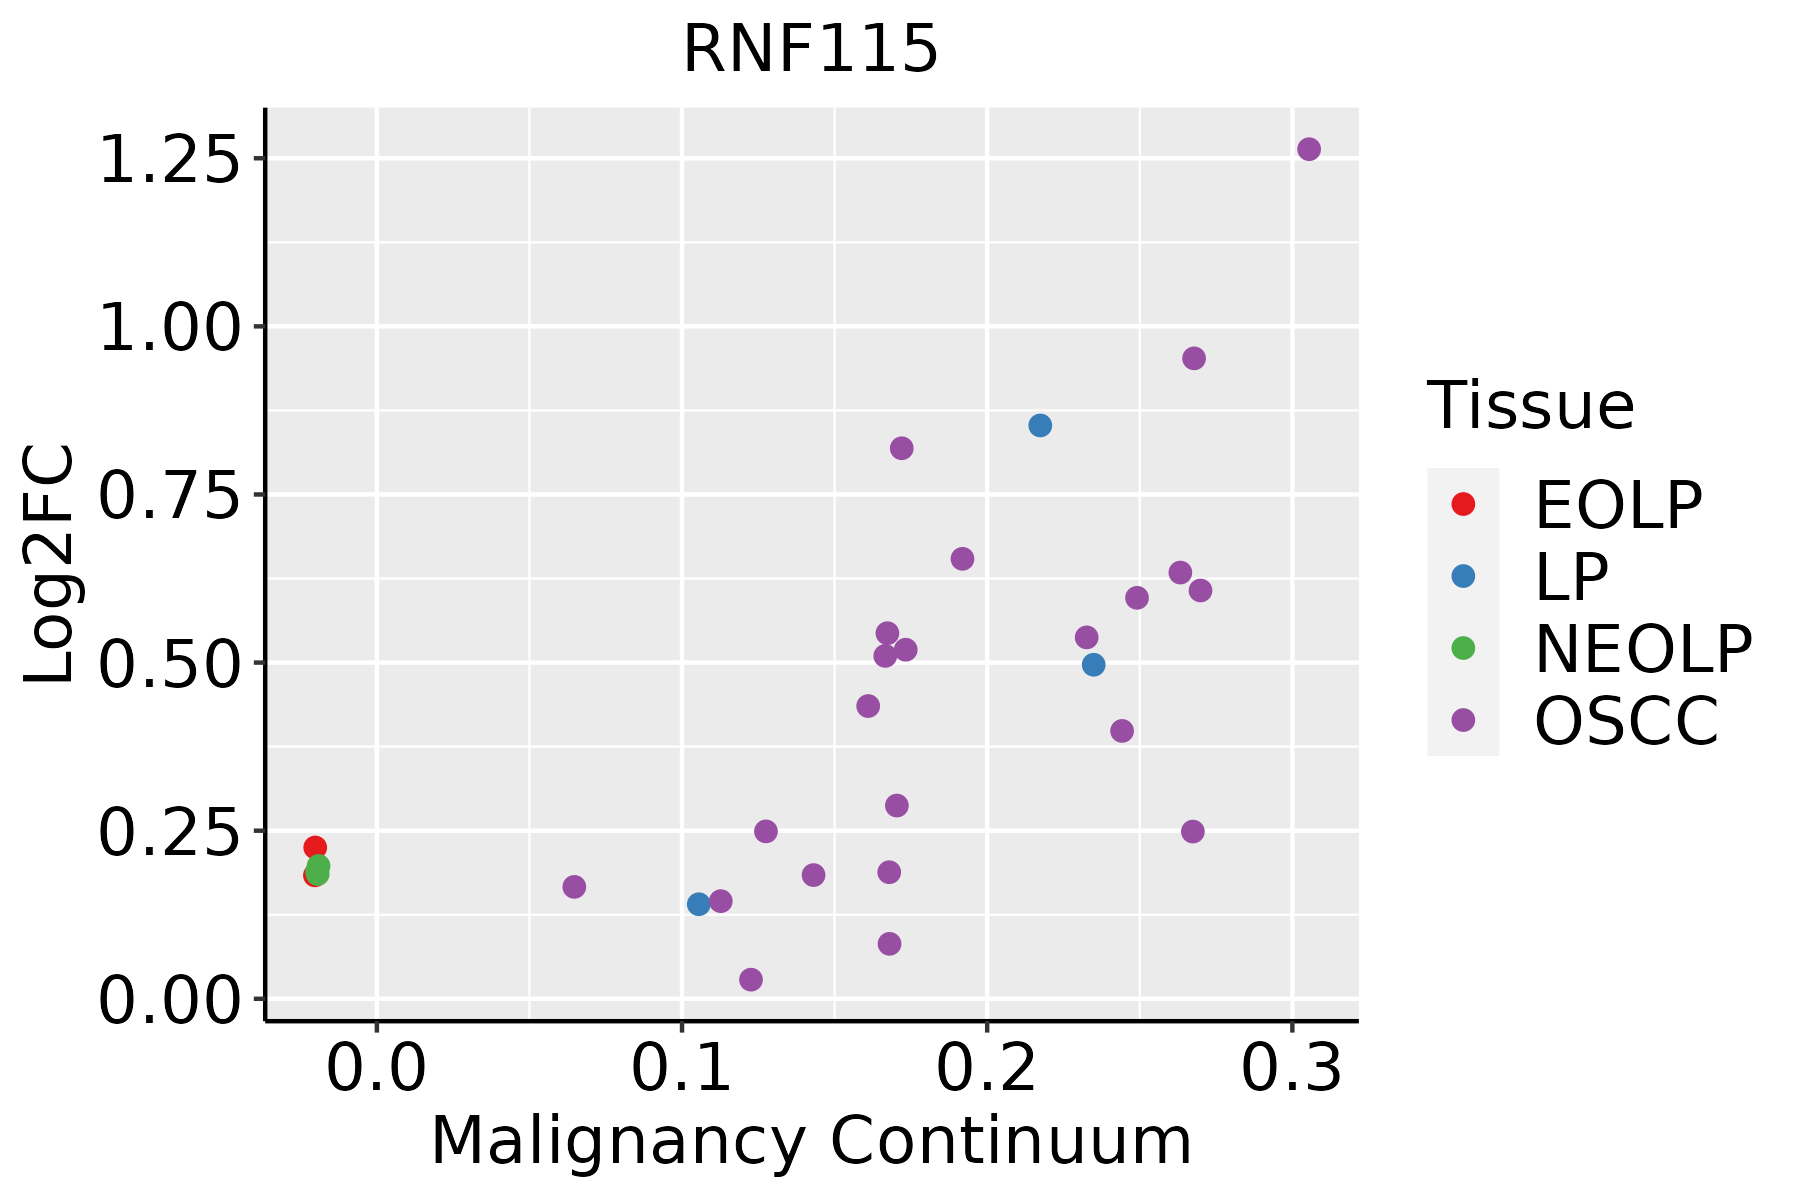 | EOLP: Erosive Oral lichen planus |
| LP: leukoplakia | ||
| NEOLP: Non-erosive oral lichen planus | ||
| OSCC: Oral squamous cell carcinoma | ||
| Skin | 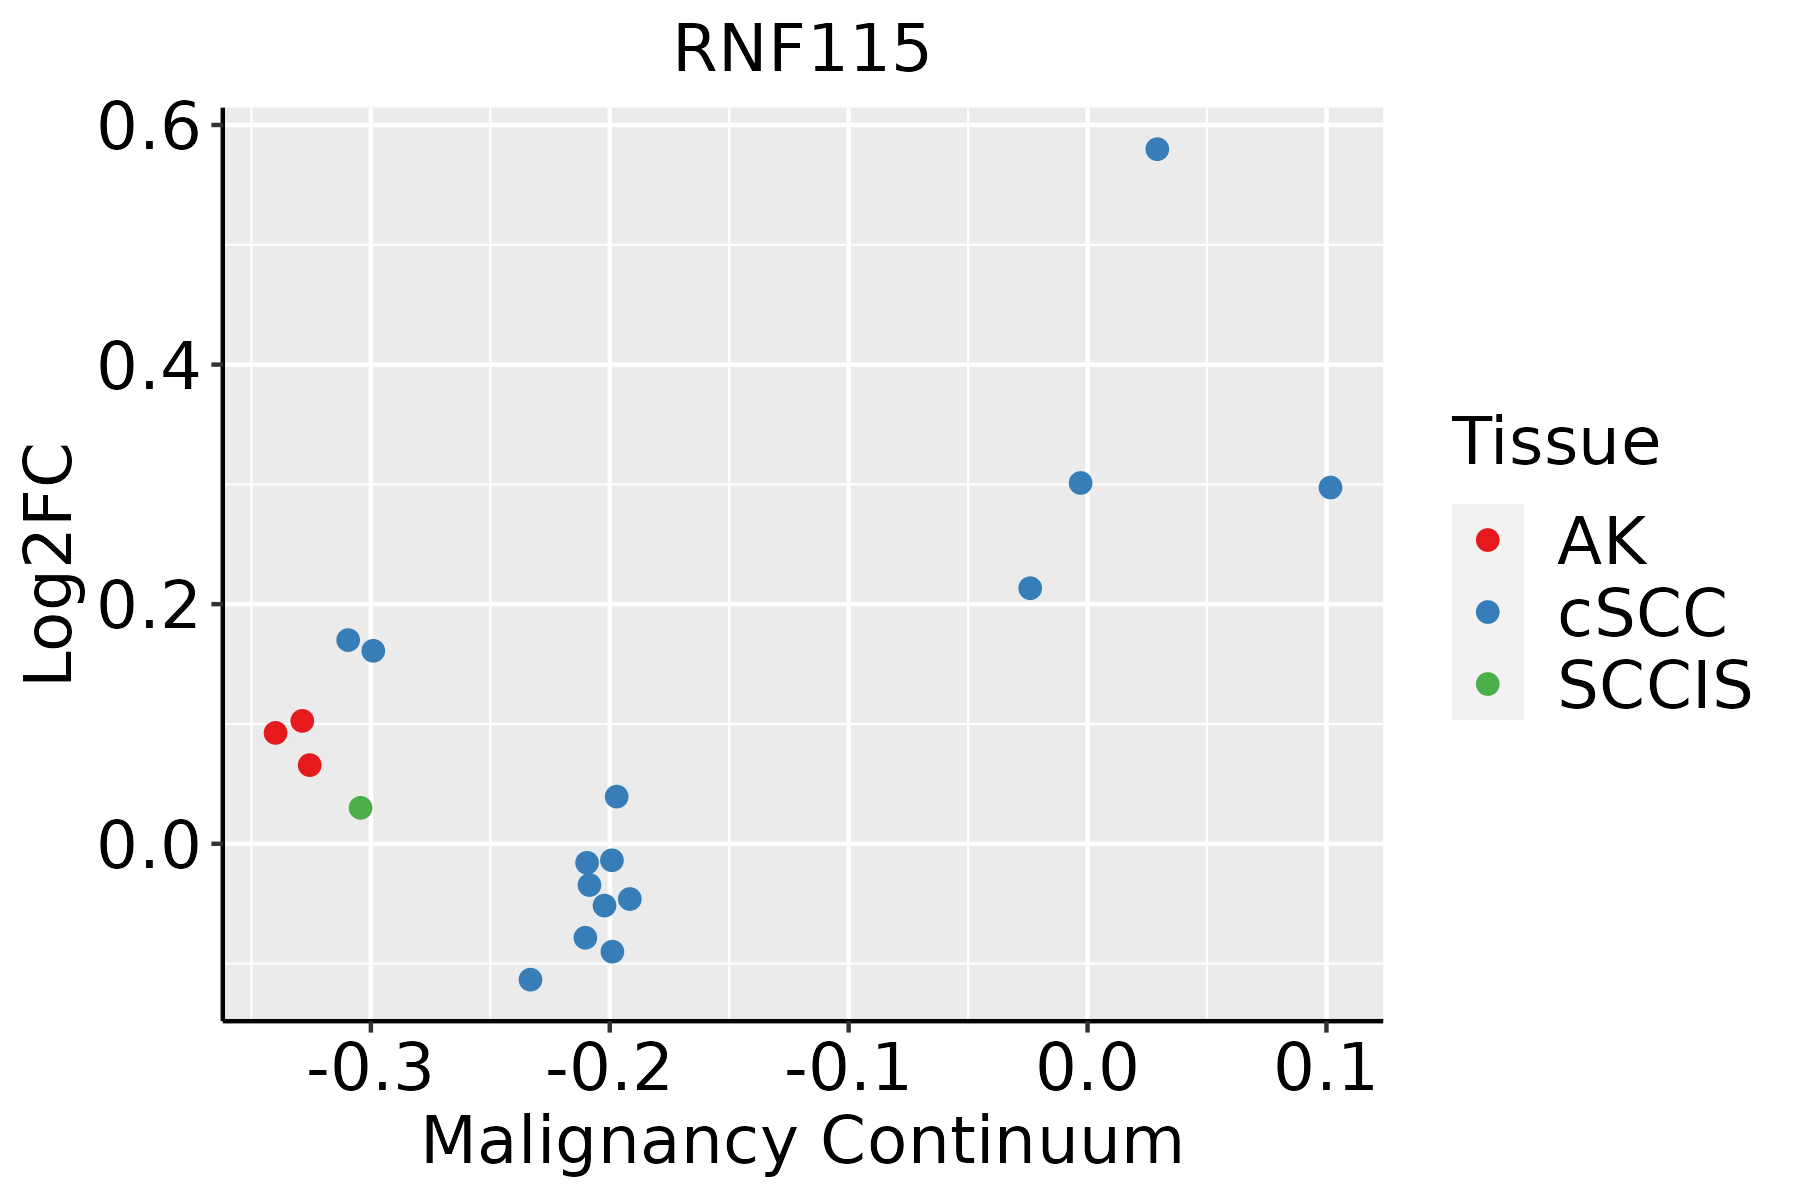 | AK: Actinic keratosis |
| cSCC: Cutaneous squamous cell carcinoma | ||
| SCCIS:squamous cell carcinoma in situ | ||
| Thyroid |  | ATC: Anaplastic thyroid cancer |
| HT: Hashimoto's thyroiditis | ||
| PTC: Papillary thyroid cancer |
| ∗log2FC in expression of this searched gene in stem-like cells from each diseased tissue sample relative to stem-like cells in normal samples in each tissue plotted against the malignancy continuum. Samples are colored based on if they are from different disease stage. |
Top |
Malignant transformation related pathway analysis |
| Find out the enriched GO biological processes and KEGG pathways involved in transition from healthy to precancer to cancer |
| Tissue | Disease Stage | Enriched GO biological Processes |
| Colorectum | AD |  |
| Colorectum | SER |  |
| Colorectum | MSS |  |
| Colorectum | MSI-H |  |
| Colorectum | FAP |  |
| ∗Top 15 enriched GO BP terms are showed in the bar plot of each disease state in each tissue. Each row represents a significant GO biological process which is colored according to the -log10(p.adjust). |
| Page: 1 2 3 4 5 6 7 8 9 |
| GO ID | Tissue | Disease Stage | Description | Gene Ratio | Bg Ratio | pvalue | p.adjust | Count |
| GO:00071738 | Cervix | CC | epidermal growth factor receptor signaling pathway | 36/2311 | 108/18723 | 1.04e-08 | 8.44e-07 | 36 |
| GO:00381278 | Cervix | CC | ERBB signaling pathway | 37/2311 | 121/18723 | 8.57e-08 | 4.88e-06 | 37 |
| GO:00002097 | Cervix | CC | protein polyubiquitination | 58/2311 | 236/18723 | 1.57e-07 | 7.41e-06 | 58 |
| GO:00709366 | Cervix | CC | protein K48-linked ubiquitination | 22/2311 | 65/18723 | 5.56e-06 | 1.38e-04 | 22 |
| GO:00420586 | Cervix | CC | regulation of epidermal growth factor receptor signaling pathway | 21/2311 | 73/18723 | 1.36e-04 | 1.67e-03 | 21 |
| GO:19011846 | Cervix | CC | regulation of ERBB signaling pathway | 22/2311 | 79/18723 | 1.61e-04 | 1.93e-03 | 22 |
| GO:19011857 | Cervix | CC | negative regulation of ERBB signaling pathway | 10/2311 | 32/18723 | 3.96e-03 | 2.48e-02 | 10 |
| GO:00420597 | Cervix | CC | negative regulation of epidermal growth factor receptor signaling pathway | 9/2311 | 28/18723 | 5.02e-03 | 2.98e-02 | 9 |
| GO:00518656 | Cervix | CC | protein autoubiquitination | 17/2311 | 73/18723 | 6.71e-03 | 3.70e-02 | 17 |
| GO:00705343 | Cervix | CC | protein K63-linked ubiquitination | 14/2311 | 56/18723 | 6.93e-03 | 3.74e-02 | 14 |
| GO:007093610 | Esophagus | HGIN | protein K48-linked ubiquitination | 24/2587 | 65/18723 | 2.69e-06 | 9.49e-05 | 24 |
| GO:000020916 | Esophagus | HGIN | protein polyubiquitination | 58/2587 | 236/18723 | 6.29e-06 | 1.97e-04 | 58 |
| GO:00705345 | Esophagus | HGIN | protein K63-linked ubiquitination | 17/2587 | 56/18723 | 1.07e-03 | 1.32e-02 | 17 |
| GO:003812717 | Esophagus | HGIN | ERBB signaling pathway | 29/2587 | 121/18723 | 1.83e-03 | 1.97e-02 | 29 |
| GO:19011848 | Esophagus | HGIN | regulation of ERBB signaling pathway | 20/2587 | 79/18723 | 4.56e-03 | 3.96e-02 | 20 |
| GO:000717317 | Esophagus | HGIN | epidermal growth factor receptor signaling pathway | 25/2587 | 108/18723 | 5.87e-03 | 4.77e-02 | 25 |
| GO:000020917 | Esophagus | ESCC | protein polyubiquitination | 170/8552 | 236/18723 | 1.40e-16 | 1.09e-14 | 170 |
| GO:007093617 | Esophagus | ESCC | protein K48-linked ubiquitination | 55/8552 | 65/18723 | 8.42e-11 | 2.58e-09 | 55 |
| GO:007053413 | Esophagus | ESCC | protein K63-linked ubiquitination | 44/8552 | 56/18723 | 4.84e-07 | 6.50e-06 | 44 |
| GO:003812718 | Esophagus | ESCC | ERBB signaling pathway | 82/8552 | 121/18723 | 7.23e-07 | 9.40e-06 | 82 |
| Page: 1 2 3 4 5 6 7 |
| Pathway ID | Tissue | Disease Stage | Description | Gene Ratio | Bg Ratio | pvalue | p.adjust | qvalue | Count |
| Page: 1 |
Top |
Cell-cell communication analysis |
| Identification of potential cell-cell interactions between two cell types and their ligand-receptor pairs for different disease states |
| Ligand | Receptor | LRpair | Pathway | Tissue | Disease Stage |
| Page: 1 |
Top |
Single-cell gene regulatory network inference analysis |
| Find out the significant the regulons (TFs) and the target genes of each regulon across cell types for different disease states |
| TF | Cell Type | Tissue | Disease Stage | Target Gene | RSS | Regulon Activity |
| ∗The dot plots of a searched regulon are shown for all cell subpopulations in each disease state of each tissue based on the regulon specific score inferred using pySCENIC and by calculating the average expression. |
| Page: 1 |
Top |
Somatic mutation of malignant transformation related genes |
| Annotation of somatic variants for genes involved in malignant transformation |
| Hugo Symbol | Variant Class | Variant Classification | dbSNP RS | HGVSc | HGVSp | HGVSp Short | SWISSPROT | BIOTYPE | SIFT | PolyPhen | Tumor Sample Barcode | Tissue | Histology | Sex | Age | Stage | Therapy Types | Drugs | Outcome |
| RNF115 | SNV | Missense_Mutation | c.389N>A | p.Arg130Gln | p.R130Q | Q9Y4L5 | protein_coding | tolerated(0.05) | benign(0) | TCGA-C8-A12M-01 | Breast | breast invasive carcinoma | Female | >=65 | I/II | Unknown | Unknown | SD | |
| RNF115 | SNV | Missense_Mutation | c.271N>G | p.Leu91Val | p.L91V | Q9Y4L5 | protein_coding | tolerated(0.13) | probably_damaging(0.967) | TCGA-EW-A1J5-01 | Breast | breast invasive carcinoma | Female | <65 | I/II | Chemotherapy | adriamycin | SD | |
| RNF115 | insertion | Frame_Shift_Ins | novel | c.312_313insGGGATGCCGGCATCAGAAGAATGTTTCGTGTTCGAAATTGTTTG | p.Arg105GlyfsTer15 | p.R105Gfs*15 | Q9Y4L5 | protein_coding | TCGA-A8-A08H-01 | Breast | breast invasive carcinoma | Female | >=65 | I/II | Unknown | Unknown | SD | ||
| RNF115 | SNV | Missense_Mutation | novel | c.350N>A | p.Arg117Lys | p.R117K | Q9Y4L5 | protein_coding | tolerated(0.07) | benign(0) | TCGA-VS-A9UI-01 | Cervix | cervical & endocervical cancer | Female | >=65 | I/II | Unknown | Unknown | SD |
| RNF115 | deletion | In_Frame_Del | novel | c.301_309delAGAGCCAAT | p.Arg101_Asn103del | p.R101_N103del | Q9Y4L5 | protein_coding | TCGA-EA-A5ZE-01 | Cervix | cervical & endocervical cancer | Female | <65 | I/II | Unknown | Unknown | PD | ||
| RNF115 | SNV | Missense_Mutation | c.747N>A | p.Phe249Leu | p.F249L | Q9Y4L5 | protein_coding | tolerated(1) | benign(0.09) | TCGA-A6-4107-01 | Colorectum | colon adenocarcinoma | Female | <65 | III/IV | Chemotherapy | 5 | SD | |
| RNF115 | SNV | Missense_Mutation | c.632C>A | p.Ser211Tyr | p.S211Y | Q9Y4L5 | protein_coding | deleterious(0) | possibly_damaging(0.67) | TCGA-AA-3977-01 | Colorectum | colon adenocarcinoma | Male | >=65 | I/II | Unknown | Unknown | SD | |
| RNF115 | SNV | Missense_Mutation | c.604N>T | p.Pro202Ser | p.P202S | Q9Y4L5 | protein_coding | deleterious(0) | probably_damaging(0.945) | TCGA-CM-6678-01 | Colorectum | colon adenocarcinoma | Female | <65 | I/II | Chemotherapy | fluorouracil | SD | |
| RNF115 | SNV | Missense_Mutation | novel | c.671T>C | p.Met224Thr | p.M224T | Q9Y4L5 | protein_coding | tolerated(0.77) | benign(0) | TCGA-F5-6814-01 | Colorectum | rectum adenocarcinoma | Male | <65 | I/II | Unknown | Unknown | SD |
| RNF115 | insertion | Frame_Shift_Ins | novel | c.167dupT | p.Leu56PhefsTer33 | p.L56Ffs*33 | Q9Y4L5 | protein_coding | TCGA-DM-A1HB-01 | Colorectum | colon adenocarcinoma | Male | >=65 | III/IV | Unknown | Unknown | SD |
| Page: 1 2 3 |
Top |
Related drugs of malignant transformation related genes |
| Identification of chemicals and drugs interact with genes involved in malignant transfromation |
| (DGIdb 4.0) |
| Entrez ID | Symbol | Category | Interaction Types | Drug Claim Name | Drug Name | PMIDs |
| Page: 1 |

Copyright 2023-Present -The University of Texas Health Science Center at Houston |