
|
|||||
|
 | |
| |
| |
| |
| |
| |
|
Gene: RNF114 |
Gene summary for RNF114 |
| Gene information | Species | Human | Gene symbol | RNF114 | Gene ID | 55905 |
| Gene name | ring finger protein 114 | |
| Gene Alias | PSORS12 | |
| Cytomap | 20q13.13 | |
| Gene Type | protein-coding | GO ID | GO:0000003 | UniProtAcc | Q9Y508 |
Top |
Malignant transformation analysis |
| Identification of the aberrant gene expression in precancerous and cancerous lesions by comparing the gene expression of stem-like cells in diseased tissues with normal stem cells |
| Entrez ID | Symbol | Replicates | Species | Organ | Tissue | Adj P-value | Log2FC | Malignancy |
| 55905 | RNF114 | HTA11_347_2000001011 | Human | Colorectum | AD | 3.17e-03 | 3.17e-01 | -0.1954 |
| 55905 | RNF114 | HTA11_99999970781_79442 | Human | Colorectum | MSS | 2.83e-07 | 4.38e-01 | 0.294 |
| 55905 | RNF114 | HTA11_99999965104_69814 | Human | Colorectum | MSS | 9.90e-11 | 6.55e-01 | 0.281 |
| 55905 | RNF114 | HTA11_99999971662_82457 | Human | Colorectum | MSS | 3.00e-23 | 9.50e-01 | 0.3859 |
| 55905 | RNF114 | A015-C-203 | Human | Colorectum | FAP | 1.62e-12 | -2.65e-01 | -0.1294 |
| 55905 | RNF114 | A015-C-204 | Human | Colorectum | FAP | 2.32e-03 | -2.32e-01 | -0.0228 |
| 55905 | RNF114 | A002-C-201 | Human | Colorectum | FAP | 2.55e-03 | -1.12e-01 | 0.0324 |
| 55905 | RNF114 | A001-C-108 | Human | Colorectum | FAP | 1.67e-08 | -1.78e-01 | -0.0272 |
| 55905 | RNF114 | A002-C-205 | Human | Colorectum | FAP | 3.97e-10 | -2.53e-01 | -0.1236 |
| 55905 | RNF114 | A015-C-006 | Human | Colorectum | FAP | 8.75e-08 | -3.20e-01 | -0.0994 |
| 55905 | RNF114 | A015-C-106 | Human | Colorectum | FAP | 1.37e-08 | -2.16e-01 | -0.0511 |
| 55905 | RNF114 | A002-C-114 | Human | Colorectum | FAP | 2.05e-06 | -2.23e-01 | -0.1561 |
| 55905 | RNF114 | A015-C-104 | Human | Colorectum | FAP | 2.53e-12 | -1.85e-01 | -0.1899 |
| 55905 | RNF114 | A001-C-014 | Human | Colorectum | FAP | 6.35e-04 | -1.70e-01 | 0.0135 |
| 55905 | RNF114 | A002-C-016 | Human | Colorectum | FAP | 1.33e-07 | -2.37e-01 | 0.0521 |
| 55905 | RNF114 | A015-C-002 | Human | Colorectum | FAP | 1.35e-04 | -2.31e-01 | -0.0763 |
| 55905 | RNF114 | A001-C-203 | Human | Colorectum | FAP | 1.51e-02 | -1.51e-01 | -0.0481 |
| 55905 | RNF114 | A002-C-116 | Human | Colorectum | FAP | 7.22e-12 | -1.50e-01 | -0.0452 |
| 55905 | RNF114 | A014-C-008 | Human | Colorectum | FAP | 7.44e-07 | -3.19e-01 | -0.191 |
| 55905 | RNF114 | A018-E-020 | Human | Colorectum | FAP | 2.90e-09 | -2.68e-01 | -0.2034 |
| Page: 1 2 3 4 5 6 7 8 |
| Tissue | Expression Dynamics | Abbreviation |
| Colorectum (GSE201348) |  | FAP: Familial adenomatous polyposis |
| CRC: Colorectal cancer | ||
| Colorectum (HTA11) |  | AD: Adenomas |
| SER: Sessile serrated lesions | ||
| MSI-H: Microsatellite-high colorectal cancer | ||
| MSS: Microsatellite stable colorectal cancer | ||
| Esophagus | 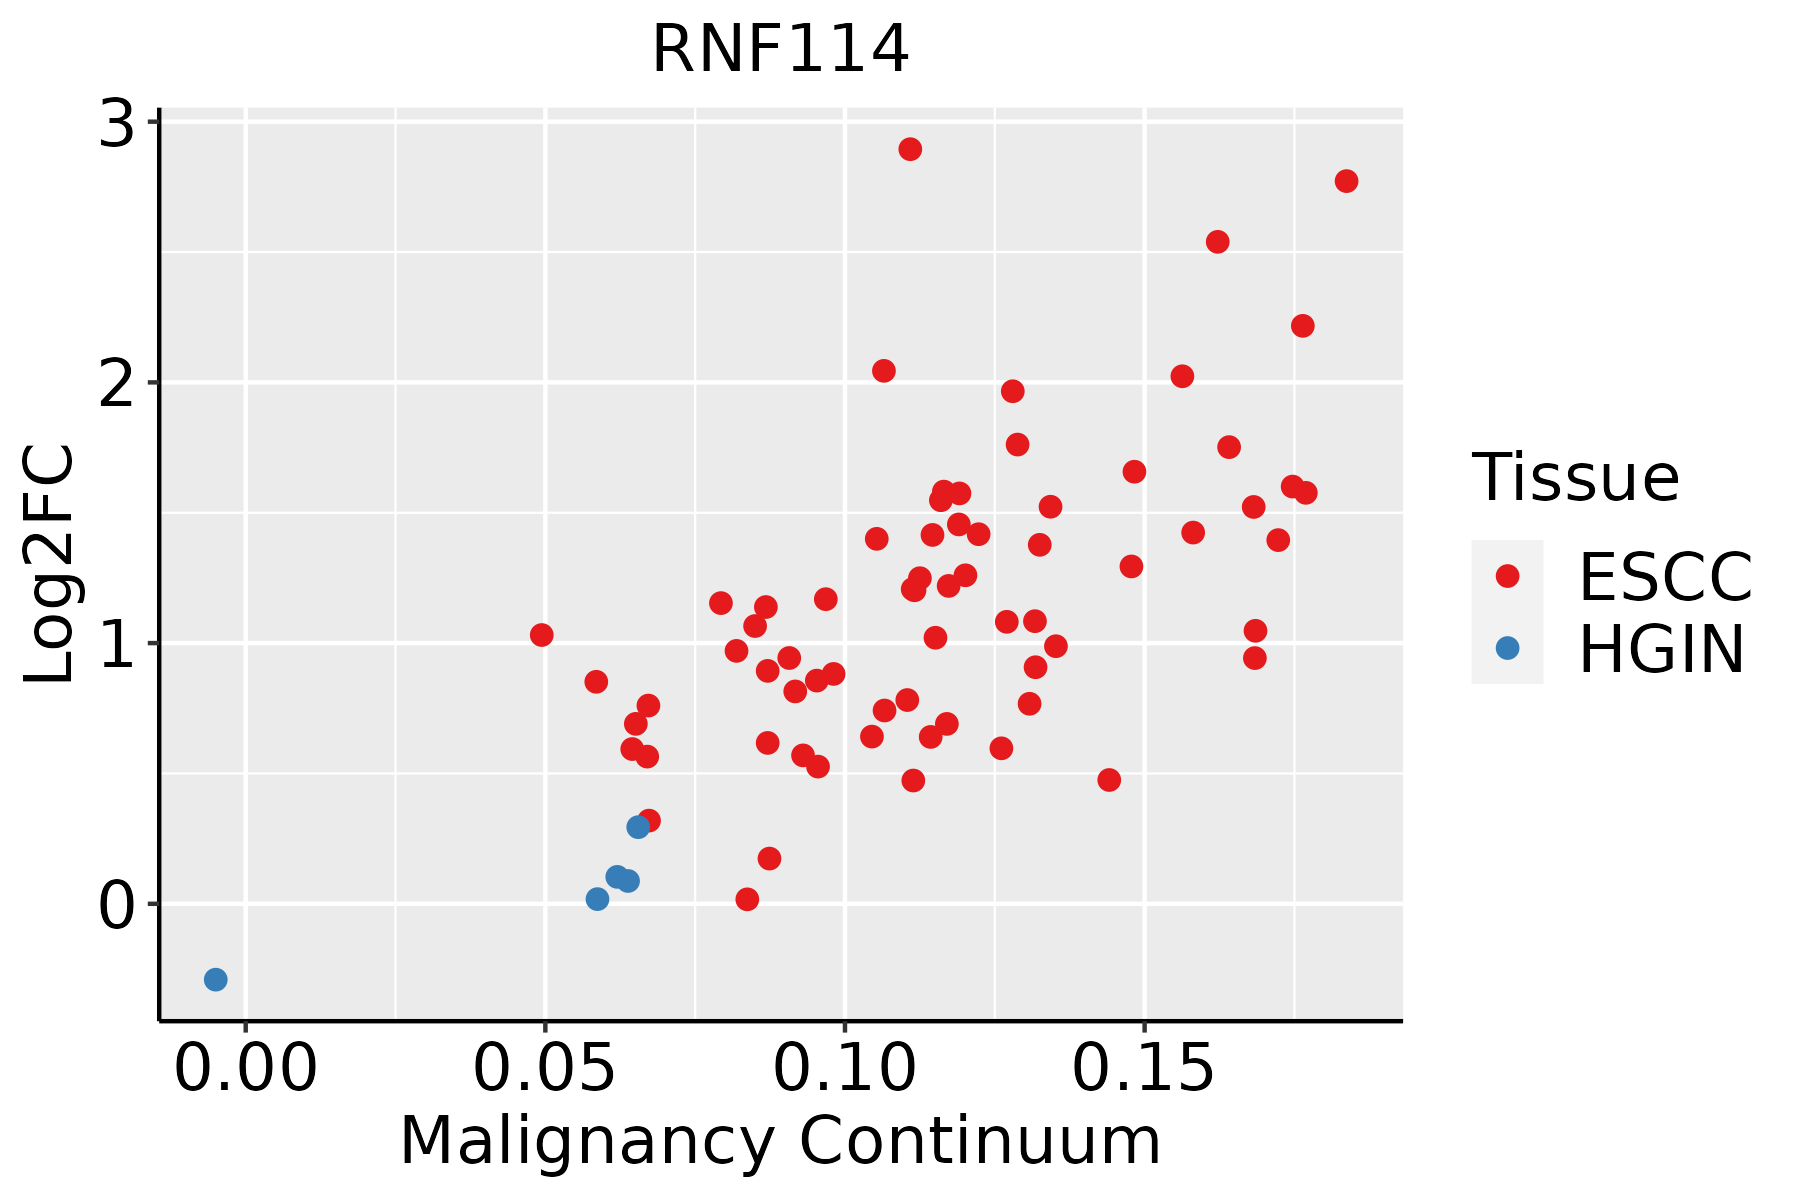 | ESCC: Esophageal squamous cell carcinoma |
| HGIN: High-grade intraepithelial neoplasias | ||
| LGIN: Low-grade intraepithelial neoplasias | ||
| Liver | 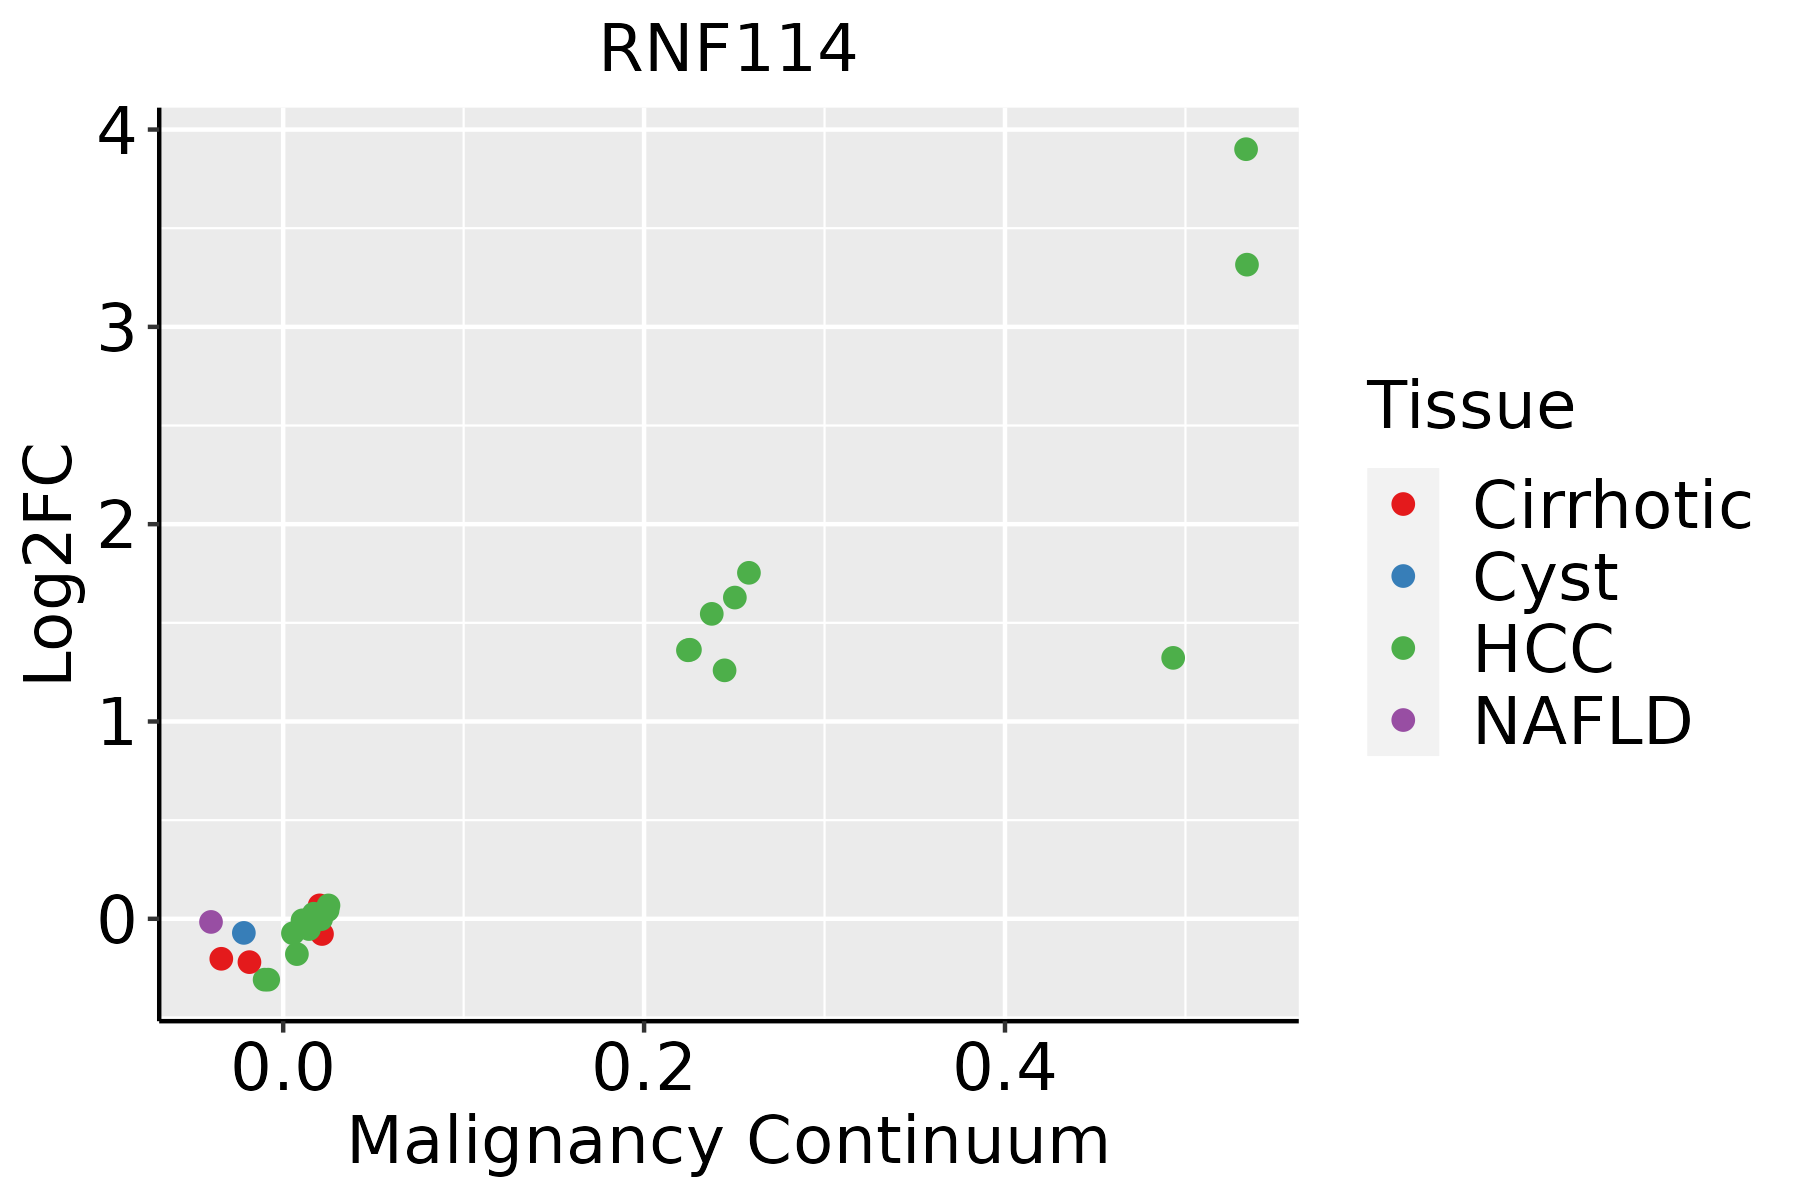 | HCC: Hepatocellular carcinoma |
| NAFLD: Non-alcoholic fatty liver disease | ||
| Oral Cavity |  | EOLP: Erosive Oral lichen planus |
| LP: leukoplakia | ||
| NEOLP: Non-erosive oral lichen planus | ||
| OSCC: Oral squamous cell carcinoma | ||
| Skin | 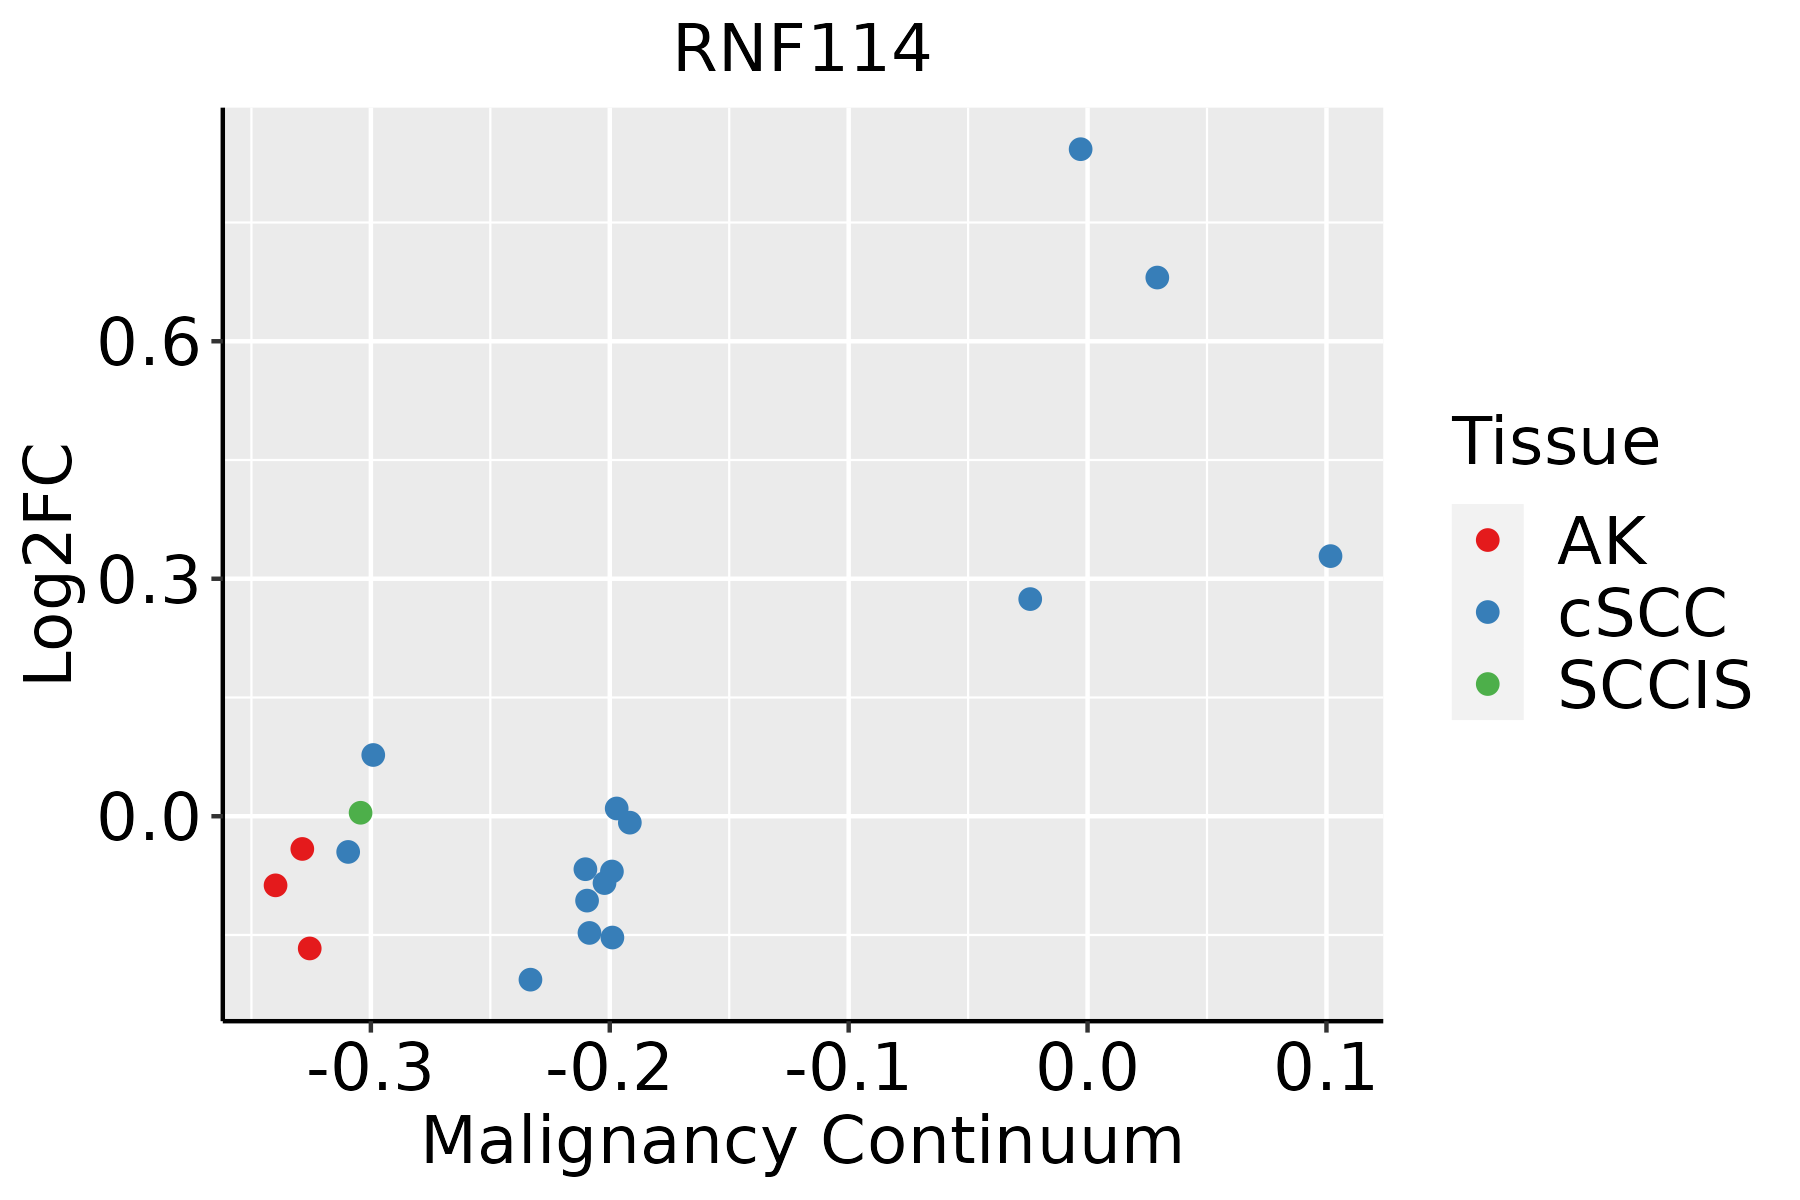 | AK: Actinic keratosis |
| cSCC: Cutaneous squamous cell carcinoma | ||
| SCCIS:squamous cell carcinoma in situ | ||
| Thyroid |  | ATC: Anaplastic thyroid cancer |
| HT: Hashimoto's thyroiditis | ||
| PTC: Papillary thyroid cancer |
| ∗log2FC in expression of this searched gene in stem-like cells from each diseased tissue sample relative to stem-like cells in normal samples in each tissue plotted against the malignancy continuum. Samples are colored based on if they are from different disease stage. |
Top |
Malignant transformation related pathway analysis |
| Find out the enriched GO biological processes and KEGG pathways involved in transition from healthy to precancer to cancer |
| Tissue | Disease Stage | Enriched GO biological Processes |
| Colorectum | AD |  |
| Colorectum | SER |  |
| Colorectum | MSS |  |
| Colorectum | MSI-H |  |
| Colorectum | FAP |  |
| ∗Top 15 enriched GO BP terms are showed in the bar plot of each disease state in each tissue. Each row represents a significant GO biological process which is colored according to the -log10(p.adjust). |
| Page: 1 2 3 4 5 6 7 8 9 |
| GO ID | Tissue | Disease Stage | Description | Gene Ratio | Bg Ratio | pvalue | p.adjust | Count |
| GO:0000209 | Colorectum | AD | protein polyubiquitination | 78/3918 | 236/18723 | 8.71e-06 | 2.06e-04 | 78 |
| GO:00002092 | Colorectum | MSS | protein polyubiquitination | 72/3467 | 236/18723 | 5.19e-06 | 1.42e-04 | 72 |
| GO:00002093 | Colorectum | FAP | protein polyubiquitination | 59/2622 | 236/18723 | 4.53e-06 | 1.52e-04 | 59 |
| GO:00002094 | Colorectum | CRC | protein polyubiquitination | 46/2078 | 236/18723 | 9.91e-05 | 1.98e-03 | 46 |
| GO:000020916 | Esophagus | HGIN | protein polyubiquitination | 58/2587 | 236/18723 | 6.29e-06 | 1.97e-04 | 58 |
| GO:000020917 | Esophagus | ESCC | protein polyubiquitination | 170/8552 | 236/18723 | 1.40e-16 | 1.09e-14 | 170 |
| GO:000020911 | Liver | Cirrhotic | protein polyubiquitination | 89/4634 | 236/18723 | 6.09e-06 | 9.80e-05 | 89 |
| GO:000020921 | Liver | HCC | protein polyubiquitination | 151/7958 | 236/18723 | 1.90e-11 | 7.59e-10 | 151 |
| GO:000020910 | Oral cavity | OSCC | protein polyubiquitination | 150/7305 | 236/18723 | 1.59e-14 | 9.27e-13 | 150 |
| GO:000020915 | Oral cavity | LP | protein polyubiquitination | 82/4623 | 236/18723 | 3.23e-04 | 3.26e-03 | 82 |
| GO:000020923 | Oral cavity | EOLP | protein polyubiquitination | 62/2218 | 236/18723 | 7.88e-10 | 5.90e-08 | 62 |
| GO:000020924 | Skin | cSCC | protein polyubiquitination | 103/4864 | 236/18723 | 2.57e-09 | 9.09e-08 | 103 |
| GO:000020920 | Thyroid | PTC | protein polyubiquitination | 128/5968 | 236/18723 | 7.81e-13 | 3.65e-11 | 128 |
| GO:0000209110 | Thyroid | ATC | protein polyubiquitination | 134/6293 | 236/18723 | 1.86e-13 | 9.20e-12 | 134 |
| Page: 1 |
| Pathway ID | Tissue | Disease Stage | Description | Gene Ratio | Bg Ratio | pvalue | p.adjust | qvalue | Count |
| Page: 1 |
Top |
Cell-cell communication analysis |
| Identification of potential cell-cell interactions between two cell types and their ligand-receptor pairs for different disease states |
| Ligand | Receptor | LRpair | Pathway | Tissue | Disease Stage |
| Page: 1 |
Top |
Single-cell gene regulatory network inference analysis |
| Find out the significant the regulons (TFs) and the target genes of each regulon across cell types for different disease states |
| TF | Cell Type | Tissue | Disease Stage | Target Gene | RSS | Regulon Activity |
| RNF114 | AT2L | Lung | ADJ | IFITM1,BCL2L15,PDLIM3, etc. | 2.15e-01 |  |
| RNF114 | BN | Prostate | ADJ | TXN,ULBP2,CITED4, etc. | 4.30e-02 |  |
| RNF114 | CD8TEXP | Prostate | ADJ | TXN,ULBP2,CITED4, etc. | 2.87e-02 | |
| RNF114 | TREG | Prostate | ADJ | TXN,ULBP2,CITED4, etc. | 2.78e-02 | |
| RNF114 | cDC | Prostate | BPH | TXN,ULBP2,CITED4, etc. | 1.06e-01 |  |
| RNF114 | CD8TEFF | Prostate | BPH | TXN,ULBP2,CITED4, etc. | 7.06e-02 | |
| RNF114 | cDC | Prostate | Healthy | TXN,ULBP2,CITED4, etc. | 1.73e-01 |  |
| RNF114 | cDC | Prostate | Tumor | TXN,ULBP2,CITED4, etc. | 9.33e-02 |  |
| RNF114 | TREG | Prostate | Tumor | TXN,ULBP2,CITED4, etc. | 1.09e-01 | |
| RNF114 | CD8TEFF | Prostate | Tumor | TXN,ULBP2,CITED4, etc. | 2.12e-01 | |
| ∗The dot plots of a searched regulon are shown for all cell subpopulations in each disease state of each tissue based on the regulon specific score inferred using pySCENIC and by calculating the average expression. |
| Page: 1 2 |
Top |
Somatic mutation of malignant transformation related genes |
| Annotation of somatic variants for genes involved in malignant transformation |
| Hugo Symbol | Variant Class | Variant Classification | dbSNP RS | HGVSc | HGVSp | HGVSp Short | SWISSPROT | BIOTYPE | SIFT | PolyPhen | Tumor Sample Barcode | Tissue | Histology | Sex | Age | Stage | Therapy Types | Drugs | Outcome |
| RNF114 | SNV | Missense_Mutation | novel | c.200N>T | p.Cys67Phe | p.C67F | Q9Y508 | protein_coding | deleterious(0) | probably_damaging(0.989) | TCGA-A2-A0EQ-01 | Breast | breast invasive carcinoma | Female | <65 | I/II | Chemotherapy | adriamycin | SD |
| RNF114 | deletion | Frame_Shift_Del | novel | c.644delN | p.Asp215AlafsTer2 | p.D215Afs*2 | Q9Y508 | protein_coding | TCGA-D8-A27V-01 | Breast | breast invasive carcinoma | Female | <65 | I/II | Hormone Therapy | tamoxiphen | SD | ||
| RNF114 | SNV | Missense_Mutation | rs775076155 | c.412N>T | p.Arg138Cys | p.R138C | Q9Y508 | protein_coding | deleterious(0) | probably_damaging(0.989) | TCGA-2W-A8YY-01 | Cervix | cervical & endocervical cancer | Female | <65 | I/II | Chemotherapy | cisplatin | CR |
| RNF114 | SNV | Missense_Mutation | c.109G>C | p.Glu37Gln | p.E37Q | Q9Y508 | protein_coding | tolerated(0.25) | possibly_damaging(0.761) | TCGA-LP-A5U2-01 | Cervix | cervical & endocervical cancer | Female | <65 | III/IV | Unknown | Unknown | SD | |
| RNF114 | SNV | Missense_Mutation | rs200431004 | c.565N>A | p.Ala189Thr | p.A189T | Q9Y508 | protein_coding | tolerated(0.1) | benign(0.058) | TCGA-A5-A0G2-01 | Endometrium | uterine corpus endometrioid carcinoma | Female | <65 | III/IV | Unknown | Unknown | SD |
| RNF114 | SNV | Missense_Mutation | novel | c.673N>G | p.Ile225Val | p.I225V | Q9Y508 | protein_coding | tolerated(0.09) | benign(0.007) | TCGA-A5-A1OF-01 | Endometrium | uterine corpus endometrioid carcinoma | Female | <65 | I/II | Unknown | Unknown | SD |
| RNF114 | SNV | Missense_Mutation | novel | c.603N>G | p.Phe201Leu | p.F201L | Q9Y508 | protein_coding | deleterious(0) | probably_damaging(0.998) | TCGA-A5-A2K5-01 | Endometrium | uterine corpus endometrioid carcinoma | Female | >=65 | I/II | Unknown | Unknown | SD |
| RNF114 | SNV | Missense_Mutation | rs549059024 | c.208N>A | p.Ala70Thr | p.A70T | Q9Y508 | protein_coding | tolerated(0.56) | benign(0) | TCGA-AP-A0LM-01 | Endometrium | uterine corpus endometrioid carcinoma | Female | <65 | III/IV | Chemotherapy | cisplatin | SD |
| RNF114 | SNV | Missense_Mutation | novel | c.173A>C | p.Lys58Thr | p.K58T | Q9Y508 | protein_coding | deleterious(0.02) | possibly_damaging(0.76) | TCGA-AP-A1DV-01 | Endometrium | uterine corpus endometrioid carcinoma | Female | <65 | I/II | Unknown | Unknown | SD |
| RNF114 | SNV | Missense_Mutation | rs758000156 | c.203G>A | p.Arg68His | p.R68H | Q9Y508 | protein_coding | deleterious(0.04) | probably_damaging(0.98) | TCGA-D1-A0ZV-01 | Endometrium | uterine corpus endometrioid carcinoma | Female | <65 | I/II | Unknown | Unknown | SD |
| Page: 1 2 |
Top |
Related drugs of malignant transformation related genes |
| Identification of chemicals and drugs interact with genes involved in malignant transfromation |
| (DGIdb 4.0) |
| Entrez ID | Symbol | Category | Interaction Types | Drug Claim Name | Drug Name | PMIDs |
| Page: 1 |

Copyright 2023-Present -The University of Texas Health Science Center at Houston |