
|
|||||
|
 | |
| |
| |
| |
| |
| |
|
Gene: RNF113A |
Gene summary for RNF113A |
| Gene information | Species | Human | Gene symbol | RNF113A | Gene ID | 7737 |
| Gene name | ring finger protein 113A | |
| Gene Alias | Cwc24 | |
| Cytomap | Xq24 | |
| Gene Type | protein-coding | GO ID | GO:0000375 | UniProtAcc | O15541 |
Top |
Malignant transformation analysis |
| Identification of the aberrant gene expression in precancerous and cancerous lesions by comparing the gene expression of stem-like cells in diseased tissues with normal stem cells |
| Entrez ID | Symbol | Replicates | Species | Organ | Tissue | Adj P-value | Log2FC | Malignancy |
| 7737 | RNF113A | LZE4T | Human | Esophagus | ESCC | 5.77e-03 | 2.12e-01 | 0.0811 |
| 7737 | RNF113A | LZE7T | Human | Esophagus | ESCC | 1.67e-08 | 7.47e-01 | 0.0667 |
| 7737 | RNF113A | LZE8T | Human | Esophagus | ESCC | 4.30e-02 | 1.03e-01 | 0.067 |
| 7737 | RNF113A | LZE20T | Human | Esophagus | ESCC | 3.68e-05 | 3.13e-01 | 0.0662 |
| 7737 | RNF113A | LZE24T | Human | Esophagus | ESCC | 3.68e-24 | 7.42e-01 | 0.0596 |
| 7737 | RNF113A | LZE21T | Human | Esophagus | ESCC | 2.06e-05 | 2.13e-01 | 0.0655 |
| 7737 | RNF113A | LZE6T | Human | Esophagus | ESCC | 9.67e-07 | 2.39e-01 | 0.0845 |
| 7737 | RNF113A | P1T-E | Human | Esophagus | ESCC | 7.80e-08 | 5.42e-01 | 0.0875 |
| 7737 | RNF113A | P2T-E | Human | Esophagus | ESCC | 1.98e-25 | 4.77e-01 | 0.1177 |
| 7737 | RNF113A | P4T-E | Human | Esophagus | ESCC | 1.22e-12 | 3.89e-01 | 0.1323 |
| 7737 | RNF113A | P5T-E | Human | Esophagus | ESCC | 1.22e-07 | 2.07e-01 | 0.1327 |
| 7737 | RNF113A | P8T-E | Human | Esophagus | ESCC | 1.36e-14 | 2.34e-01 | 0.0889 |
| 7737 | RNF113A | P9T-E | Human | Esophagus | ESCC | 2.53e-21 | 3.93e-01 | 0.1131 |
| 7737 | RNF113A | P10T-E | Human | Esophagus | ESCC | 8.00e-35 | 7.11e-01 | 0.116 |
| 7737 | RNF113A | P11T-E | Human | Esophagus | ESCC | 2.13e-08 | 3.67e-01 | 0.1426 |
| 7737 | RNF113A | P12T-E | Human | Esophagus | ESCC | 1.23e-14 | 2.03e-01 | 0.1122 |
| 7737 | RNF113A | P15T-E | Human | Esophagus | ESCC | 2.80e-12 | 2.80e-01 | 0.1149 |
| 7737 | RNF113A | P16T-E | Human | Esophagus | ESCC | 4.58e-15 | 2.24e-01 | 0.1153 |
| 7737 | RNF113A | P17T-E | Human | Esophagus | ESCC | 4.93e-07 | 2.43e-01 | 0.1278 |
| 7737 | RNF113A | P20T-E | Human | Esophagus | ESCC | 2.93e-13 | 3.82e-01 | 0.1124 |
| Page: 1 2 3 4 5 |
| Tissue | Expression Dynamics | Abbreviation |
| Esophagus | 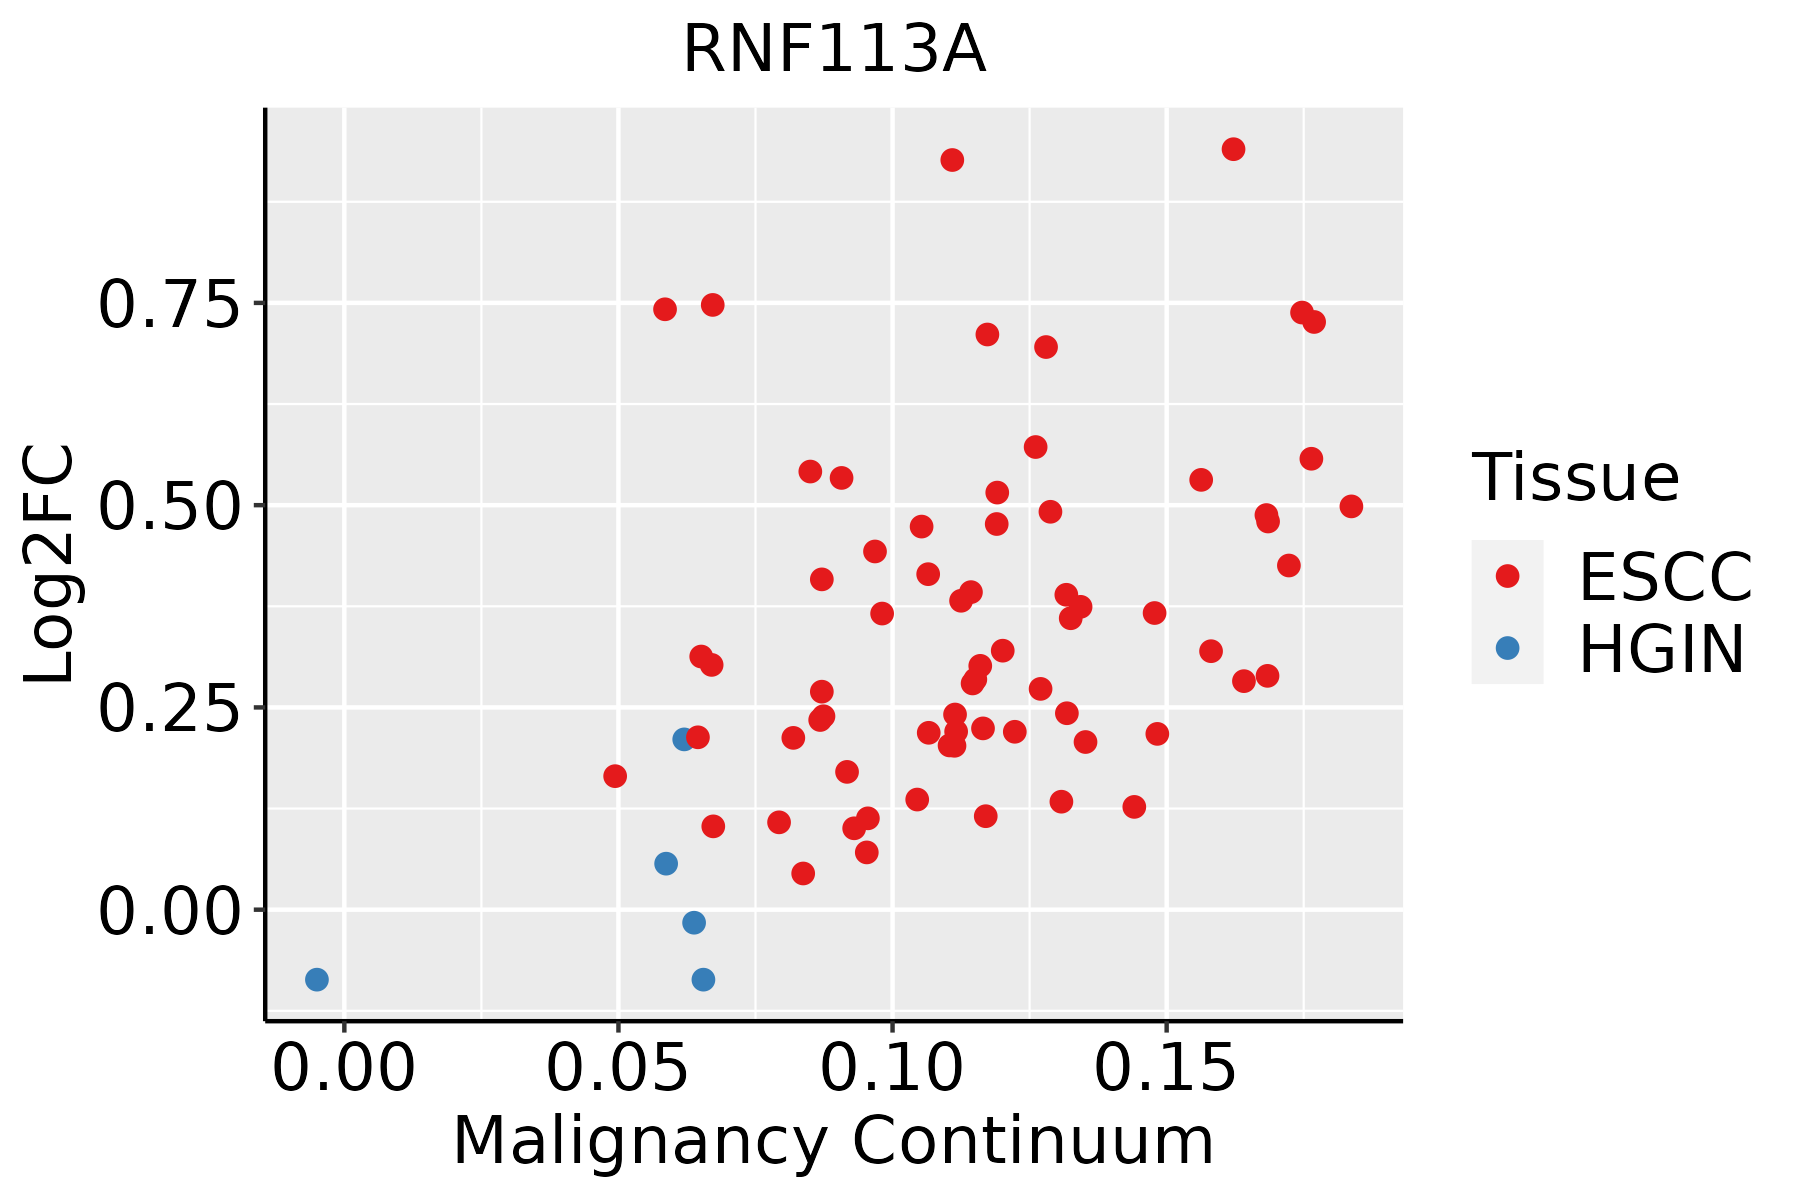 | ESCC: Esophageal squamous cell carcinoma |
| HGIN: High-grade intraepithelial neoplasias | ||
| LGIN: Low-grade intraepithelial neoplasias | ||
| Liver | 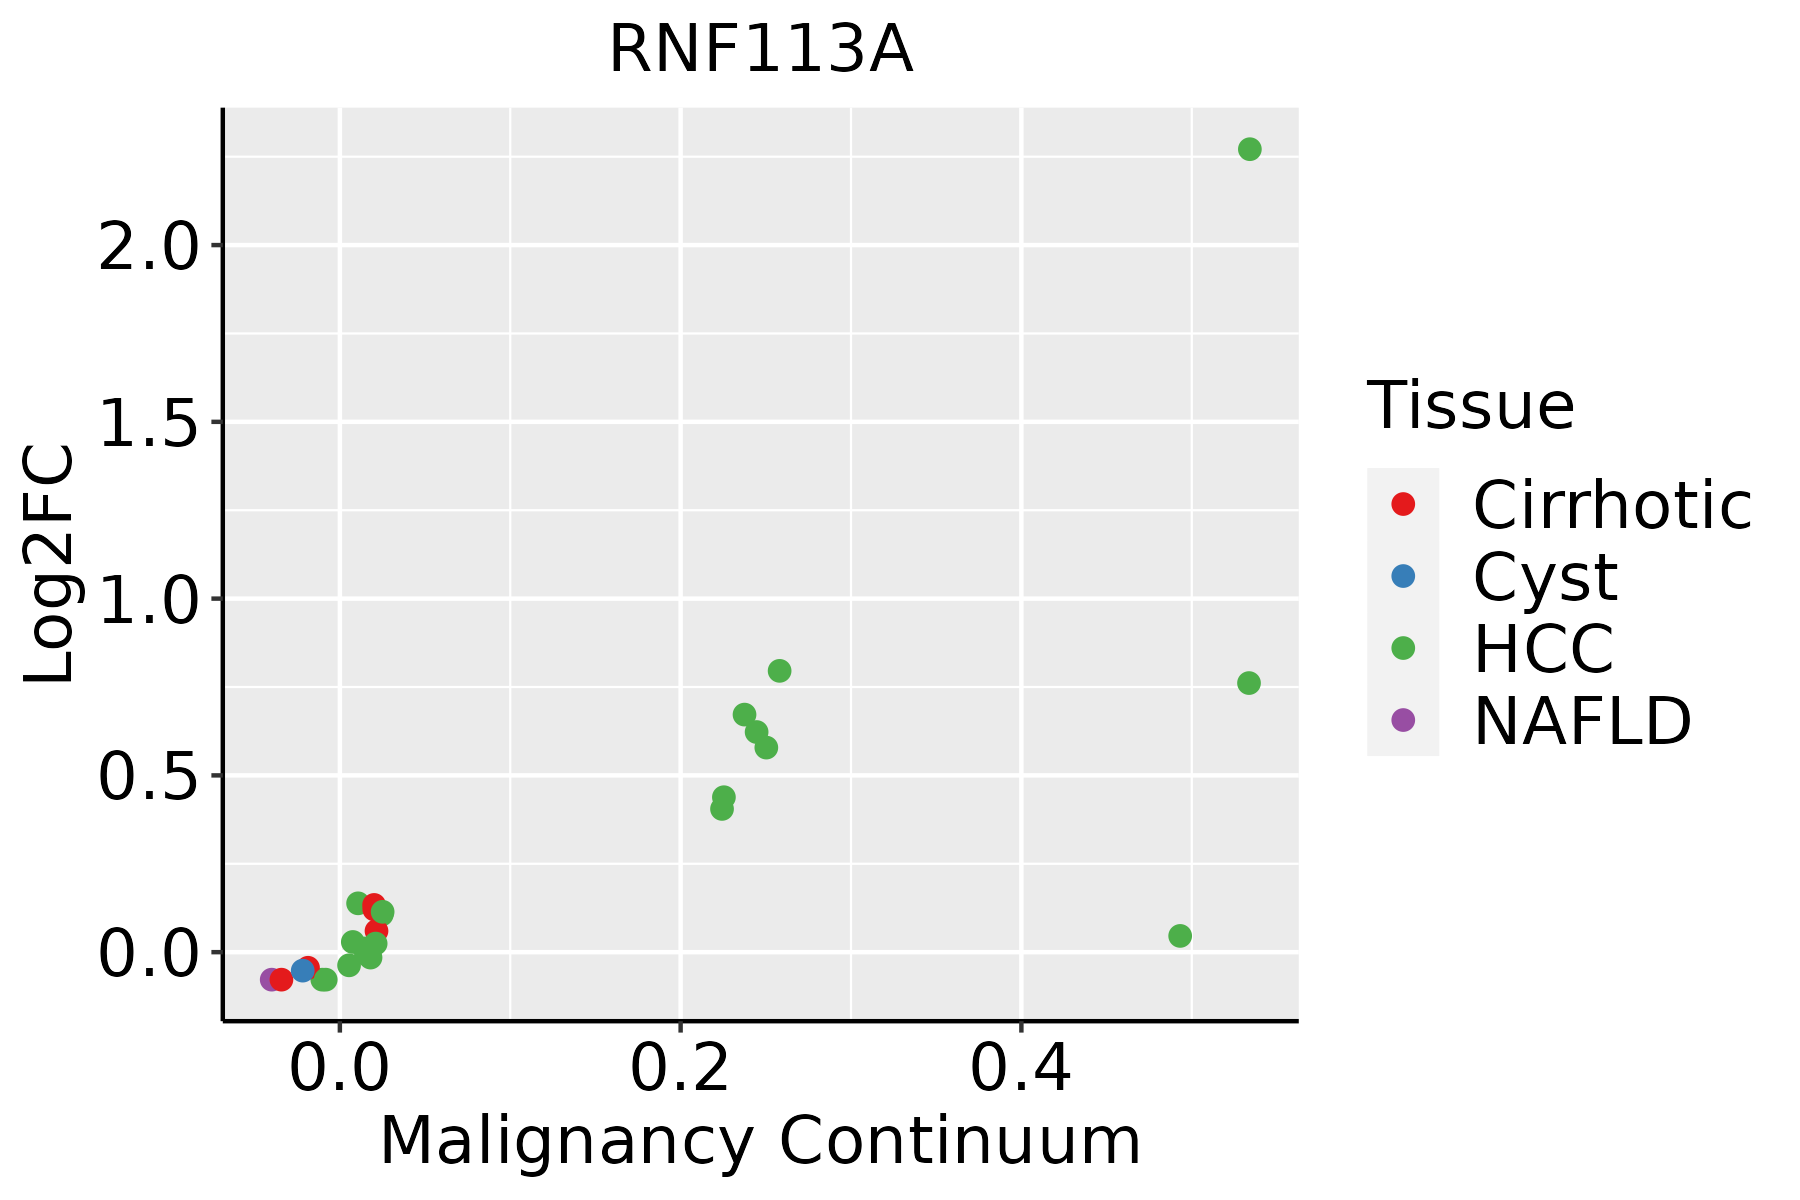 | HCC: Hepatocellular carcinoma |
| NAFLD: Non-alcoholic fatty liver disease | ||
| Oral Cavity | 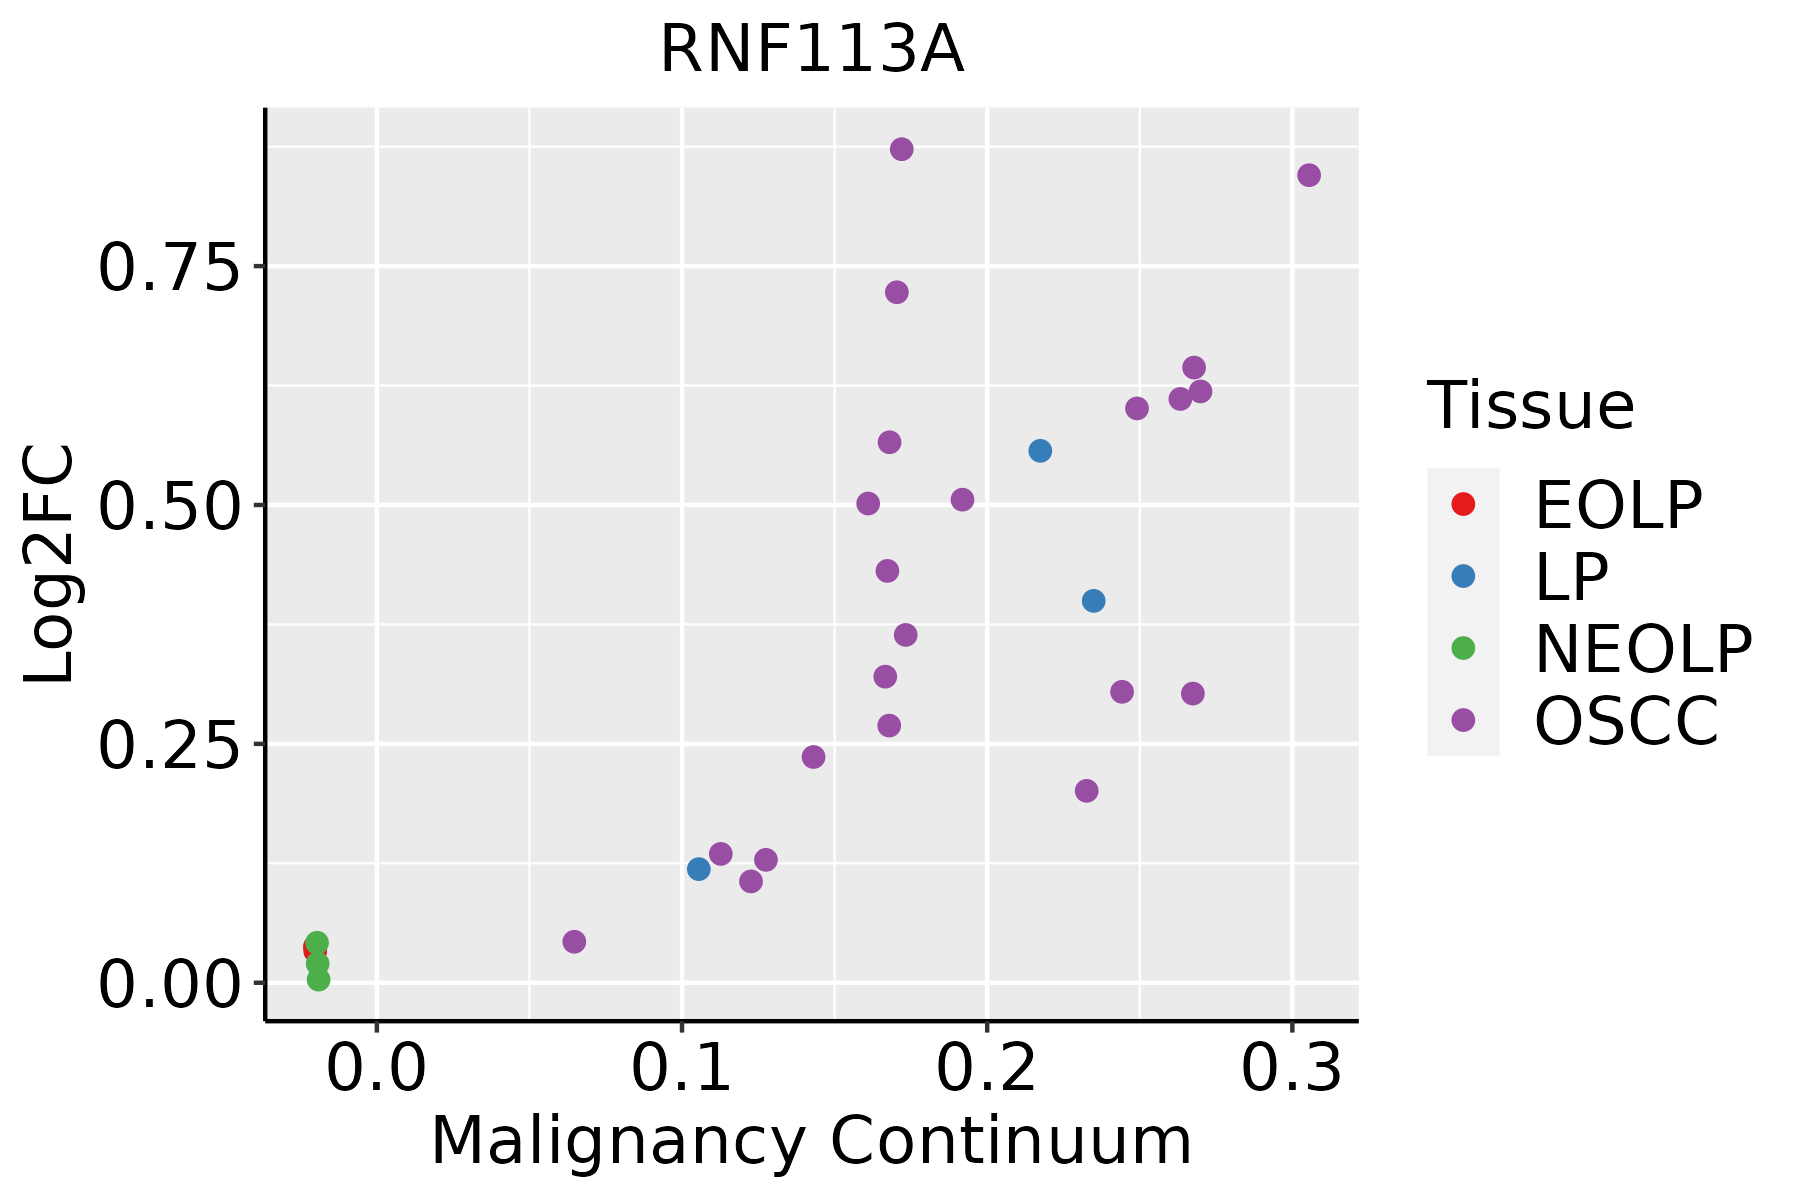 | EOLP: Erosive Oral lichen planus |
| LP: leukoplakia | ||
| NEOLP: Non-erosive oral lichen planus | ||
| OSCC: Oral squamous cell carcinoma |
| ∗log2FC in expression of this searched gene in stem-like cells from each diseased tissue sample relative to stem-like cells in normal samples in each tissue plotted against the malignancy continuum. Samples are colored based on if they are from different disease stage. |
Top |
Malignant transformation related pathway analysis |
| Find out the enriched GO biological processes and KEGG pathways involved in transition from healthy to precancer to cancer |
| Tissue | Disease Stage | Enriched GO biological Processes |
| Colorectum | AD |  |
| Colorectum | SER |  |
| Colorectum | MSS |  |
| Colorectum | MSI-H |  |
| Colorectum | FAP |  |
| ∗Top 15 enriched GO BP terms are showed in the bar plot of each disease state in each tissue. Each row represents a significant GO biological process which is colored according to the -log10(p.adjust). |
| Page: 1 2 3 4 5 6 7 8 9 |
| GO ID | Tissue | Disease Stage | Description | Gene Ratio | Bg Ratio | pvalue | p.adjust | Count |
| GO:0008380111 | Esophagus | ESCC | RNA splicing | 336/8552 | 434/18723 | 1.74e-42 | 3.67e-39 | 336 |
| GO:003447015 | Esophagus | ESCC | ncRNA processing | 300/8552 | 395/18723 | 3.09e-35 | 3.26e-32 | 300 |
| GO:003466012 | Esophagus | ESCC | ncRNA metabolic process | 346/8552 | 485/18723 | 4.35e-31 | 2.51e-28 | 346 |
| GO:0000375111 | Esophagus | ESCC | RNA splicing, via transesterification reactions | 248/8552 | 324/18723 | 3.05e-30 | 1.49e-27 | 248 |
| GO:0000377111 | Esophagus | ESCC | RNA splicing, via transesterification reactions with bulged adenosine as nucleophile | 244/8552 | 320/18723 | 2.52e-29 | 1.07e-26 | 244 |
| GO:0000398111 | Esophagus | ESCC | mRNA splicing, via spliceosome | 244/8552 | 320/18723 | 2.52e-29 | 1.07e-26 | 244 |
| GO:001820514 | Esophagus | ESCC | peptidyl-lysine modification | 259/8552 | 376/18723 | 3.90e-20 | 5.26e-18 | 259 |
| GO:00607595 | Esophagus | ESCC | regulation of response to cytokine stimulus | 103/8552 | 162/18723 | 3.14e-06 | 3.53e-05 | 103 |
| GO:00019595 | Esophagus | ESCC | regulation of cytokine-mediated signaling pathway | 95/8552 | 150/18723 | 9.48e-06 | 9.04e-05 | 95 |
| GO:000838012 | Liver | Cirrhotic | RNA splicing | 229/4634 | 434/18723 | 9.13e-37 | 2.86e-33 | 229 |
| GO:000037512 | Liver | Cirrhotic | RNA splicing, via transesterification reactions | 175/4634 | 324/18723 | 5.95e-30 | 7.47e-27 | 175 |
| GO:000037712 | Liver | Cirrhotic | RNA splicing, via transesterification reactions with bulged adenosine as nucleophile | 172/4634 | 320/18723 | 4.02e-29 | 3.60e-26 | 172 |
| GO:000039812 | Liver | Cirrhotic | mRNA splicing, via spliceosome | 172/4634 | 320/18723 | 4.02e-29 | 3.60e-26 | 172 |
| GO:00344701 | Liver | Cirrhotic | ncRNA processing | 158/4634 | 395/18723 | 1.09e-11 | 6.96e-10 | 158 |
| GO:00346603 | Liver | Cirrhotic | ncRNA metabolic process | 173/4634 | 485/18723 | 3.64e-08 | 1.21e-06 | 173 |
| GO:00182051 | Liver | Cirrhotic | peptidyl-lysine modification | 134/4634 | 376/18723 | 1.29e-06 | 2.59e-05 | 134 |
| GO:0016074 | Liver | Cirrhotic | sno(s)RNA metabolic process | 9/4634 | 16/18723 | 6.94e-03 | 3.38e-02 | 9 |
| GO:0043144 | Liver | Cirrhotic | sno(s)RNA processing | 8/4634 | 14/18723 | 9.65e-03 | 4.35e-02 | 8 |
| GO:00344702 | Liver | HCC | ncRNA processing | 293/7958 | 395/18723 | 4.26e-38 | 6.76e-35 | 293 |
| GO:000838022 | Liver | HCC | RNA splicing | 313/7958 | 434/18723 | 1.36e-36 | 1.73e-33 | 313 |
| Page: 1 2 3 |
| Pathway ID | Tissue | Disease Stage | Description | Gene Ratio | Bg Ratio | pvalue | p.adjust | qvalue | Count |
| Page: 1 |
Top |
Cell-cell communication analysis |
| Identification of potential cell-cell interactions between two cell types and their ligand-receptor pairs for different disease states |
| Ligand | Receptor | LRpair | Pathway | Tissue | Disease Stage |
| Page: 1 |
Top |
Single-cell gene regulatory network inference analysis |
| Find out the significant the regulons (TFs) and the target genes of each regulon across cell types for different disease states |
| TF | Cell Type | Tissue | Disease Stage | Target Gene | RSS | Regulon Activity |
| ∗The dot plots of a searched regulon are shown for all cell subpopulations in each disease state of each tissue based on the regulon specific score inferred using pySCENIC and by calculating the average expression. |
| Page: 1 |
Top |
Somatic mutation of malignant transformation related genes |
| Annotation of somatic variants for genes involved in malignant transformation |
| Hugo Symbol | Variant Class | Variant Classification | dbSNP RS | HGVSc | HGVSp | HGVSp Short | SWISSPROT | BIOTYPE | SIFT | PolyPhen | Tumor Sample Barcode | Tissue | Histology | Sex | Age | Stage | Therapy Types | Drugs | Outcome |
| RNF113A | SNV | Missense_Mutation | c.334N>C | p.Glu112Gln | p.E112Q | O15541 | protein_coding | tolerated(0.29) | possibly_damaging(0.685) | TCGA-AC-A23H-01 | Breast | breast invasive carcinoma | Female | >=65 | I/II | Unknown | Unknown | PD | |
| RNF113A | SNV | Missense_Mutation | c.201N>G | p.Ile67Met | p.I67M | O15541 | protein_coding | tolerated(0.08) | benign(0.045) | TCGA-AN-A0AK-01 | Breast | breast invasive carcinoma | Female | >=65 | I/II | Unknown | Unknown | SD | |
| RNF113A | SNV | Missense_Mutation | c.622A>G | p.Thr208Ala | p.T208A | O15541 | protein_coding | deleterious(0) | probably_damaging(0.999) | TCGA-AN-A0AM-01 | Breast | breast invasive carcinoma | Female | <65 | I/II | Unknown | Unknown | SD | |
| RNF113A | SNV | Missense_Mutation | c.385G>A | p.Asp129Asn | p.D129N | O15541 | protein_coding | deleterious(0.01) | possibly_damaging(0.808) | TCGA-BH-A0DZ-01 | Breast | breast invasive carcinoma | Female | <65 | I/II | Chemotherapy | docetaxel | SD | |
| RNF113A | SNV | Missense_Mutation | c.480N>T | p.Gln160His | p.Q160H | O15541 | protein_coding | tolerated(0.2) | benign(0.01) | TCGA-E2-A154-01 | Breast | breast invasive carcinoma | Female | >=65 | I/II | Hormone Therapy | arimidex | SD | |
| RNF113A | SNV | Missense_Mutation | c.383N>A | p.Arg128His | p.R128H | O15541 | protein_coding | tolerated(0.19) | benign(0.003) | TCGA-GM-A2DH-01 | Breast | breast invasive carcinoma | Female | <65 | I/II | Chemotherapy | taxol | CR | |
| RNF113A | insertion | In_Frame_Ins | novel | c.942_943insACAGGTGTGAGCCACCGAGCCCGGCTCCCTTGCTGTCTTGGAAGC | p.Ile314_Ala315insThrGlyValSerHisArgAlaArgLeuProCysCysLeuGlySer | p.I314_A315insTGVSHRARLPCCLGS | O15541 | protein_coding | TCGA-A8-A06P-01 | Breast | breast invasive carcinoma | Female | <65 | III/IV | Unspecific | SD | |||
| RNF113A | insertion | Frame_Shift_Ins | novel | c.823_824insGGATTTTTAGCCCTAGGATAACCATTTTGCCTGTGTTT | p.Thr275ArgfsTer52 | p.T275Rfs*52 | O15541 | protein_coding | TCGA-A8-A08H-01 | Breast | breast invasive carcinoma | Female | >=65 | I/II | Unknown | Unknown | SD | ||
| RNF113A | insertion | Nonsense_Mutation | novel | c.655_656insGTAGAGAAAGTGACAGAGCAGGCGGGTGGTGAAGTAGGGTCCTGGA | p.Phe219CysfsTer11 | p.F219Cfs*11 | O15541 | protein_coding | TCGA-BH-A0HF-01 | Breast | breast invasive carcinoma | Female | >=65 | I/II | Hormone Therapy | arimidex | SD | ||
| RNF113A | SNV | Missense_Mutation | novel | c.64N>T | p.Pro22Ser | p.P22S | O15541 | protein_coding | tolerated(0.74) | benign(0) | TCGA-2W-A8YY-01 | Cervix | cervical & endocervical cancer | Female | <65 | I/II | Chemotherapy | cisplatin | CR |
| Page: 1 2 3 4 5 6 7 |
Top |
Related drugs of malignant transformation related genes |
| Identification of chemicals and drugs interact with genes involved in malignant transfromation |
| (DGIdb 4.0) |
| Entrez ID | Symbol | Category | Interaction Types | Drug Claim Name | Drug Name | PMIDs |
| Page: 1 |

Copyright 2023-Present -The University of Texas Health Science Center at Houston |