Schematic overview of the cellular and molecular mechanisms involved in the cancer progression, including the proposed cellular and molecular mechanisms in cancer cells trajectory. AT1: alveolar type 1 cells; AT2: alveolar type 2 cells; AAH: atypical adenomatous hyperplasia; AIS: adenocarcinoma in situ; MIA: minimally invasive adenocarcinoma; IA: invasive adenocarcinoma; EMT: epithelial-mesenchymal transition

Home

Download

Statistics

Help

Contact

Center for Computational Systems Medicine
leaf

Gene summary

leaf

Malignant transformation analysis

leaf

Malignant transformation related pathway analysis

leaf

Cell-cell communication analysis

leaf

Single-cell gene regulatory network inference analysis

leaf

Somatic mutation of malignant transformation related genes

leaf

Related drugs of malignant transformation related genes

Gene: RNF11

Gene summary for RNF11

check button Gene summary.

Gene informationSpeciesHuman
Gene symbol

RNF11

Gene ID

26994

Gene namering finger protein 11
Gene AliasCGI-123
Cytomap1p32.3
Gene Typeprotein-coding
GO ID

GO:0006464

UniProtAcc

Q9Y3C5


Top

Malignant transformation analysis

check button Identification of the aberrant gene expression in precancerous and cancerous lesions by comparing the gene expression of stem-like cells in diseased tissues with normal stem cells
check button Malignant transformation involving gene list.
Entrez IDSymbolReplicatesSpeciesOrganTissueAdj P-valueLog2FCMalignancy
26994RNF11LZE4THumanEsophagusESCC1.38e-075.51e-020.0811
26994RNF11LZE5THumanEsophagusESCC1.41e-021.85e-010.0514
26994RNF11LZE7THumanEsophagusESCC5.24e-05-9.32e-020.0667
26994RNF11LZE8THumanEsophagusESCC1.27e-03-2.21e-010.067
26994RNF11LZE22D1HumanEsophagusHGIN1.52e-04-5.07e-020.0595
26994RNF11LZE24THumanEsophagusESCC8.02e-188.69e-010.0596
26994RNF11P2T-EHumanEsophagusESCC5.76e-478.60e-010.1177
26994RNF11P4T-EHumanEsophagusESCC4.10e-113.69e-010.1323
26994RNF11P5T-EHumanEsophagusESCC5.55e-173.19e-010.1327
26994RNF11P8T-EHumanEsophagusESCC5.82e-224.94e-010.0889
26994RNF11P9T-EHumanEsophagusESCC5.69e-112.40e-010.1131
26994RNF11P10T-EHumanEsophagusESCC7.88e-357.65e-010.116
26994RNF11P11T-EHumanEsophagusESCC3.26e-075.97e-010.1426
26994RNF11P12T-EHumanEsophagusESCC7.01e-205.93e-010.1122
26994RNF11P15T-EHumanEsophagusESCC1.07e-216.80e-010.1149
26994RNF11P16T-EHumanEsophagusESCC3.34e-182.01e-010.1153
26994RNF11P17T-EHumanEsophagusESCC7.30e-076.32e-010.1278
26994RNF11P19T-EHumanEsophagusESCC7.13e-081.04e+000.1662
26994RNF11P20T-EHumanEsophagusESCC1.60e-207.24e-010.1124
26994RNF11P21T-EHumanEsophagusESCC1.87e-368.32e-010.1617
Page: 1 2 3 4 5 6 7 

check button Transcriptomic changes along malignancy continuum.
TissueExpression DynamicsAbbreviation
EsophagusThe image shows the transcriptomic changes along malignancy continuum.log2FC in expression of this searched gene in stem-like cells from each diseased tissue sample relative to stem-like cells in normal samples in each tissue plotted against the malignancy continuum. Samples are colored based on if they are from different disease stage.
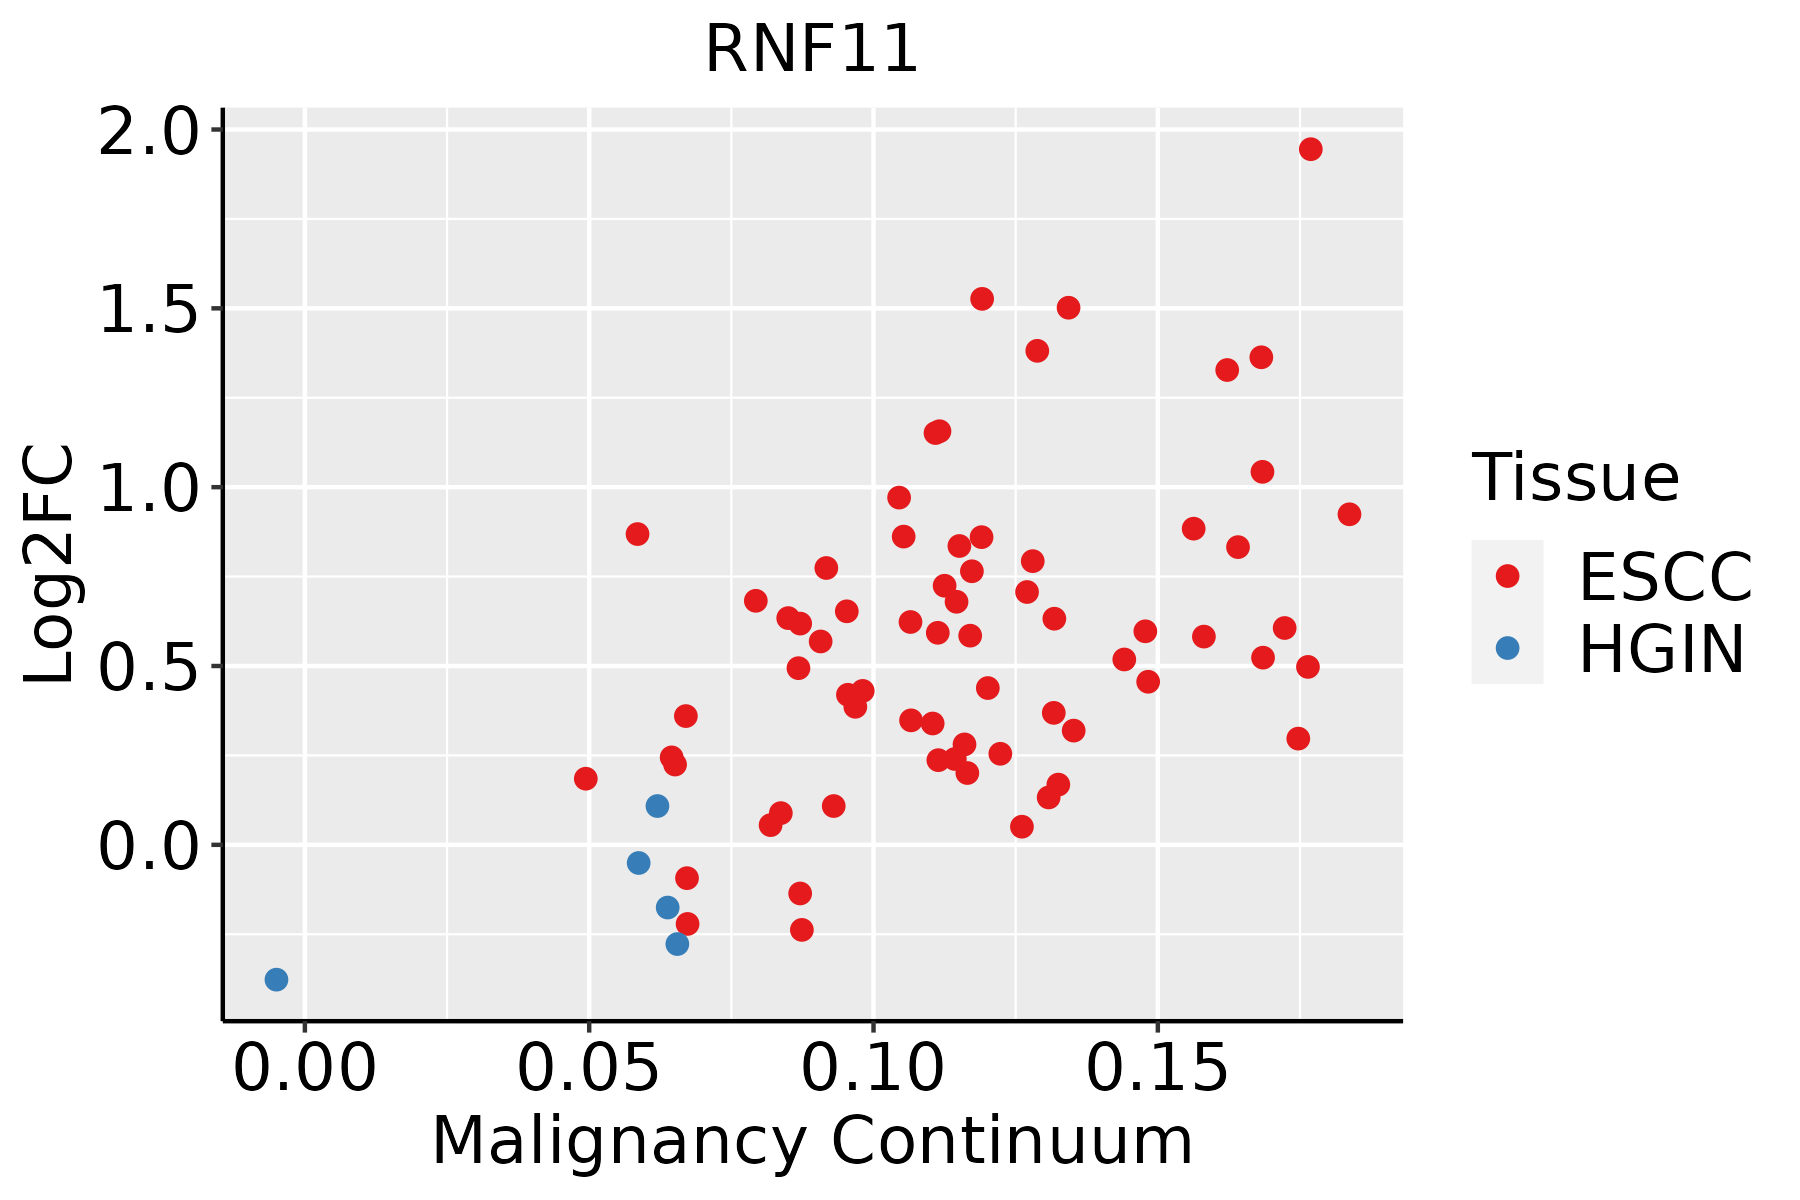
ESCC: Esophageal squamous cell carcinoma
HGIN: High-grade intraepithelial neoplasias
LGIN: Low-grade intraepithelial neoplasias
LiverThe image shows the transcriptomic changes along malignancy continuum.log2FC in expression of this searched gene in stem-like cells from each diseased tissue sample relative to stem-like cells in normal samples in each tissue plotted against the malignancy continuum. Samples are colored based on if they are from different disease stage.
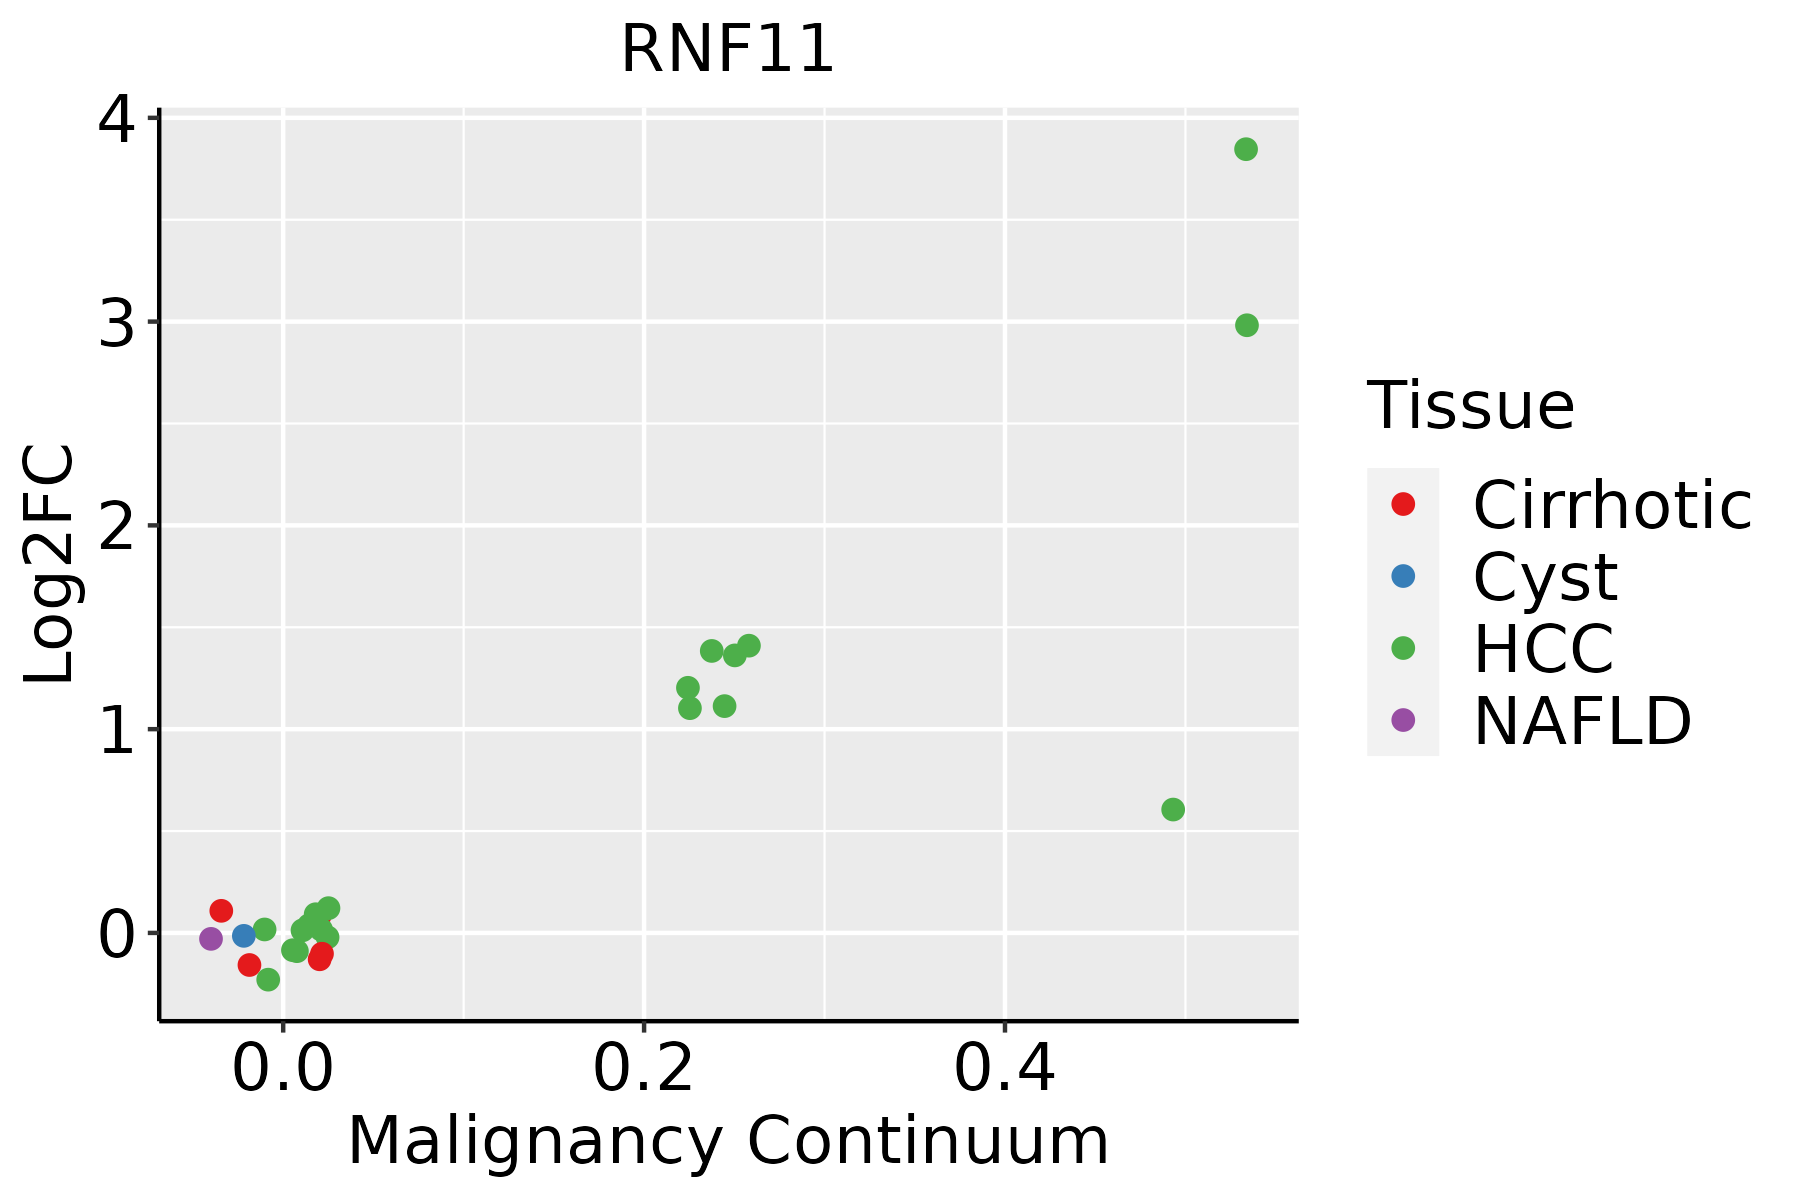
HCC: Hepatocellular carcinoma
NAFLD: Non-alcoholic fatty liver disease
Oral CavityThe image shows the transcriptomic changes along malignancy continuum.log2FC in expression of this searched gene in stem-like cells from each diseased tissue sample relative to stem-like cells in normal samples in each tissue plotted against the malignancy continuum. Samples are colored based on if they are from different disease stage.
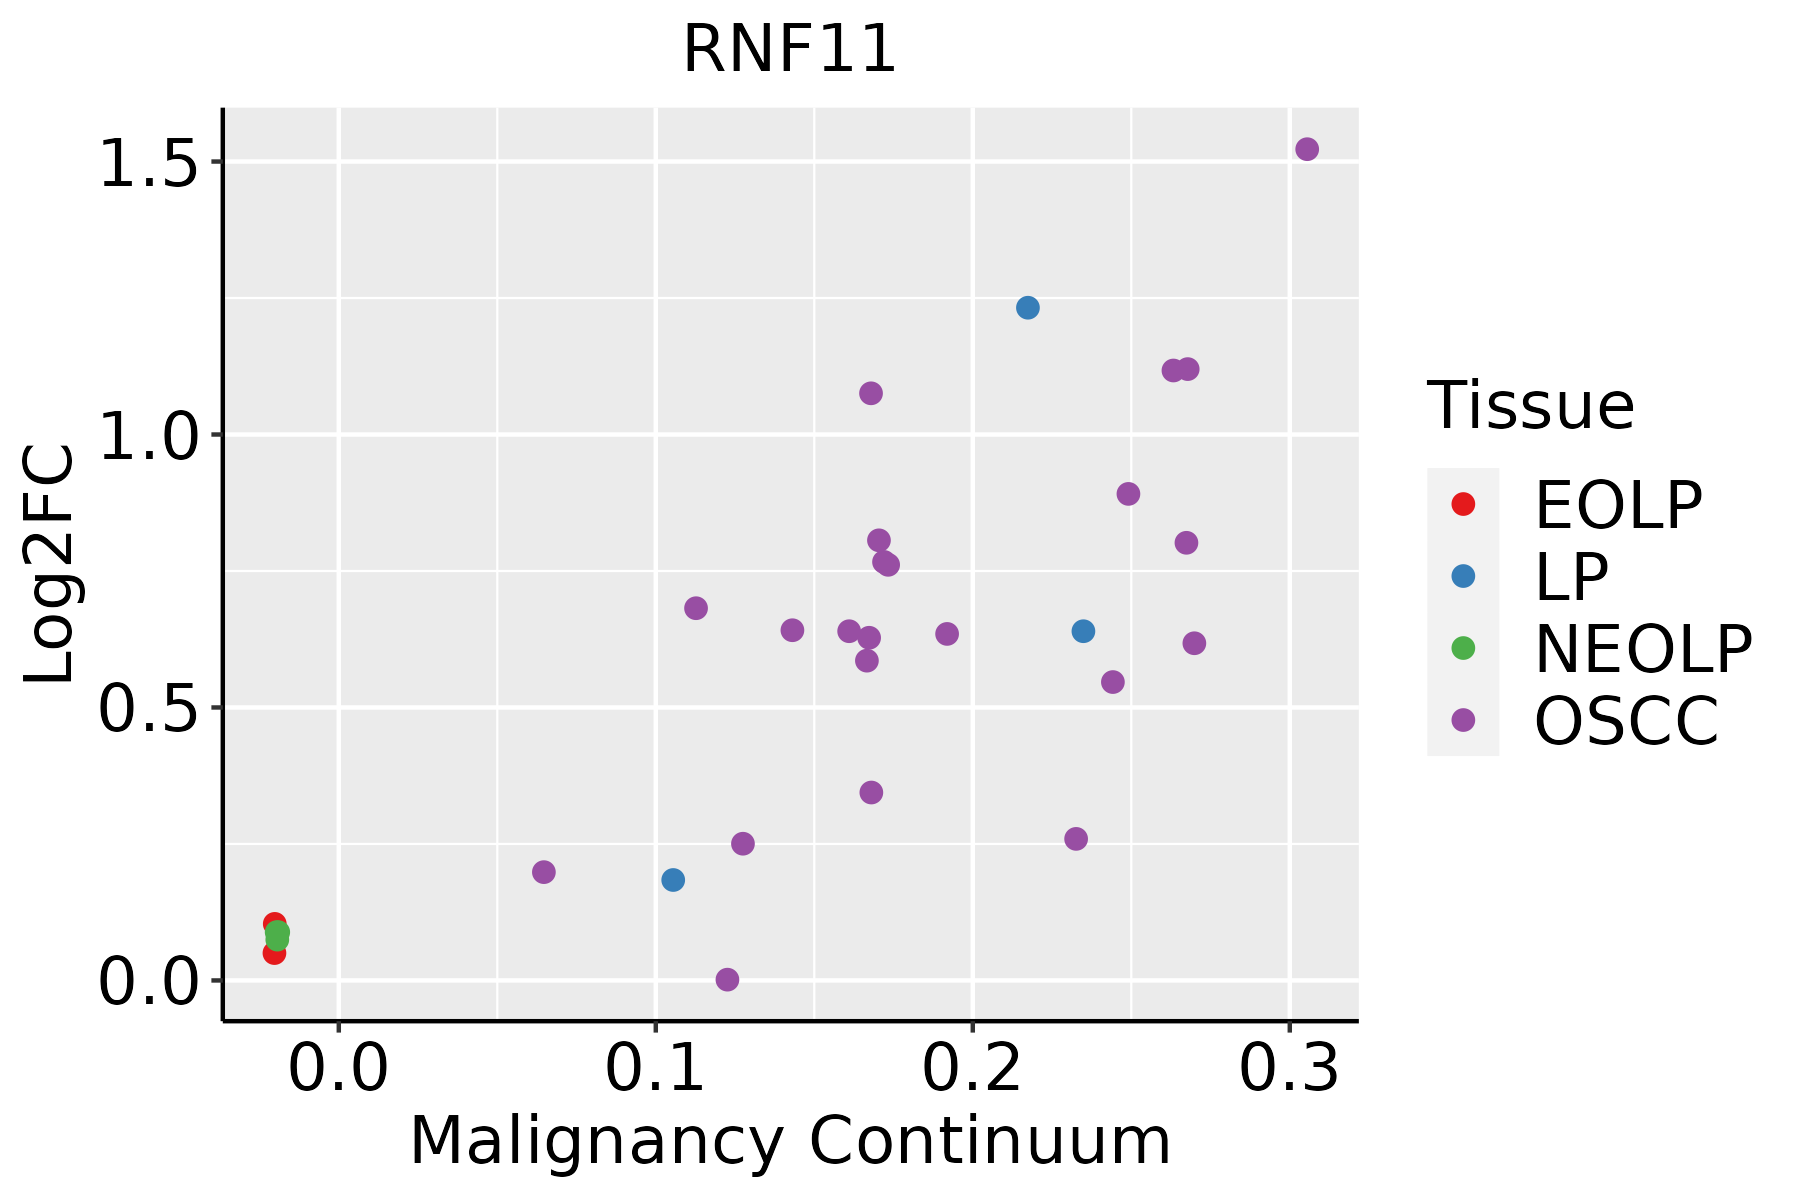
EOLP: Erosive Oral lichen planus
LP: leukoplakia
NEOLP: Non-erosive oral lichen planus
OSCC: Oral squamous cell carcinoma
SkinThe image shows the transcriptomic changes along malignancy continuum.log2FC in expression of this searched gene in stem-like cells from each diseased tissue sample relative to stem-like cells in normal samples in each tissue plotted against the malignancy continuum. Samples are colored based on if they are from different disease stage.
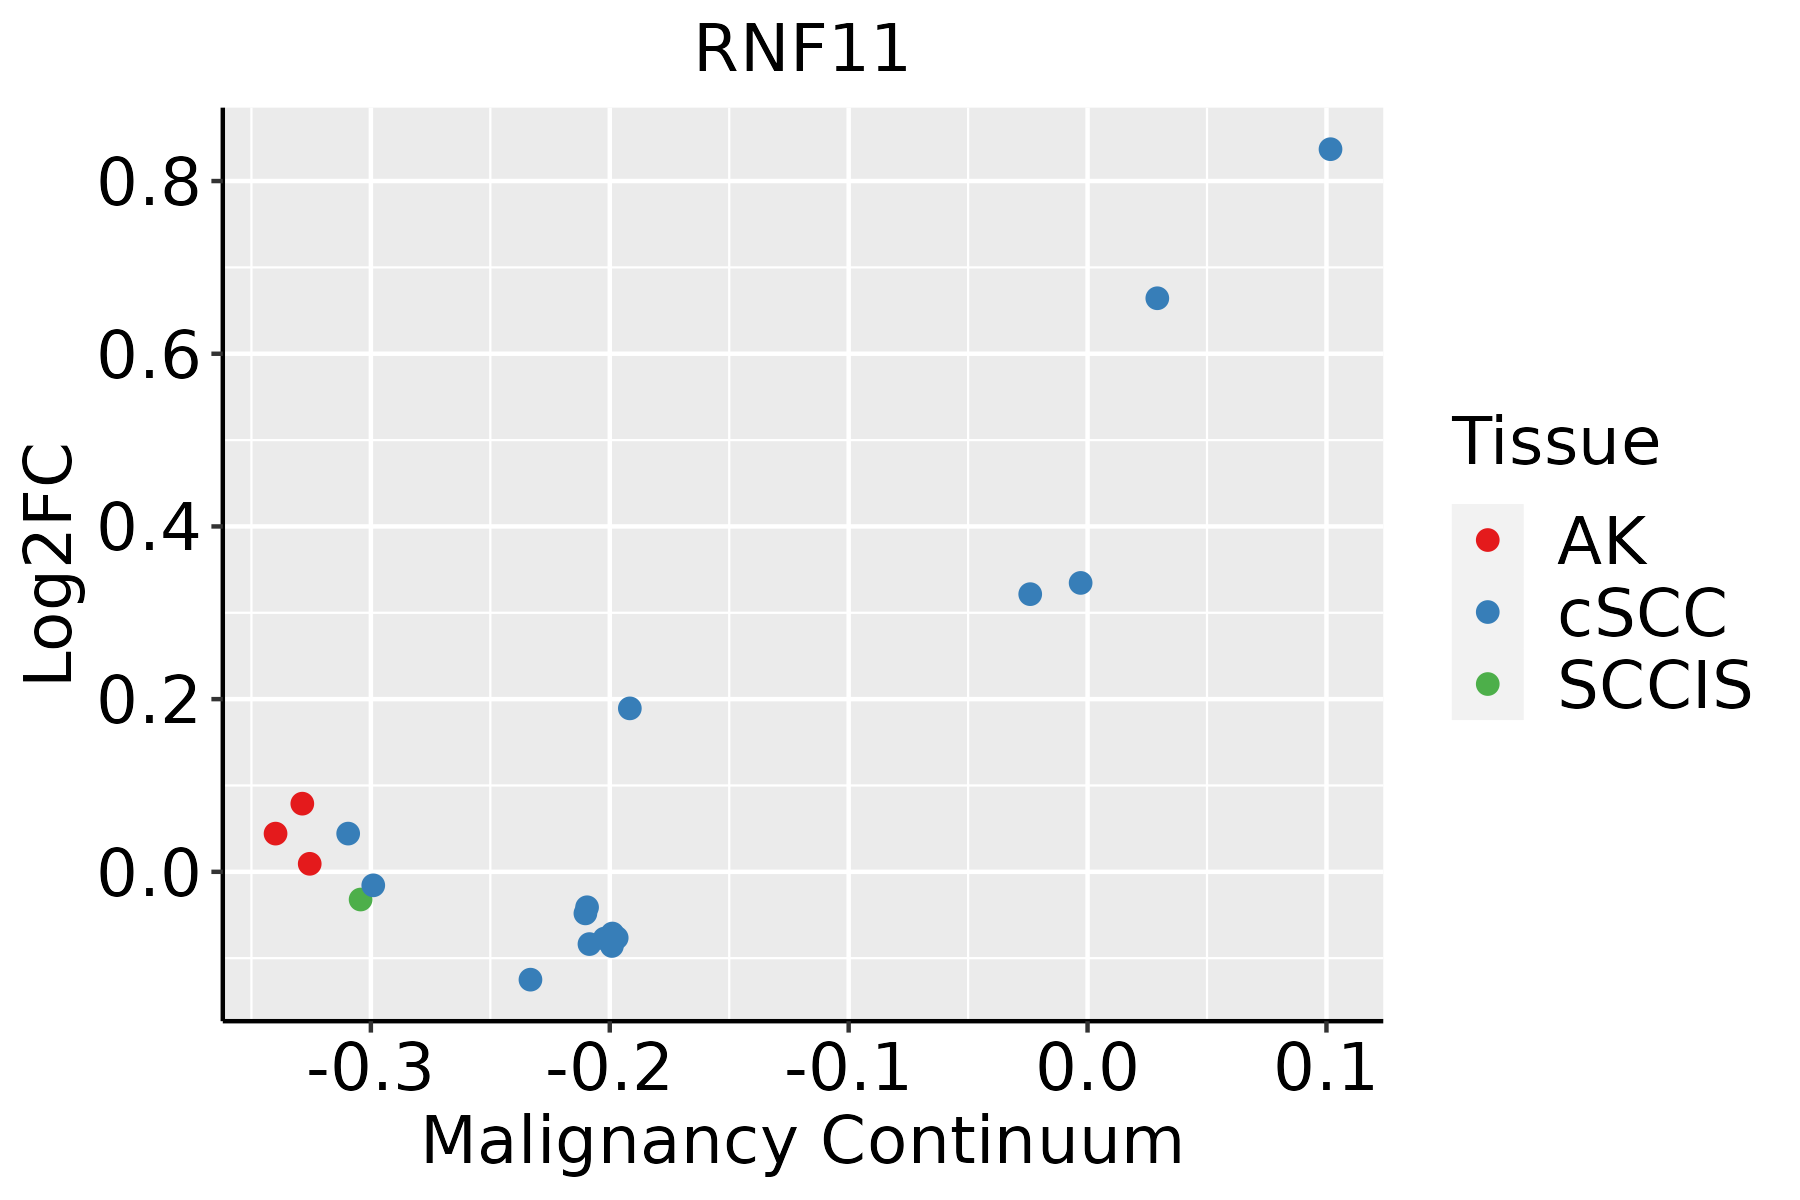
AK: Actinic keratosis
cSCC: Cutaneous squamous cell carcinoma
SCCIS:squamous cell carcinoma in situ
ThyroidThe image shows the transcriptomic changes along malignancy continuum.log2FC in expression of this searched gene in stem-like cells from each diseased tissue sample relative to stem-like cells in normal samples in each tissue plotted against the malignancy continuum. Samples are colored based on if they are from different disease stage.ATC: Anaplastic thyroid cancer
HT: Hashimoto's thyroiditis
PTC: Papillary thyroid cancer
∗log2FC in expression of this searched gene in stem-like cells from each diseased tissue sample relative to stem-like cells in normal samples in each tissue plotted against the malignancy continuum. Samples are colored based on if they are from different disease stage.

Top

Malignant transformation related pathway analysis

check buttonFind out the enriched GO biological processes and KEGG pathways involved in transition from healthy to precancer to cancer
check button Figure of enriched GO biological processes.
TissueDisease StageEnriched GO biological Processes
ColorectumADGO analysis - Figure of enriched GO biological processes: Top 15 enriched GO BP terms are showed in the bar plot of each disease state in each tissue. Each row represents a significant GO biological process which is colored according to the -log10(p.adjust).
ColorectumSERGO analysis - Figure of enriched GO biological processes: Top 15 enriched GO BP terms are showed in the bar plot of each disease state in each tissue. Each row represents a significant GO biological process which is colored according to the -log10(p.adjust).
ColorectumMSSGO analysis - Figure of enriched GO biological processes: Top 15 enriched GO BP terms are showed in the bar plot of each disease state in each tissue. Each row represents a significant GO biological process which is colored according to the -log10(p.adjust).
ColorectumMSI-HGO analysis - Figure of enriched GO biological processes: Top 15 enriched GO BP terms are showed in the bar plot of each disease state in each tissue. Each row represents a significant GO biological process which is colored according to the -log10(p.adjust).
ColorectumFAPGO analysis - Figure of enriched GO biological processes: Top 15 enriched GO BP terms are showed in the bar plot of each disease state in each tissue. Each row represents a significant GO biological process which is colored according to the -log10(p.adjust).
∗Top 15 enriched GO BP terms are showed in the bar plot of each disease state in each tissue. Each row represents a significant GO biological process which is colored according to the -log10(p.adjust).
Page: 1 2 3 4 5 6 7 8 9 

check button Enriched GO biological processes.
GO IDTissueDisease StageDescriptionGene RatioBg Ratiopvaluep.adjustCount
GO:190332010CervixCCregulation of protein modification by small protein conjugation or removal66/2311242/187232.31e-103.46e-0866
GO:003139610CervixCCregulation of protein ubiquitination59/2311210/187235.90e-107.51e-0859
GO:00071738CervixCCepidermal growth factor receptor signaling pathway36/2311108/187231.04e-088.44e-0736
GO:00381278CervixCCERBB signaling pathway37/2311121/187238.57e-084.88e-0637
GO:00002097CervixCCprotein polyubiquitination58/2311236/187231.57e-077.41e-0658
GO:00709366CervixCCprotein K48-linked ubiquitination22/231165/187235.56e-061.38e-0422
GO:00420586CervixCCregulation of epidermal growth factor receptor signaling pathway21/231173/187231.36e-041.67e-0321
GO:19011846CervixCCregulation of ERBB signaling pathway22/231179/187231.61e-041.93e-0322
GO:00071786CervixCCtransmembrane receptor protein serine/threonine kinase signaling pathway67/2311355/187232.39e-042.67e-0367
GO:00715595CervixCCresponse to transforming growth factor beta50/2311256/187236.31e-045.91e-0350
GO:00715605CervixCCcellular response to transforming growth factor beta stimulus49/2311250/187236.55e-046.05e-0349
GO:00071795CervixCCtransforming growth factor beta receptor signaling pathway38/2311198/187233.62e-032.31e-0238
GO:19011857CervixCCnegative regulation of ERBB signaling pathway10/231132/187233.96e-032.48e-0210
GO:00420597CervixCCnegative regulation of epidermal growth factor receptor signaling pathway9/231128/187235.02e-032.98e-029
GO:00313983CervixCCpositive regulation of protein ubiquitination25/2311119/187235.09e-033.01e-0225
GO:19033224CervixCCpositive regulation of protein modification by small protein conjugation or removal28/2311138/187235.26e-033.08e-0228
GO:00518656CervixCCprotein autoubiquitination17/231173/187236.71e-033.70e-0217
GO:00705343CervixCCprotein K63-linked ubiquitination14/231156/187236.93e-033.74e-0214
GO:1903320ColorectumADregulation of protein modification by small protein conjugation or removal86/3918242/187239.43e-084.65e-0686
GO:0031396ColorectumADregulation of protein ubiquitination72/3918210/187234.50e-061.21e-0472
Page: 1 2 3 4 5 6 7 8 9 10 11 12 13 14 15 

check button Enriched KEGG pathways.
Pathway IDTissueDisease StageDescriptionGene RatioBg Ratiopvaluep.adjustqvalueCount
Page: 1 

Top

Cell-cell communication analysis

check buttonIdentification of potential cell-cell interactions between two cell types and their ligand-receptor pairs for different disease states
LigandReceptorLRpairPathwayTissueDisease Stage
Page: 1 

Top

Single-cell gene regulatory network inference analysis

check buttonFind out the significant the regulons (TFs) and the target genes of each regulon across cell types for different disease states
TFCell TypeTissueDisease StageTarget GeneRSSRegulon Activity
∗The dot plots of a searched regulon are shown for all cell subpopulations in each disease state of each tissue based on the regulon specific score inferred using pySCENIC and by calculating the average expression.
Page: 1 

Top

Somatic mutation of malignant transformation related genes

check buttonAnnotation of somatic variants for genes involved in malignant transformation
Hugo SymbolVariant ClassVariant ClassificationdbSNP RSHGVScHGVSpHGVSp ShortSWISSPROTBIOTYPESIFTPolyPhenTumor Sample BarcodeTissueHistologySexAgeStageTherapy TypesDrugsOutcome
RNF11insertionNonsense_Mutationnovelc.228_229insTACTCAGGAGGCTGAGGTTGGAGGATTGCTTGAGCCCAGGGGGTTGp.Ile77TyrfsTer5p.I77Yfs*5Q9Y3C5protein_codingTCGA-A8-A07J-01Breastbreast invasive carcinomaFemale<65I/IIChemotherapy5-fluorouracilCR
RNF11SNVMissense_Mutationc.218N>Tp.Arg73Ilep.R73IQ9Y3C5protein_codingdeleterious(0.01)possibly_damaging(0.496)TCGA-AA-A010-01Colorectumcolon adenocarcinomaFemale<65I/IIChemotherapyfolinicCR
RNF11SNVMissense_Mutationrs866084029c.346C>Tp.Pro116Serp.P116SQ9Y3C5protein_codingdeleterious(0)probably_damaging(0.984)TCGA-G4-6304-01Colorectumcolon adenocarcinomaFemale>=65I/IIChemotherapyfluorouracilPD
RNF11SNVMissense_Mutationnovelc.372C>Ap.Asp124Glup.D124EQ9Y3C5protein_codingtolerated(0.52)benign(0.012)TCGA-AP-A051-01Endometriumuterine corpus endometrioid carcinomaFemale>=65I/IIUnknownUnknownSD
RNF11SNVMissense_Mutationc.218N>Tp.Arg73Ilep.R73IQ9Y3C5protein_codingdeleterious(0.01)possibly_damaging(0.496)TCGA-BS-A0UV-01Endometriumuterine corpus endometrioid carcinomaFemale<65III/IVUnknownUnknownSD
RNF11insertionFrame_Shift_Insnovelc.455_456insGAATTTGCAGp.Thr153AsnfsTer5p.T153Nfs*5Q9Y3C5protein_codingTCGA-BS-A0UJ-01Endometriumuterine corpus endometrioid carcinomaFemale>=65I/IIUnknownUnknownSD
RNF11SNVMissense_Mutationc.40N>Ap.Ser14Thrp.S14TQ9Y3C5protein_codingtolerated(0.17)possibly_damaging(0.715)TCGA-DD-A4NH-01Liverliver hepatocellular carcinomaFemale>=65III/IVTargeted Molecular therapysorafenibPD
RNF11SNVMissense_Mutationc.285N>Tp.Lys95Asnp.K95NQ9Y3C5protein_codingdeleterious(0.02)benign(0.254)TCGA-91-A4BC-01Lunglung adenocarcinomaMale<65I/IIUnknownUnknownSD
RNF11SNVMissense_Mutationnovelc.162C>Gp.Ser54Argp.S54RQ9Y3C5protein_codingtolerated(0.12)benign(0.255)TCGA-22-5481-01Lunglung squamous cell carcinomaFemale>=65I/IIUnknownUnknownPD
RNF11SNVMissense_Mutationnovelc.124G>Cp.Glu42Glnp.E42QQ9Y3C5protein_codingtolerated(0.12)benign(0.01)TCGA-CV-7242-01Oral cavityhead & neck squamous cell carcinomaFemale<65I/IIUnknownUnknownSD
Page: 1 2 

Top

Related drugs of malignant transformation related genes

check buttonIdentification of chemicals and drugs interact with genes involved in malignant transfromation
(DGIdb 4.0)
Entrez IDSymbolCategoryInteraction TypesDrug Claim NameDrug NamePMIDs
Page: 1