
|
|||||
|
 | |
| |
| |
| |
| |
| |
|
Gene: RNF103 |
Gene summary for RNF103 |
| Gene information | Species | Human | Gene symbol | RNF103 | Gene ID | 7844 |
| Gene name | ring finger protein 103 | |
| Gene Alias | HKF-1 | |
| Cytomap | 2p11.2 | |
| Gene Type | protein-coding | GO ID | GO:0006464 | UniProtAcc | O00237 |
Top |
Malignant transformation analysis |
| Identification of the aberrant gene expression in precancerous and cancerous lesions by comparing the gene expression of stem-like cells in diseased tissues with normal stem cells |
| Entrez ID | Symbol | Replicates | Species | Organ | Tissue | Adj P-value | Log2FC | Malignancy |
| 7844 | RNF103 | HCC1_Meng | Human | Liver | HCC | 3.97e-55 | 9.15e-03 | 0.0246 |
| 7844 | RNF103 | HCC2_Meng | Human | Liver | HCC | 4.91e-41 | 2.84e-01 | 0.0107 |
| 7844 | RNF103 | cirrhotic2 | Human | Liver | Cirrhotic | 1.82e-02 | 5.34e-02 | 0.0201 |
| 7844 | RNF103 | HCC1 | Human | Liver | HCC | 1.45e-02 | 2.72e+00 | 0.5336 |
| 7844 | RNF103 | HCC2 | Human | Liver | HCC | 6.53e-08 | 2.33e+00 | 0.5341 |
| 7844 | RNF103 | Pt13.b | Human | Liver | HCC | 1.41e-02 | -5.13e-02 | 0.0251 |
| 7844 | RNF103 | S015 | Human | Liver | HCC | 4.63e-02 | 2.85e-01 | 0.2375 |
| 7844 | RNF103 | S027 | Human | Liver | HCC | 4.30e-02 | 5.06e-01 | 0.2446 |
| 7844 | RNF103 | S028 | Human | Liver | HCC | 2.19e-06 | 4.76e-01 | 0.2503 |
| 7844 | RNF103 | S029 | Human | Liver | HCC | 3.04e-05 | 5.39e-01 | 0.2581 |
| Page: 1 |
| Tissue | Expression Dynamics | Abbreviation |
| Liver | 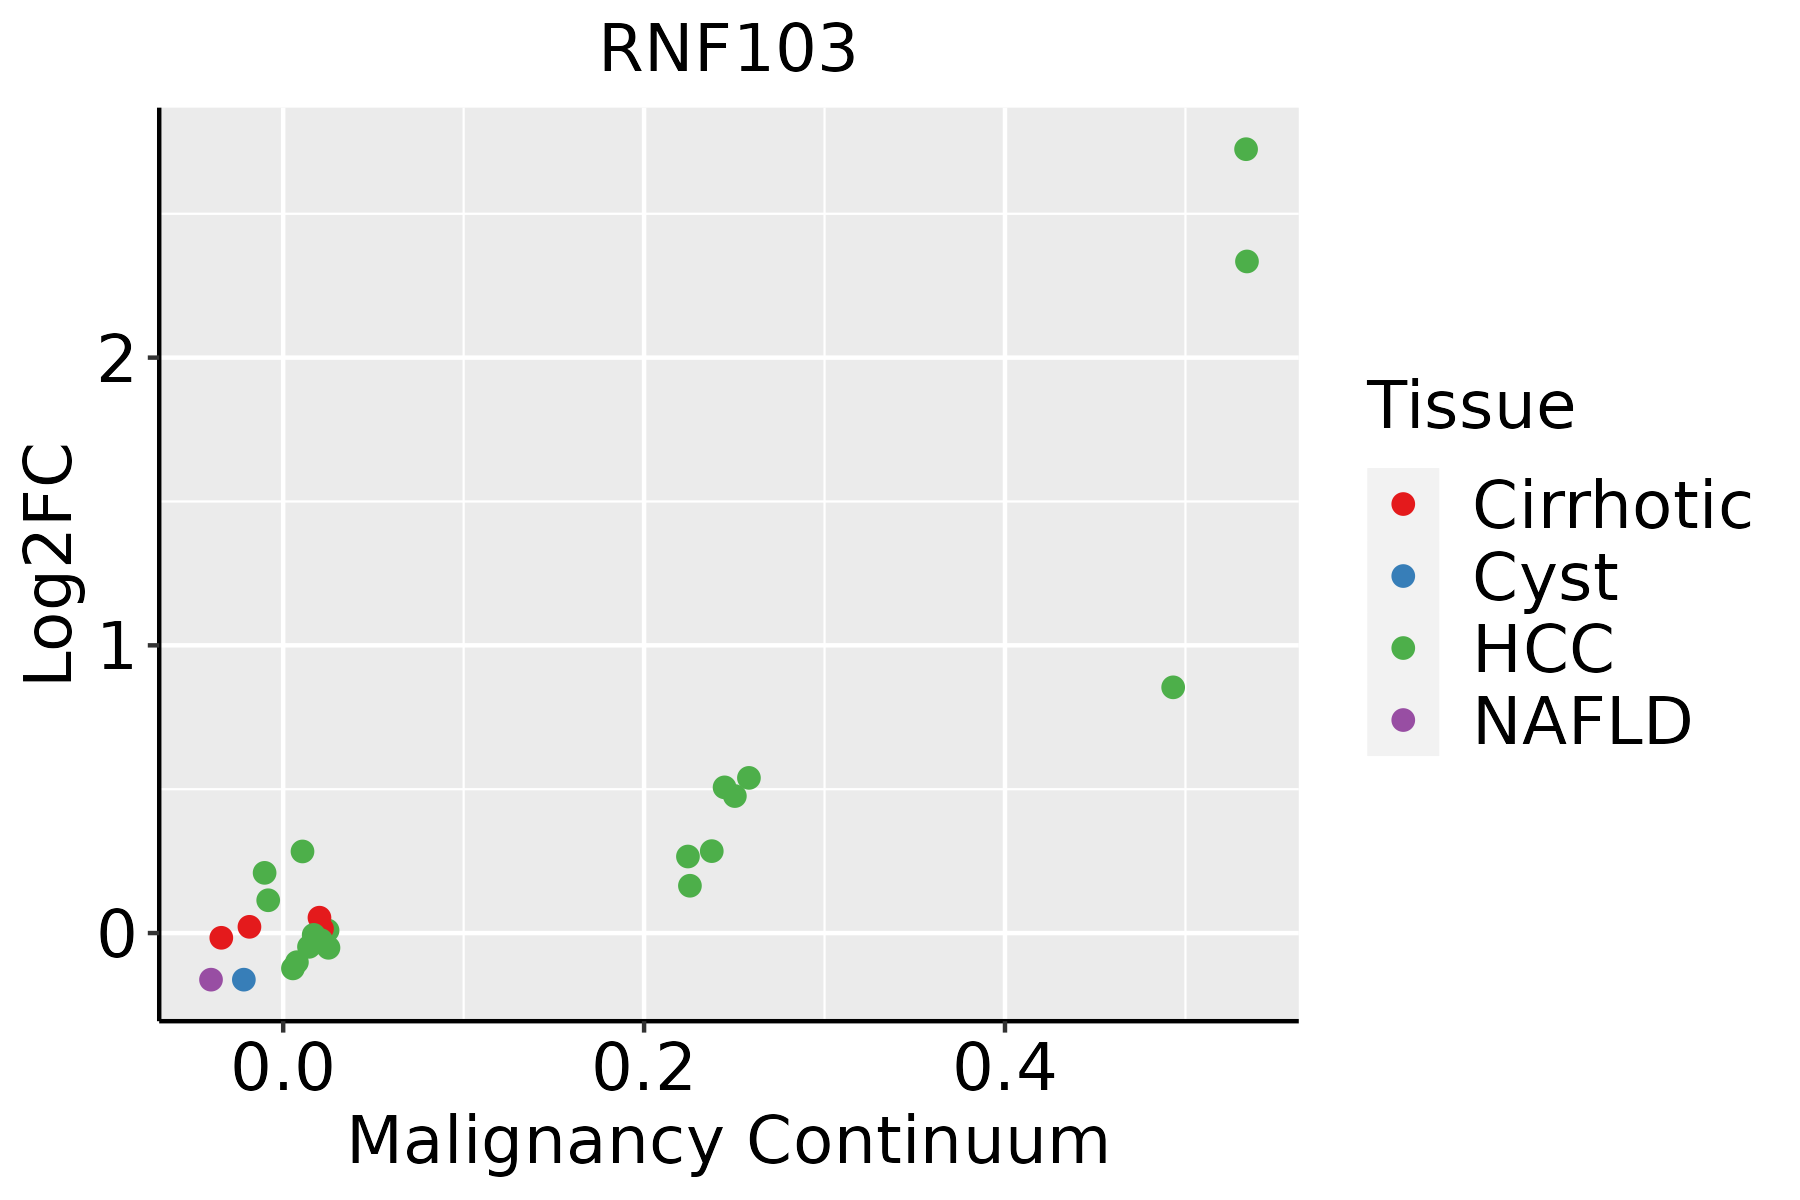 | HCC: Hepatocellular carcinoma |
| NAFLD: Non-alcoholic fatty liver disease | ||
| Prostate | 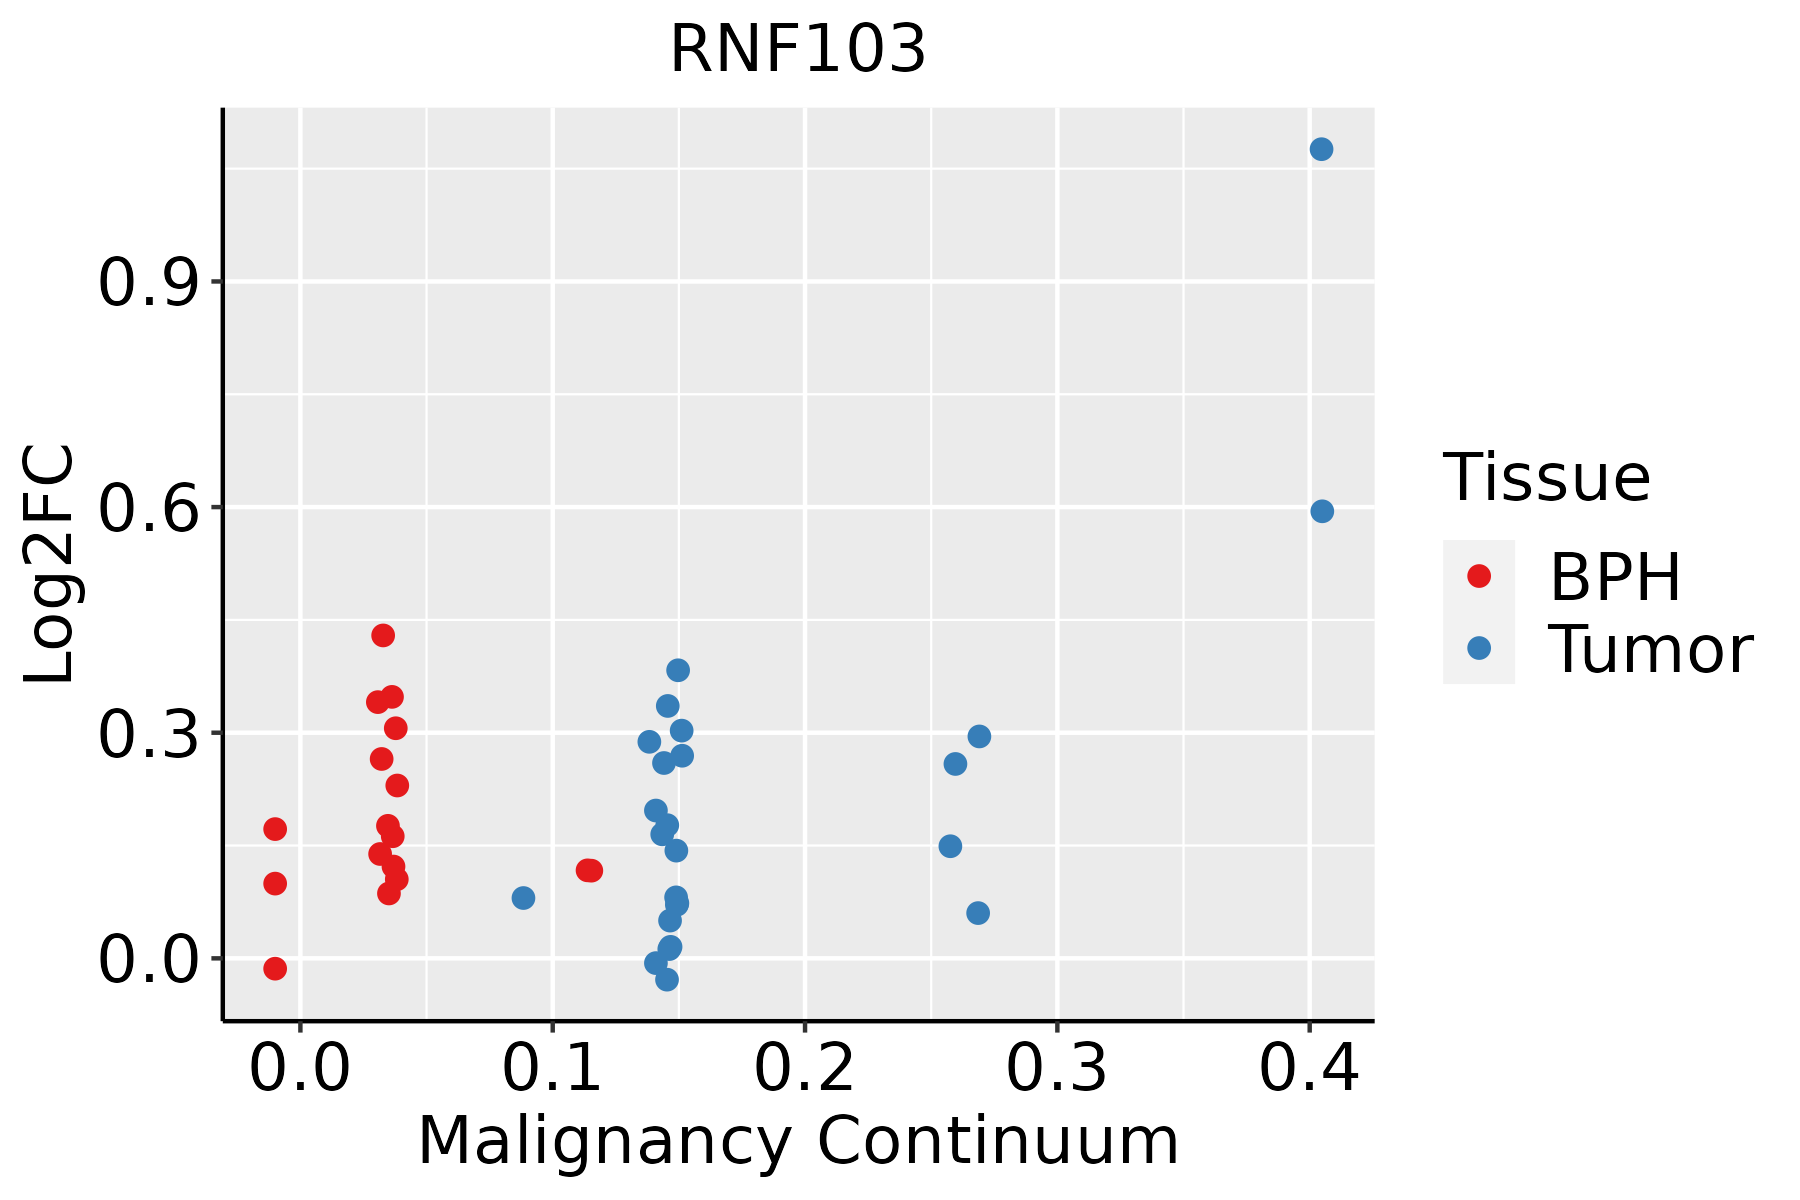 | BPH: Benign Prostatic Hyperplasia |
| ∗log2FC in expression of this searched gene in stem-like cells from each diseased tissue sample relative to stem-like cells in normal samples in each tissue plotted against the malignancy continuum. Samples are colored based on if they are from different disease stage. |
Top |
Malignant transformation related pathway analysis |
| Find out the enriched GO biological processes and KEGG pathways involved in transition from healthy to precancer to cancer |
| Tissue | Disease Stage | Enriched GO biological Processes |
| Colorectum | AD |  |
| Colorectum | SER |  |
| Colorectum | MSS |  |
| Colorectum | MSI-H |  |
| Colorectum | FAP |  |
| ∗Top 15 enriched GO BP terms are showed in the bar plot of each disease state in each tissue. Each row represents a significant GO biological process which is colored according to the -log10(p.adjust). |
| Page: 1 2 3 4 5 6 7 8 9 |
| GO ID | Tissue | Disease Stage | Description | Gene Ratio | Bg Ratio | pvalue | p.adjust | Count |
| GO:001049812 | Liver | Cirrhotic | proteasomal protein catabolic process | 216/4634 | 490/18723 | 2.52e-21 | 9.29e-19 | 216 |
| GO:00349767 | Liver | Cirrhotic | response to endoplasmic reticulum stress | 130/4634 | 256/18723 | 1.72e-19 | 3.86e-17 | 130 |
| GO:004316112 | Liver | Cirrhotic | proteasome-mediated ubiquitin-dependent protein catabolic process | 184/4634 | 412/18723 | 4.52e-19 | 8.85e-17 | 184 |
| GO:0030433 | Liver | Cirrhotic | ubiquitin-dependent ERAD pathway | 45/4634 | 85/18723 | 2.19e-08 | 7.75e-07 | 45 |
| GO:00365032 | Liver | Cirrhotic | ERAD pathway | 53/4634 | 107/18723 | 2.58e-08 | 8.89e-07 | 53 |
| GO:00065171 | Liver | Cirrhotic | protein deglycosylation | 14/4634 | 26/18723 | 1.37e-03 | 9.14e-03 | 14 |
| GO:00365071 | Liver | Cirrhotic | protein demannosylation | 10/4634 | 18/18723 | 5.00e-03 | 2.59e-02 | 10 |
| GO:00365081 | Liver | Cirrhotic | protein alpha-1,2-demannosylation | 10/4634 | 18/18723 | 5.00e-03 | 2.59e-02 | 10 |
| GO:001049822 | Liver | HCC | proteasomal protein catabolic process | 351/7958 | 490/18723 | 6.92e-40 | 1.46e-36 | 351 |
| GO:004316122 | Liver | HCC | proteasome-mediated ubiquitin-dependent protein catabolic process | 299/7958 | 412/18723 | 7.82e-36 | 8.27e-33 | 299 |
| GO:003497612 | Liver | HCC | response to endoplasmic reticulum stress | 189/7958 | 256/18723 | 1.43e-24 | 4.06e-22 | 189 |
| GO:003650311 | Liver | HCC | ERAD pathway | 88/7958 | 107/18723 | 2.87e-17 | 2.85e-15 | 88 |
| GO:00304331 | Liver | HCC | ubiquitin-dependent ERAD pathway | 72/7958 | 85/18723 | 9.78e-16 | 7.47e-14 | 72 |
| GO:00065172 | Liver | HCC | protein deglycosylation | 22/7958 | 26/18723 | 1.23e-05 | 1.39e-04 | 22 |
| GO:00365072 | Liver | HCC | protein demannosylation | 15/7958 | 18/18723 | 4.74e-04 | 3.12e-03 | 15 |
| GO:00365082 | Liver | HCC | protein alpha-1,2-demannosylation | 15/7958 | 18/18723 | 4.74e-04 | 3.12e-03 | 15 |
| GO:1904380 | Liver | HCC | endoplasmic reticulum mannose trimming | 13/7958 | 15/18723 | 5.67e-04 | 3.61e-03 | 13 |
| GO:0009100 | Liver | HCC | glycoprotein metabolic process | 193/7958 | 387/18723 | 1.89e-03 | 9.62e-03 | 193 |
| GO:001049818 | Prostate | BPH | proteasomal protein catabolic process | 153/3107 | 490/18723 | 4.13e-16 | 7.51e-14 | 153 |
| GO:003497618 | Prostate | BPH | response to endoplasmic reticulum stress | 95/3107 | 256/18723 | 1.54e-15 | 2.52e-13 | 95 |
| Page: 1 2 |
| Pathway ID | Tissue | Disease Stage | Description | Gene Ratio | Bg Ratio | pvalue | p.adjust | qvalue | Count |
| Page: 1 |
Top |
Cell-cell communication analysis |
| Identification of potential cell-cell interactions between two cell types and their ligand-receptor pairs for different disease states |
| Ligand | Receptor | LRpair | Pathway | Tissue | Disease Stage |
| Page: 1 |
Top |
Single-cell gene regulatory network inference analysis |
| Find out the significant the regulons (TFs) and the target genes of each regulon across cell types for different disease states |
| TF | Cell Type | Tissue | Disease Stage | Target Gene | RSS | Regulon Activity |
| ∗The dot plots of a searched regulon are shown for all cell subpopulations in each disease state of each tissue based on the regulon specific score inferred using pySCENIC and by calculating the average expression. |
| Page: 1 |
Top |
Somatic mutation of malignant transformation related genes |
| Annotation of somatic variants for genes involved in malignant transformation |
| Hugo Symbol | Variant Class | Variant Classification | dbSNP RS | HGVSc | HGVSp | HGVSp Short | SWISSPROT | BIOTYPE | SIFT | PolyPhen | Tumor Sample Barcode | Tissue | Histology | Sex | Age | Stage | Therapy Types | Drugs | Outcome |
| RNF103 | SNV | Missense_Mutation | novel | c.1838N>T | p.Ala613Val | p.A613V | O00237 | protein_coding | tolerated(0.32) | benign(0.001) | TCGA-A2-A0EM-01 | Breast | breast invasive carcinoma | Female | >=65 | I/II | Hormone Therapy | tamoxiphen | SD |
| RNF103 | SNV | Missense_Mutation | rs780637344 | c.280N>A | p.Glu94Lys | p.E94K | O00237 | protein_coding | tolerated(0.21) | benign(0.335) | TCGA-AN-A046-01 | Breast | breast invasive carcinoma | Female | >=65 | I/II | Unknown | Unknown | SD |
| RNF103 | SNV | Missense_Mutation | novel | c.1250N>T | p.Pro417Leu | p.P417L | O00237 | protein_coding | deleterious(0.01) | probably_damaging(0.997) | TCGA-C8-A8HP-01 | Breast | breast invasive carcinoma | Female | <65 | III/IV | Chemotherapy | 5-fluorouracil | CR |
| RNF103 | SNV | Missense_Mutation | rs778172142 | c.1330N>G | p.Asn444Asp | p.N444D | O00237 | protein_coding | tolerated(1) | benign(0) | TCGA-D8-A1J8-01 | Breast | breast invasive carcinoma | Female | >=65 | I/II | Hormone Therapy | nolvadex | SD |
| RNF103 | SNV | Missense_Mutation | novel | c.1309A>G | p.Lys437Glu | p.K437E | O00237 | protein_coding | deleterious(0.03) | probably_damaging(0.98) | TCGA-2W-A8YY-01 | Cervix | cervical & endocervical cancer | Female | <65 | I/II | Chemotherapy | cisplatin | CR |
| RNF103 | SNV | Missense_Mutation | rs143477816 | c.1616N>T | p.Ser539Leu | p.S539L | O00237 | protein_coding | tolerated(0.62) | benign(0.062) | TCGA-FU-A3HZ-01 | Cervix | cervical & endocervical cancer | Female | <65 | I/II | Chemotherapy | cisplatin | CR |
| RNF103 | SNV | Missense_Mutation | novel | c.1807N>C | p.Asp603His | p.D603H | O00237 | protein_coding | tolerated(0.05) | benign(0.406) | TCGA-JW-A5VL-01 | Cervix | cervical & endocervical cancer | Female | <65 | I/II | Unknown | Unknown | SD |
| RNF103 | SNV | Missense_Mutation | c.1474N>A | p.Arg492Ser | p.R492S | O00237 | protein_coding | deleterious(0.02) | possibly_damaging(0.758) | TCGA-A6-2686-01 | Colorectum | colon adenocarcinoma | Female | >=65 | I/II | Unknown | Unknown | SD | |
| RNF103 | SNV | Missense_Mutation | rs780637344 | c.280G>A | p.Glu94Lys | p.E94K | O00237 | protein_coding | tolerated(0.21) | benign(0.335) | TCGA-AA-3510-01 | Colorectum | colon adenocarcinoma | Male | >=65 | I/II | Unknown | Unknown | SD |
| RNF103 | SNV | Missense_Mutation | novel | c.1765N>A | p.Glu589Lys | p.E589K | O00237 | protein_coding | tolerated(0.74) | benign(0.012) | TCGA-AA-3684-01 | Colorectum | colon adenocarcinoma | Female | >=65 | III/IV | Unknown | Unknown | SD |
| Page: 1 2 3 4 5 6 7 8 |
Top |
Related drugs of malignant transformation related genes |
| Identification of chemicals and drugs interact with genes involved in malignant transfromation |
| (DGIdb 4.0) |
| Entrez ID | Symbol | Category | Interaction Types | Drug Claim Name | Drug Name | PMIDs |
| Page: 1 |

Copyright 2023-Present -The University of Texas Health Science Center at Houston |