Schematic overview of the cellular and molecular mechanisms involved in the cancer progression, including the proposed cellular and molecular mechanisms in cancer cells trajectory. AT1: alveolar type 1 cells; AT2: alveolar type 2 cells; AAH: atypical adenomatous hyperplasia; AIS: adenocarcinoma in situ; MIA: minimally invasive adenocarcinoma; IA: invasive adenocarcinoma; EMT: epithelial-mesenchymal transition

Home

Download

Statistics

Help

Contact

Center for Computational Systems Medicine
leaf

Gene summary

leaf

Malignant transformation analysis

leaf

Malignant transformation related pathway analysis

leaf

Cell-cell communication analysis

leaf

Single-cell gene regulatory network inference analysis

leaf

Somatic mutation of malignant transformation related genes

leaf

Related drugs of malignant transformation related genes

Gene: RNF10

Gene summary for RNF10

check button Gene summary.

Gene informationSpeciesHuman
Gene symbol

RNF10

Gene ID

9921

Gene namering finger protein 10
Gene AliasRIE2
Cytomap12q24.31
Gene Typeprotein-coding
GO ID

GO:0003008

UniProtAcc

Q8N5U6


Top

Malignant transformation analysis

check button Identification of the aberrant gene expression in precancerous and cancerous lesions by comparing the gene expression of stem-like cells in diseased tissues with normal stem cells
check button Malignant transformation involving gene list.
Entrez IDSymbolReplicatesSpeciesOrganTissueAdj P-valueLog2FCMalignancy
9921RNF10HTA11_347_2000001011HumanColorectumAD2.13e-023.57e-01-0.1954
9921RNF10HTA11_696_2000001011HumanColorectumAD5.29e-033.57e-01-0.1464
9921RNF10HTA11_1391_2000001011HumanColorectumAD9.24e-035.07e-01-0.059
9921RNF10HTA11_99999971662_82457HumanColorectumMSS4.12e-024.44e-010.3859
9921RNF10A015-C-203HumanColorectumFAP1.37e-15-2.62e-01-0.1294
9921RNF10A014-C-040HumanColorectumFAP4.05e-02-3.35e-01-0.1184
9921RNF10A002-C-201HumanColorectumFAP3.29e-09-2.15e-010.0324
9921RNF10A001-C-108HumanColorectumFAP1.67e-09-1.74e-01-0.0272
9921RNF10A002-C-205HumanColorectumFAP2.51e-11-2.16e-01-0.1236
9921RNF10A015-C-005HumanColorectumFAP2.82e-03-2.23e-01-0.0336
9921RNF10A015-C-006HumanColorectumFAP7.14e-10-2.83e-01-0.0994
9921RNF10A015-C-106HumanColorectumFAP2.93e-08-2.04e-01-0.0511
9921RNF10A002-C-114HumanColorectumFAP1.14e-10-2.50e-01-0.1561
9921RNF10A015-C-104HumanColorectumFAP2.64e-14-2.17e-01-0.1899
9921RNF10A001-C-014HumanColorectumFAP8.64e-06-1.55e-010.0135
9921RNF10A002-C-016HumanColorectumFAP1.71e-11-2.30e-010.0521
9921RNF10A015-C-002HumanColorectumFAP2.75e-06-2.58e-01-0.0763
9921RNF10A001-C-203HumanColorectumFAP3.40e-05-1.16e-01-0.0481
9921RNF10A002-C-116HumanColorectumFAP1.27e-15-2.36e-01-0.0452
9921RNF10A014-C-008HumanColorectumFAP1.02e-07-2.37e-01-0.191
Page: 1 2 3 4 5 6 7 8 

check button Transcriptomic changes along malignancy continuum.
TissueExpression DynamicsAbbreviation
Colorectum (GSE201348)The image shows the transcriptomic changes along malignancy continuum.log2FC in expression of this searched gene in stem-like cells from each diseased tissue sample relative to stem-like cells in normal samples in each tissue plotted against the malignancy continuum. Samples are colored based on if they are from different disease stage.FAP: Familial adenomatous polyposis
CRC: Colorectal cancer
Colorectum (HTA11)The image shows the transcriptomic changes along malignancy continuum.log2FC in expression of this searched gene in stem-like cells from each diseased tissue sample relative to stem-like cells in normal samples in each tissue plotted against the malignancy continuum. Samples are colored based on if they are from different disease stage.AD: Adenomas
SER: Sessile serrated lesions
MSI-H: Microsatellite-high colorectal cancer
MSS: Microsatellite stable colorectal cancer
EndometriumThe image shows the transcriptomic changes along malignancy continuum.log2FC in expression of this searched gene in stem-like cells from each diseased tissue sample relative to stem-like cells in normal samples in each tissue plotted against the malignancy continuum. Samples are colored based on if they are from different disease stage.
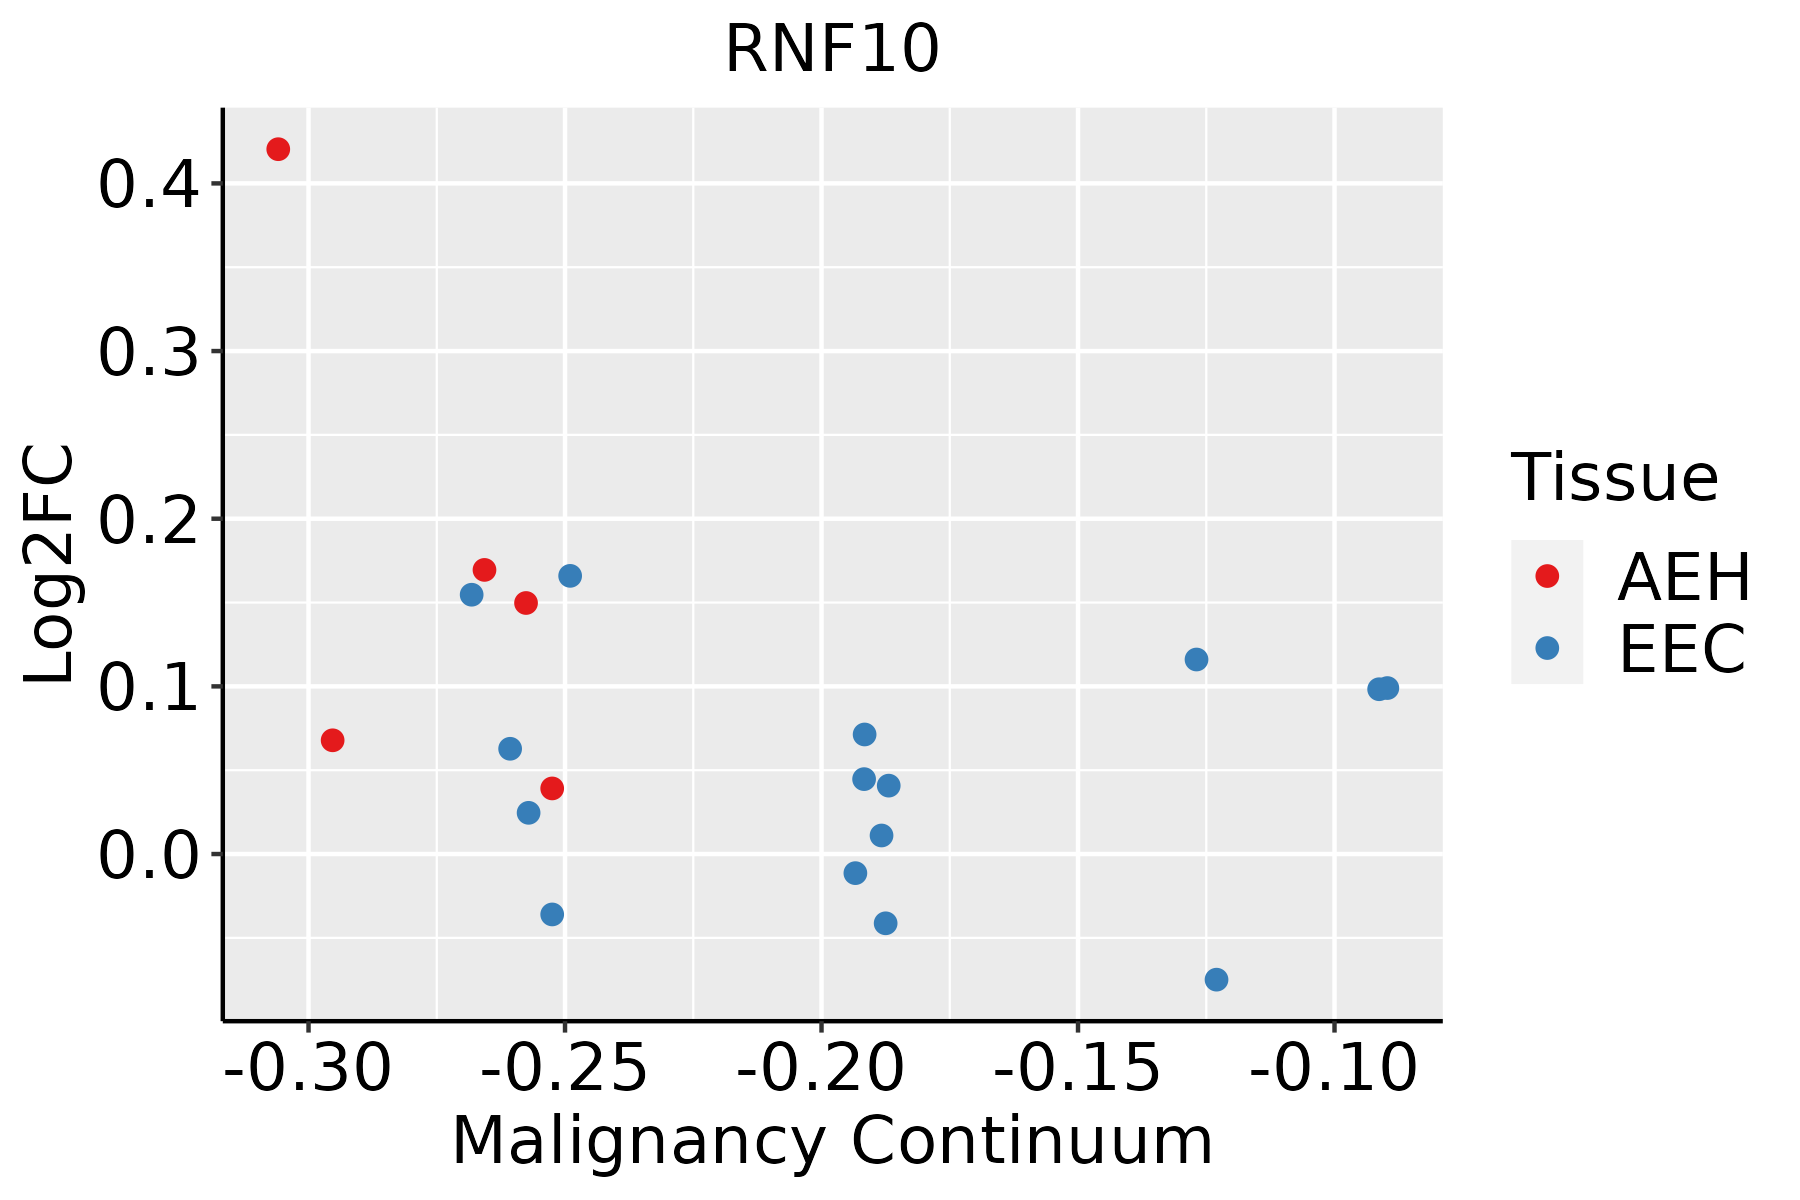
AEH: Atypical endometrial hyperplasia
EEC: Endometrioid Cancer
EsophagusThe image shows the transcriptomic changes along malignancy continuum.log2FC in expression of this searched gene in stem-like cells from each diseased tissue sample relative to stem-like cells in normal samples in each tissue plotted against the malignancy continuum. Samples are colored based on if they are from different disease stage.ESCC: Esophageal squamous cell carcinoma
HGIN: High-grade intraepithelial neoplasias
LGIN: Low-grade intraepithelial neoplasias
LiverThe image shows the transcriptomic changes along malignancy continuum.log2FC in expression of this searched gene in stem-like cells from each diseased tissue sample relative to stem-like cells in normal samples in each tissue plotted against the malignancy continuum. Samples are colored based on if they are from different disease stage.
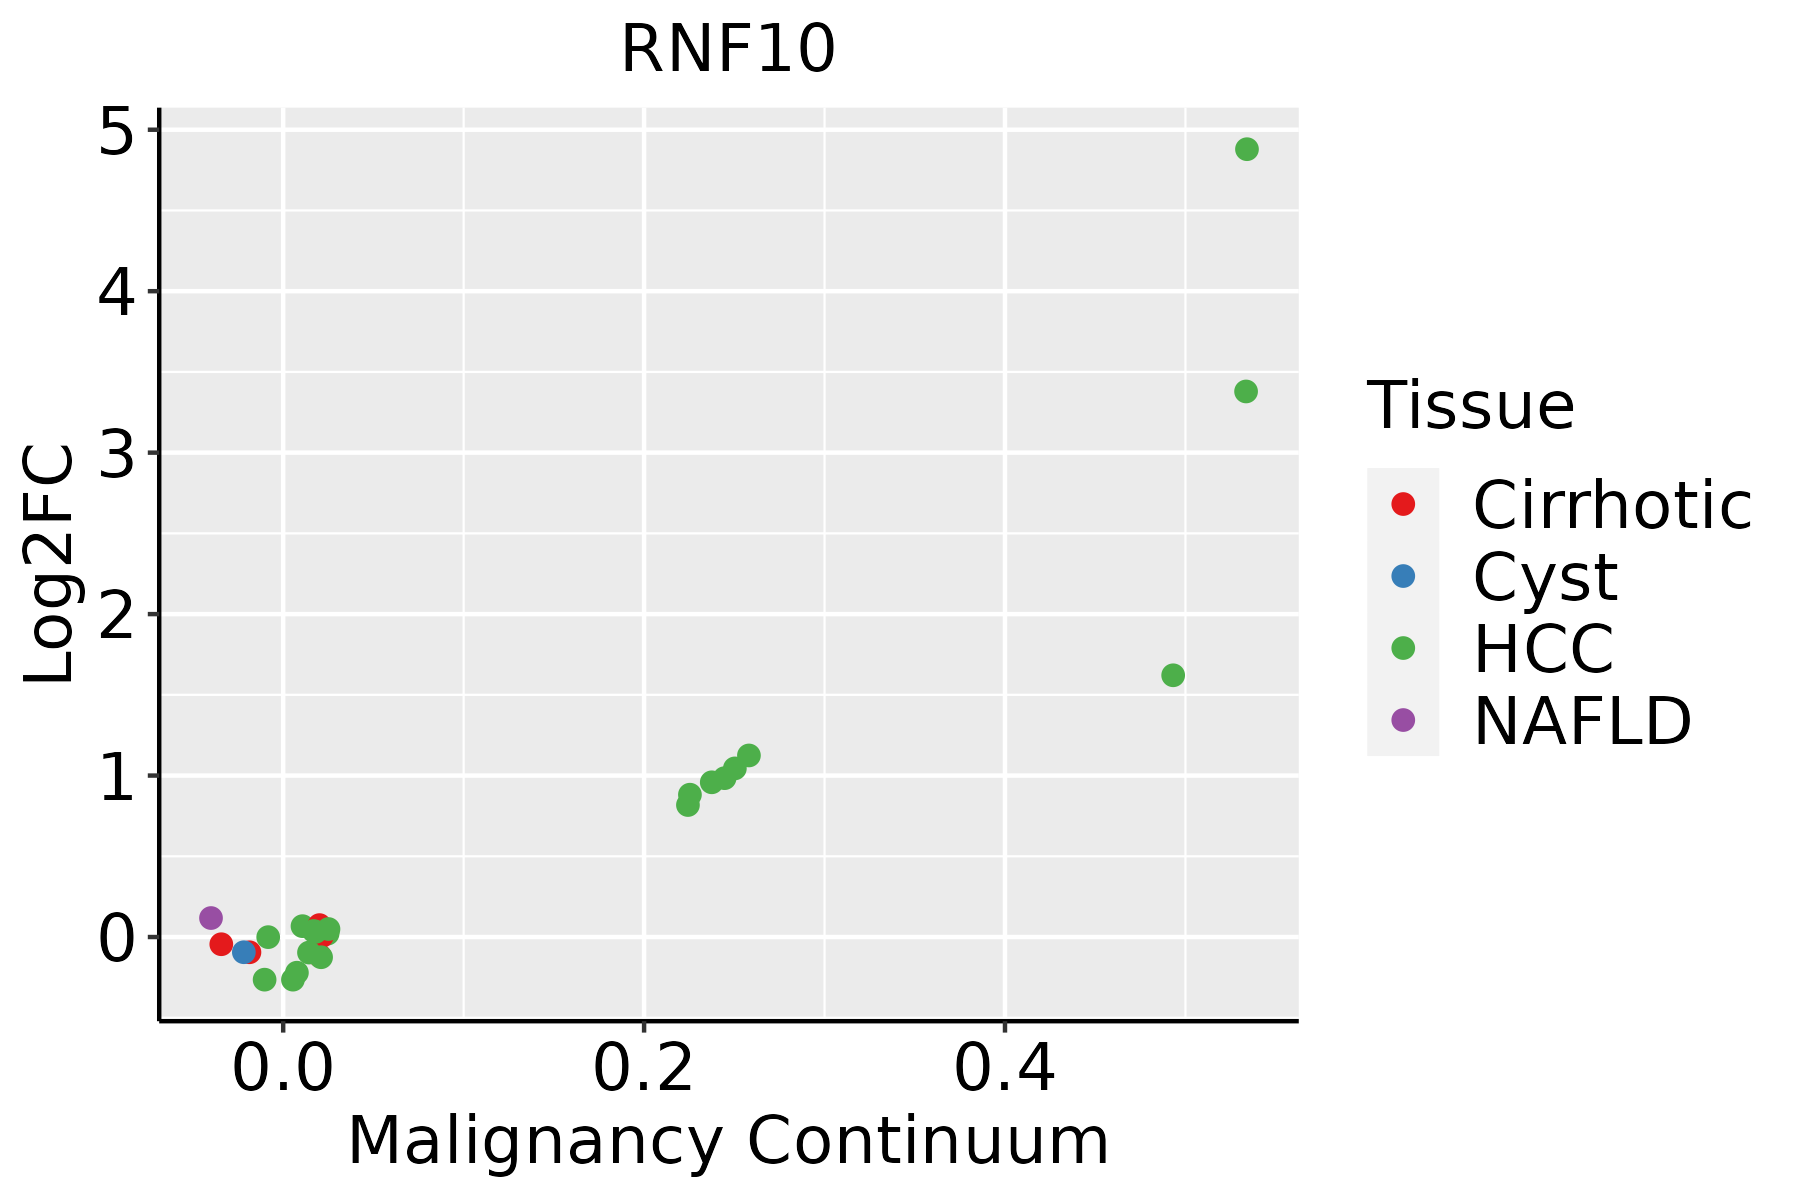
HCC: Hepatocellular carcinoma
NAFLD: Non-alcoholic fatty liver disease
Oral CavityThe image shows the transcriptomic changes along malignancy continuum.log2FC in expression of this searched gene in stem-like cells from each diseased tissue sample relative to stem-like cells in normal samples in each tissue plotted against the malignancy continuum. Samples are colored based on if they are from different disease stage.
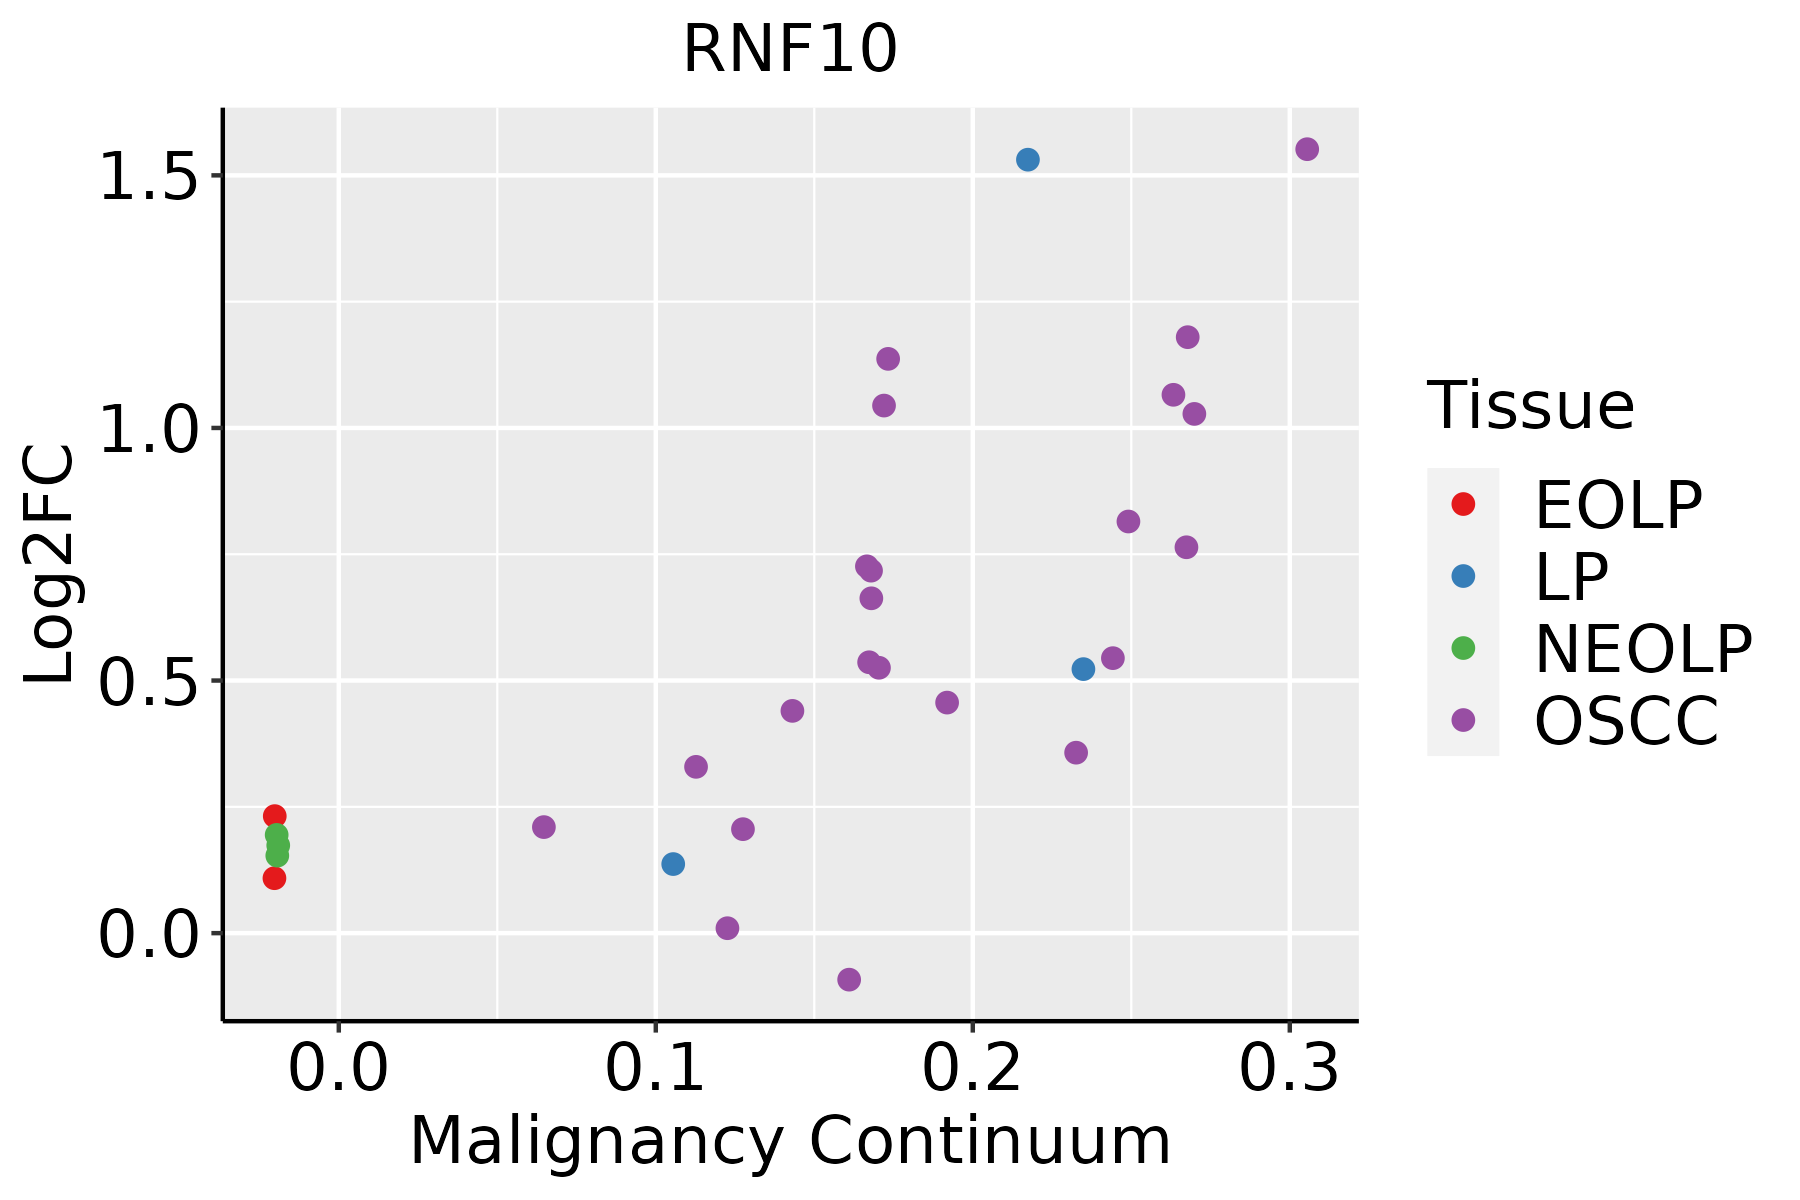
EOLP: Erosive Oral lichen planus
LP: leukoplakia
NEOLP: Non-erosive oral lichen planus
OSCC: Oral squamous cell carcinoma
SkinThe image shows the transcriptomic changes along malignancy continuum.log2FC in expression of this searched gene in stem-like cells from each diseased tissue sample relative to stem-like cells in normal samples in each tissue plotted against the malignancy continuum. Samples are colored based on if they are from different disease stage.
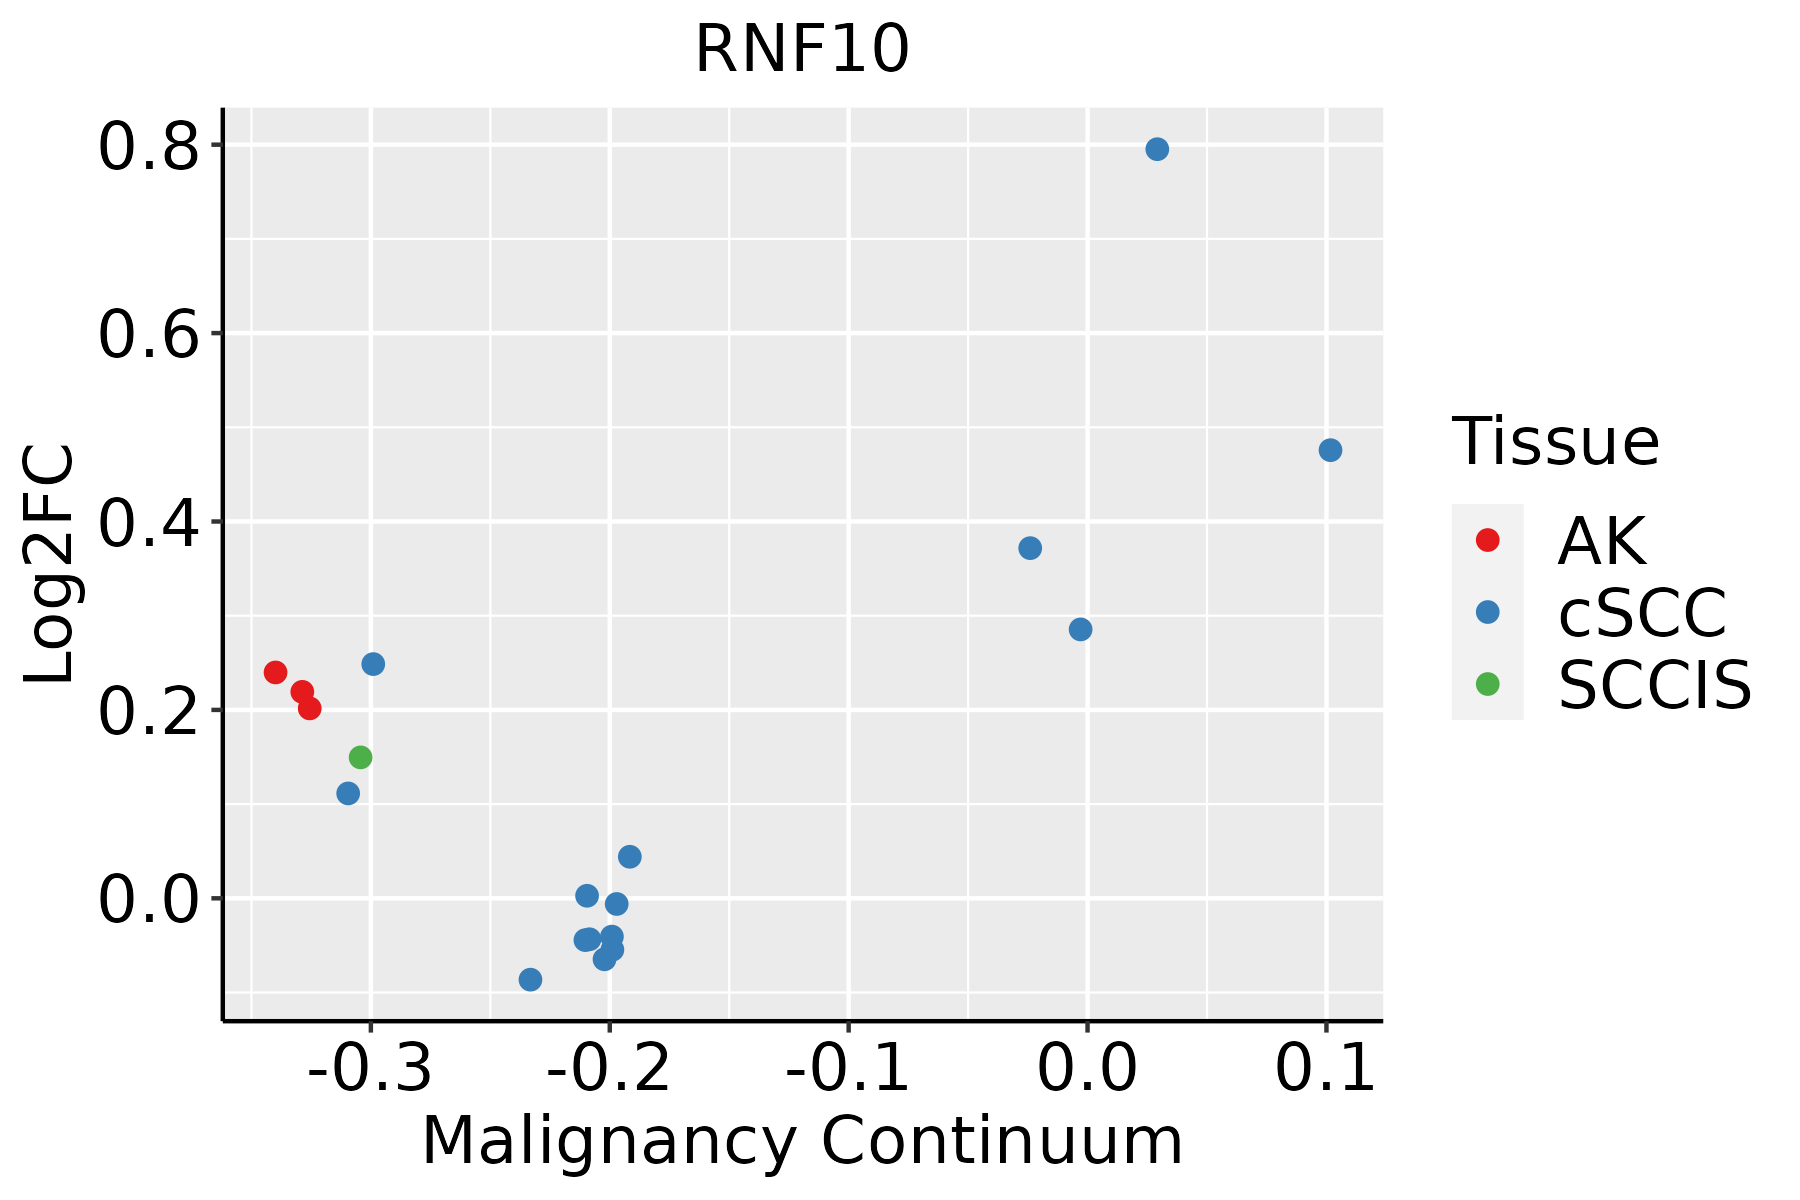
AK: Actinic keratosis
cSCC: Cutaneous squamous cell carcinoma
SCCIS:squamous cell carcinoma in situ
ThyroidThe image shows the transcriptomic changes along malignancy continuum.log2FC in expression of this searched gene in stem-like cells from each diseased tissue sample relative to stem-like cells in normal samples in each tissue plotted against the malignancy continuum. Samples are colored based on if they are from different disease stage.
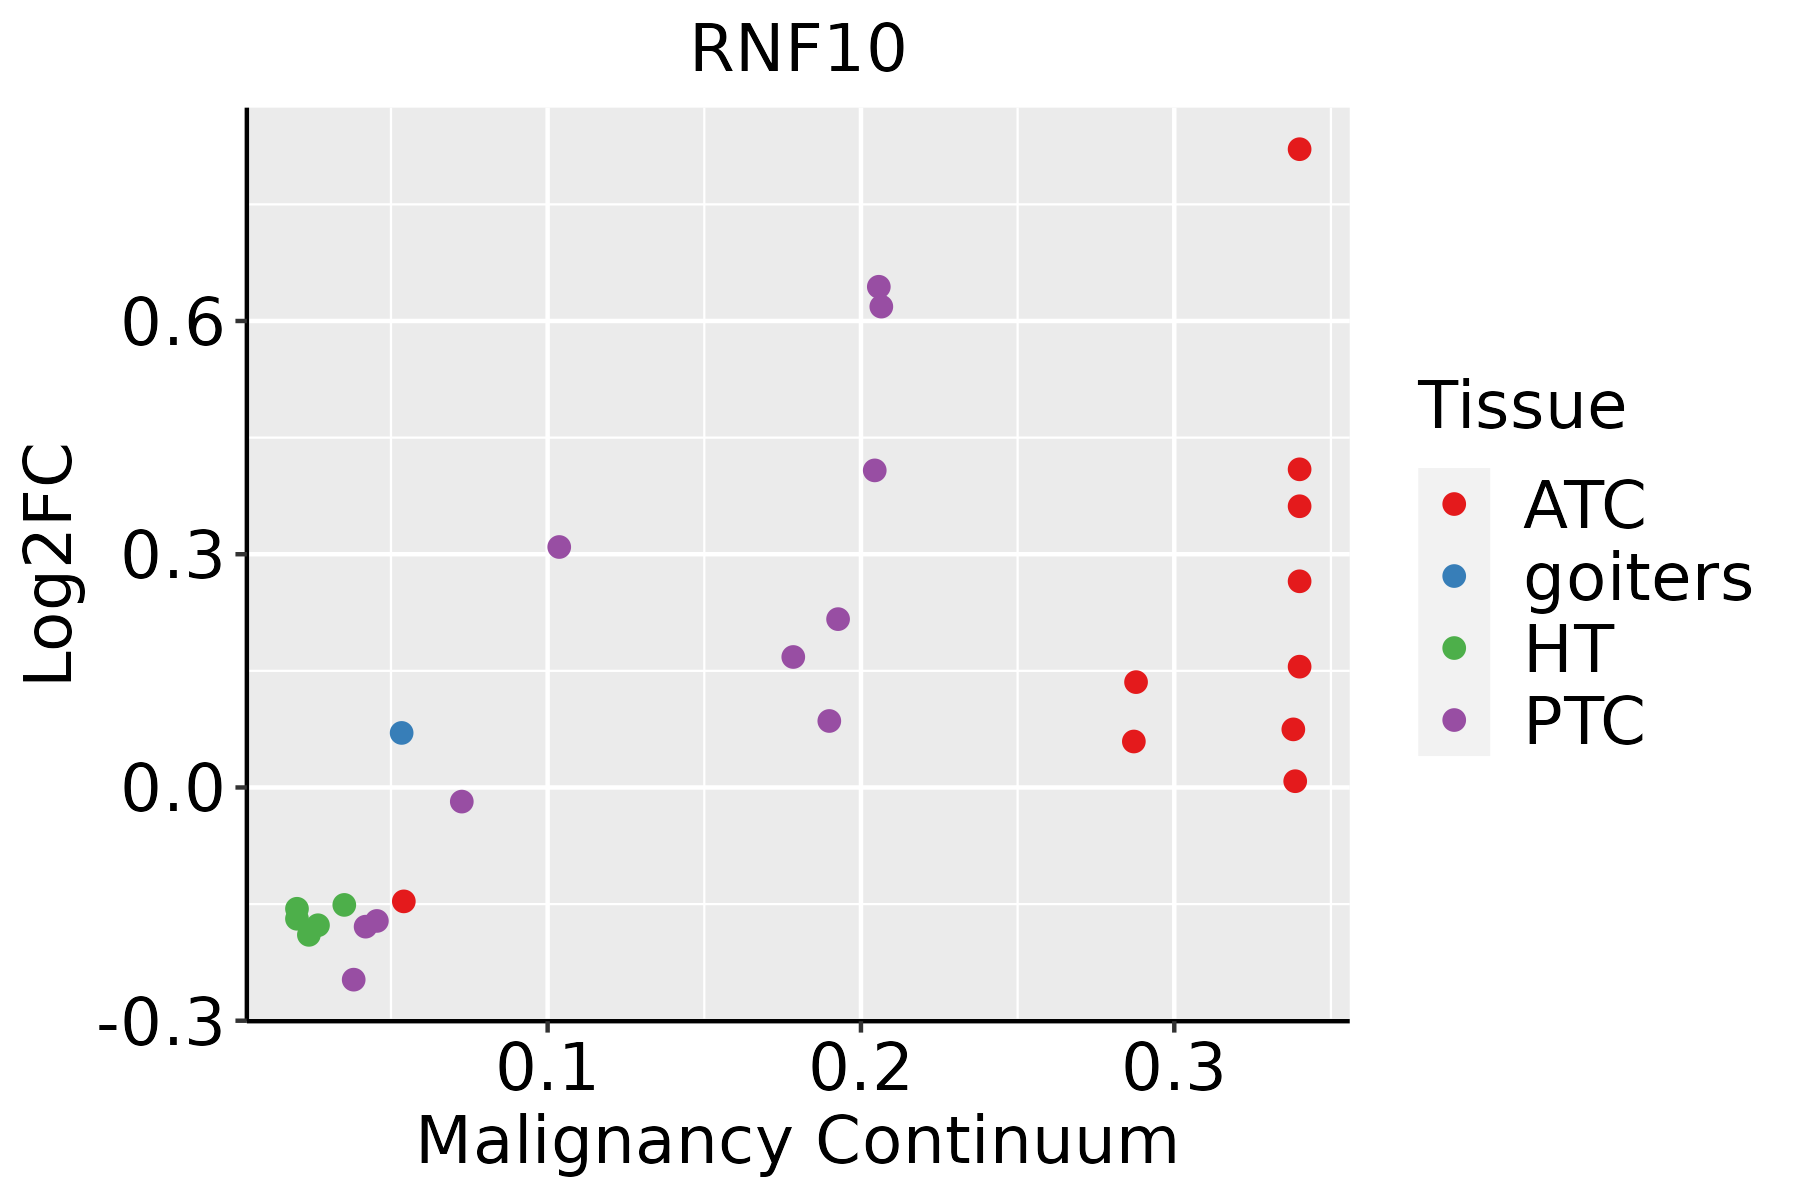
ATC: Anaplastic thyroid cancer
HT: Hashimoto's thyroiditis
PTC: Papillary thyroid cancer
∗log2FC in expression of this searched gene in stem-like cells from each diseased tissue sample relative to stem-like cells in normal samples in each tissue plotted against the malignancy continuum. Samples are colored based on if they are from different disease stage.

Top

Malignant transformation related pathway analysis

check buttonFind out the enriched GO biological processes and KEGG pathways involved in transition from healthy to precancer to cancer
check button Figure of enriched GO biological processes.
TissueDisease StageEnriched GO biological Processes
ColorectumADGO analysis - Figure of enriched GO biological processes: Top 15 enriched GO BP terms are showed in the bar plot of each disease state in each tissue. Each row represents a significant GO biological process which is colored according to the -log10(p.adjust).
ColorectumSERGO analysis - Figure of enriched GO biological processes: Top 15 enriched GO BP terms are showed in the bar plot of each disease state in each tissue. Each row represents a significant GO biological process which is colored according to the -log10(p.adjust).
ColorectumMSSGO analysis - Figure of enriched GO biological processes: Top 15 enriched GO BP terms are showed in the bar plot of each disease state in each tissue. Each row represents a significant GO biological process which is colored according to the -log10(p.adjust).
ColorectumMSI-HGO analysis - Figure of enriched GO biological processes: Top 15 enriched GO BP terms are showed in the bar plot of each disease state in each tissue. Each row represents a significant GO biological process which is colored according to the -log10(p.adjust).
ColorectumFAPGO analysis - Figure of enriched GO biological processes: Top 15 enriched GO BP terms are showed in the bar plot of each disease state in each tissue. Each row represents a significant GO biological process which is colored according to the -log10(p.adjust).
∗Top 15 enriched GO BP terms are showed in the bar plot of each disease state in each tissue. Each row represents a significant GO biological process which is colored according to the -log10(p.adjust).
Page: 1 2 3 4 5 6 7 8 9 

check button Enriched GO biological processes.
GO IDTissueDisease StageDescriptionGene RatioBg Ratiopvaluep.adjustCount
GO:0051865ColorectumADprotein autoubiquitination28/391873/187234.87e-045.30e-0328
GO:0050767ColorectumADregulation of neurogenesis99/3918364/187232.35e-031.82e-0299
GO:00507671ColorectumMSSregulation of neurogenesis94/3467364/187233.12e-044.06e-0394
GO:00518651ColorectumMSSprotein autoubiquitination25/346773/187231.00e-031.00e-0225
GO:0050768ColorectumMSSnegative regulation of neurogenesis39/3467140/187234.30e-033.07e-0239
GO:0051961ColorectumMSSnegative regulation of nervous system development40/3467145/187234.66e-033.27e-0240
GO:0051960ColorectumMSSregulation of nervous system development103/3467443/187236.68e-034.38e-02103
GO:00507672ColorectumFAPregulation of neurogenesis82/2622364/187236.28e-061.96e-0482
GO:00519601ColorectumFAPregulation of nervous system development89/2622443/187232.32e-043.25e-0389
GO:00518652ColorectumFAPprotein autoubiquitination22/262273/187232.88e-043.77e-0322
GO:00507681ColorectumFAPnegative regulation of neurogenesis32/2622140/187233.08e-032.32e-0232
GO:0010721ColorectumFAPnegative regulation of cell development39/2622180/187233.25e-032.40e-0239
GO:00519611ColorectumFAPnegative regulation of nervous system development32/2622145/187235.41e-033.53e-0232
GO:00507673ColorectumCRCregulation of neurogenesis68/2078364/187231.11e-053.62e-0468
GO:00518653ColorectumCRCprotein autoubiquitination18/207873/187238.33e-041.04e-0218
GO:00519602ColorectumCRCregulation of nervous system development71/2078443/187239.28e-041.14e-0271
GO:00107211ColorectumCRCnegative regulation of cell development34/2078180/187231.33e-031.49e-0234
GO:00519612ColorectumCRCnegative regulation of nervous system development28/2078145/187232.43e-032.30e-0228
GO:00507682ColorectumCRCnegative regulation of neurogenesis27/2078140/187232.92e-032.64e-0227
GO:00507677EndometriumAEHregulation of neurogenesis56/2100364/187238.87e-034.82e-0256
Page: 1 2 3 4 5 6 

check button Enriched KEGG pathways.
Pathway IDTissueDisease StageDescriptionGene RatioBg Ratiopvaluep.adjustqvalueCount
Page: 1 

Top

Cell-cell communication analysis

check buttonIdentification of potential cell-cell interactions between two cell types and their ligand-receptor pairs for different disease states
LigandReceptorLRpairPathwayTissueDisease Stage
Page: 1 

Top

Single-cell gene regulatory network inference analysis

check buttonFind out the significant the regulons (TFs) and the target genes of each regulon across cell types for different disease states
TFCell TypeTissueDisease StageTarget GeneRSSRegulon Activity
∗The dot plots of a searched regulon are shown for all cell subpopulations in each disease state of each tissue based on the regulon specific score inferred using pySCENIC and by calculating the average expression.
Page: 1 

Top

Somatic mutation of malignant transformation related genes

check buttonAnnotation of somatic variants for genes involved in malignant transformation
Hugo SymbolVariant ClassVariant ClassificationdbSNP RSHGVScHGVSpHGVSp ShortSWISSPROTBIOTYPESIFTPolyPhenTumor Sample BarcodeTissueHistologySexAgeStageTherapy TypesDrugsOutcome
RNF10SNVMissense_Mutationnovelc.2261N>Gp.Glu754Glyp.E754GQ8N5U6protein_codingdeleterious(0)probably_damaging(0.998)TCGA-A8-A06Z-01Breastbreast invasive carcinomaFemale>=65I/IIUnknownUnknownSD
RNF10SNVMissense_Mutationnovelc.1776N>Tp.Lys592Asnp.K592NQ8N5U6protein_codingdeleterious(0.02)possibly_damaging(0.756)TCGA-AN-A046-01Breastbreast invasive carcinomaFemale>=65I/IIUnknownUnknownSD
RNF10SNVMissense_Mutationnovelc.1132N>Tp.Arg378Trpp.R378WQ8N5U6protein_codingdeleterious(0)probably_damaging(0.993)TCGA-AR-A1AY-01Breastbreast invasive carcinomaFemale>=65I/IIUnspecificDoxorubicinSD
RNF10SNVMissense_Mutationrs767518780c.1694N>Ap.Arg565Hisp.R565HQ8N5U6protein_codingdeleterious(0)possibly_damaging(0.907)TCGA-B6-A0I9-01Breastbreast invasive carcinomaFemale<65III/IVUnknownUnknownPD
RNF10SNVMissense_Mutationc.1145T>Ap.Leu382Glnp.L382QQ8N5U6protein_codingdeleterious(0)probably_damaging(0.992)TCGA-BH-A0H7-01Breastbreast invasive carcinomaFemale>=65III/IVChemotherapydoxorubicinSD
RNF10SNVMissense_Mutationnovelc.1613N>Tp.Ser538Ilep.S538IQ8N5U6protein_codingdeleterious(0)probably_damaging(0.999)TCGA-C8-A26X-01Breastbreast invasive carcinomaFemale<65I/IIChemotherapy5-fluorouracilCR
RNF10SNVMissense_Mutationc.1549N>Ap.Glu517Lysp.E517KQ8N5U6protein_codingdeleterious(0.02)possibly_damaging(0.802)TCGA-D8-A1JP-01Breastbreast invasive carcinomaFemale>=65I/IIHormone TherapytamoxiphenSD
RNF10SNVMissense_Mutationrs779356543c.1861N>Tp.Arg621Cysp.R621CQ8N5U6protein_codingdeleterious(0)benign(0.177)TCGA-2W-A8YY-01Cervixcervical & endocervical cancerFemale<65I/IIChemotherapycisplatinCR
RNF10SNVMissense_Mutationrs141915839c.304N>Ap.Gly102Serp.G102SQ8N5U6protein_codingtolerated_low_confidence(0.17)benign(0.087)TCGA-EA-A3HS-01Cervixcervical & endocervical cancerFemale<65I/IIUnknownUnknownSD
RNF10SNVMissense_Mutationc.1243N>Gp.Gln415Glup.Q415EQ8N5U6protein_codingtolerated(1)benign(0.079)TCGA-IR-A3LH-01Cervixcervical & endocervical cancerFemale<65I/IIChemotherapycisplatinCR
Page: 1 2 3 4 5 6 7 8 

Top

Related drugs of malignant transformation related genes

check buttonIdentification of chemicals and drugs interact with genes involved in malignant transfromation
(DGIdb 4.0)
Entrez IDSymbolCategoryInteraction TypesDrug Claim NameDrug NamePMIDs
Page: 1