
|
|||||
|
 | |
| |
| |
| |
| |
| |
|
Gene: RND3 |
Gene summary for RND3 |
| Gene information | Species | Human | Gene symbol | RND3 | Gene ID | 390 |
| Gene name | Rho family GTPase 3 | |
| Gene Alias | ARHE | |
| Cytomap | 2q23.3 | |
| Gene Type | protein-coding | GO ID | GO:0000902 | UniProtAcc | B2R838 |
Top |
Malignant transformation analysis |
| Identification of the aberrant gene expression in precancerous and cancerous lesions by comparing the gene expression of stem-like cells in diseased tissues with normal stem cells |
| Entrez ID | Symbol | Replicates | Species | Organ | Tissue | Adj P-value | Log2FC | Malignancy |
| 390 | RND3 | GSM4909280 | Human | Breast | Precancer | 7.64e-05 | 6.39e-01 | 0.0305 |
| 390 | RND3 | GSM4909286 | Human | Breast | IDC | 3.79e-22 | -5.88e-01 | 0.1081 |
| 390 | RND3 | GSM4909290 | Human | Breast | IDC | 3.64e-02 | -3.64e-01 | 0.2096 |
| 390 | RND3 | GSM4909291 | Human | Breast | IDC | 4.43e-13 | -5.74e-01 | 0.1753 |
| 390 | RND3 | GSM4909293 | Human | Breast | IDC | 2.48e-05 | -3.63e-01 | 0.1581 |
| 390 | RND3 | GSM4909294 | Human | Breast | IDC | 5.25e-05 | -4.58e-01 | 0.2022 |
| 390 | RND3 | GSM4909296 | Human | Breast | IDC | 4.98e-13 | -5.35e-01 | 0.1524 |
| 390 | RND3 | GSM4909297 | Human | Breast | IDC | 3.19e-09 | -3.99e-01 | 0.1517 |
| 390 | RND3 | GSM4909298 | Human | Breast | IDC | 1.05e-03 | -3.83e-01 | 0.1551 |
| 390 | RND3 | GSM4909301 | Human | Breast | IDC | 3.34e-16 | -5.68e-01 | 0.1577 |
| 390 | RND3 | GSM4909302 | Human | Breast | IDC | 8.57e-14 | -4.78e-01 | 0.1545 |
| 390 | RND3 | GSM4909306 | Human | Breast | IDC | 8.78e-11 | -5.10e-01 | 0.1564 |
| 390 | RND3 | GSM4909307 | Human | Breast | IDC | 4.97e-09 | -4.88e-01 | 0.1569 |
| 390 | RND3 | GSM4909308 | Human | Breast | IDC | 8.63e-15 | -5.38e-01 | 0.158 |
| 390 | RND3 | GSM4909309 | Human | Breast | IDC | 2.90e-04 | -3.72e-01 | 0.0483 |
| 390 | RND3 | GSM4909311 | Human | Breast | IDC | 2.77e-21 | -5.50e-01 | 0.1534 |
| 390 | RND3 | GSM4909312 | Human | Breast | IDC | 6.98e-17 | -5.49e-01 | 0.1552 |
| 390 | RND3 | GSM4909319 | Human | Breast | IDC | 1.12e-24 | -6.00e-01 | 0.1563 |
| 390 | RND3 | GSM4909320 | Human | Breast | IDC | 1.32e-08 | -5.66e-01 | 0.1575 |
| 390 | RND3 | GSM4909321 | Human | Breast | IDC | 4.38e-19 | -5.63e-01 | 0.1559 |
| Page: 1 2 3 4 5 6 7 8 9 10 11 |
| Tissue | Expression Dynamics | Abbreviation |
| Breast |  | IDC: Invasive ductal carcinoma |
| DCIS: Ductal carcinoma in situ | ||
| Precancer(BRCA1-mut): Precancerous lesion from BRCA1 mutation carriers | ||
| Cervix | 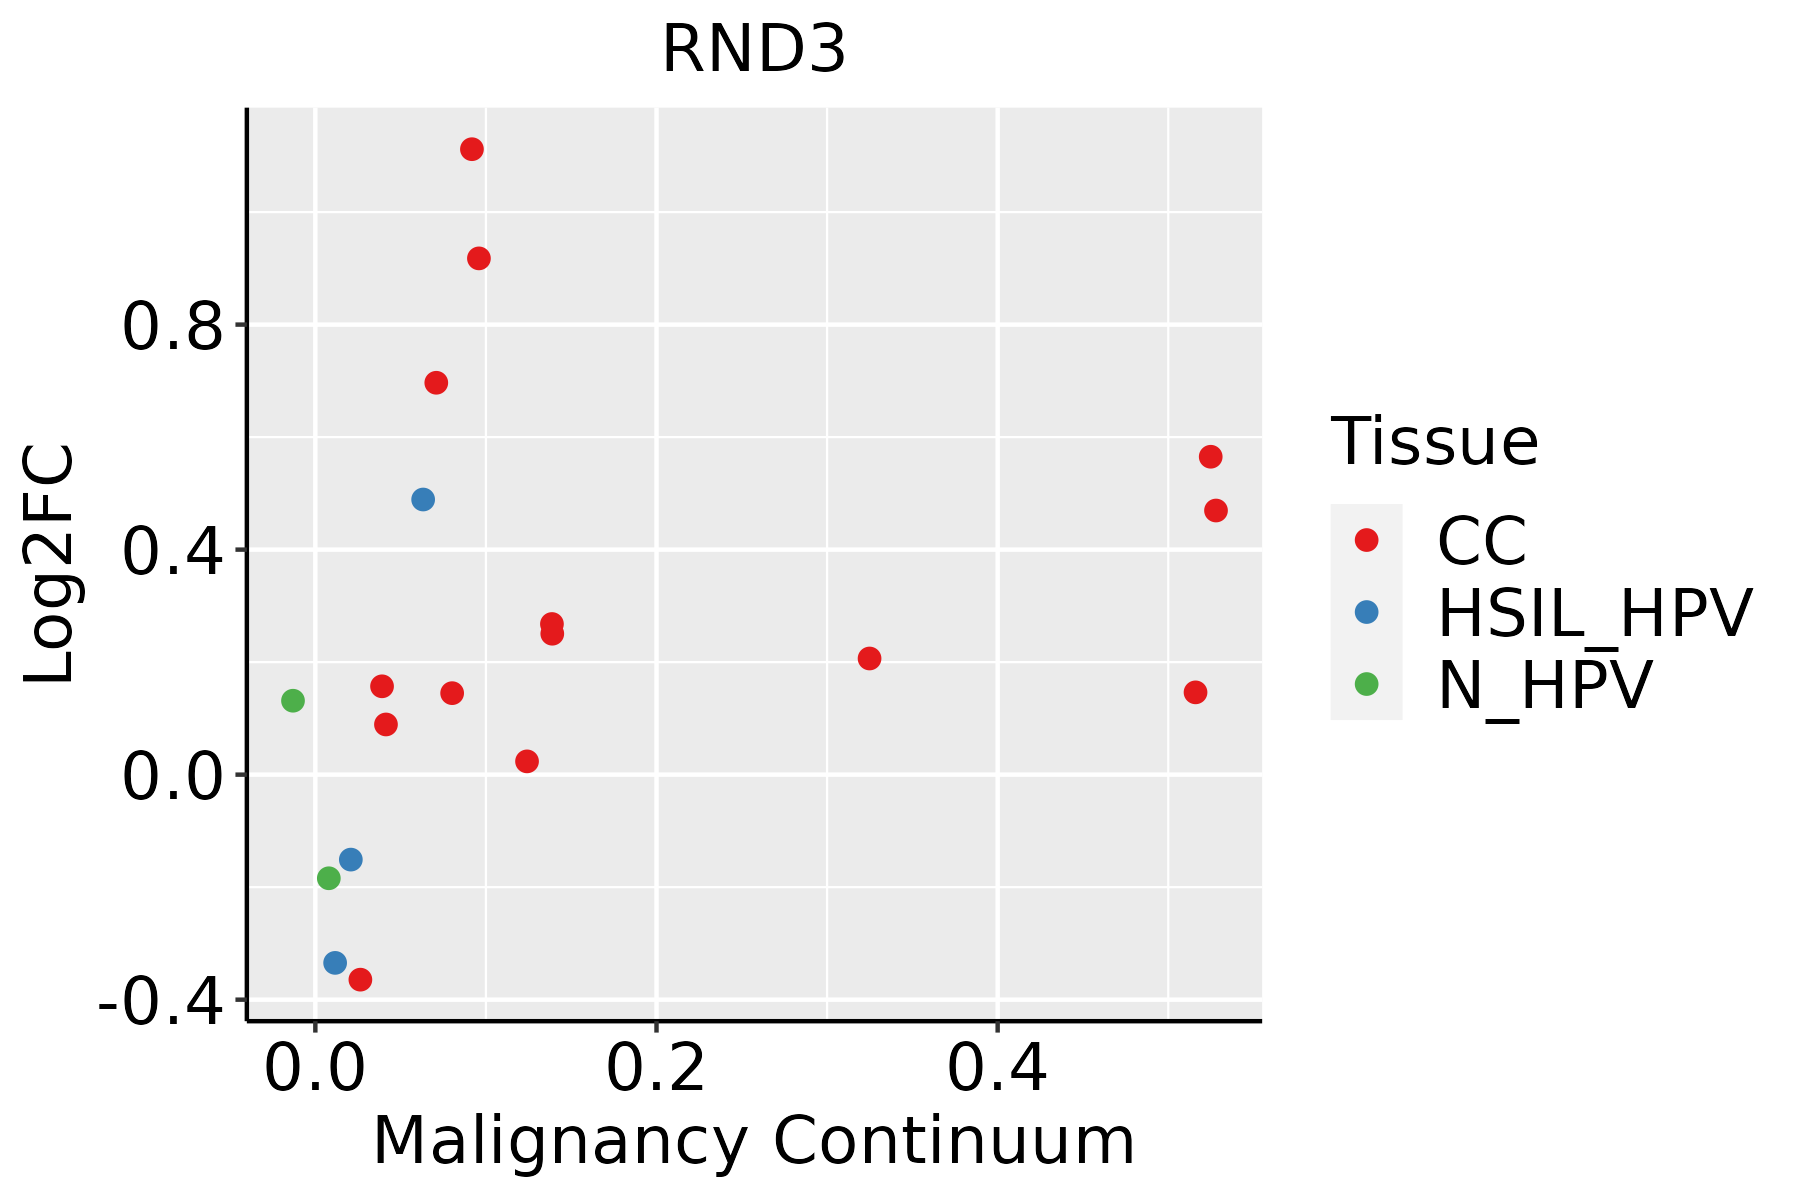 | CC: Cervix cancer |
| HSIL_HPV: HPV-infected high-grade squamous intraepithelial lesions | ||
| N_HPV: HPV-infected normal cervix | ||
| Endometrium |  | AEH: Atypical endometrial hyperplasia |
| EEC: Endometrioid Cancer | ||
| Esophagus | 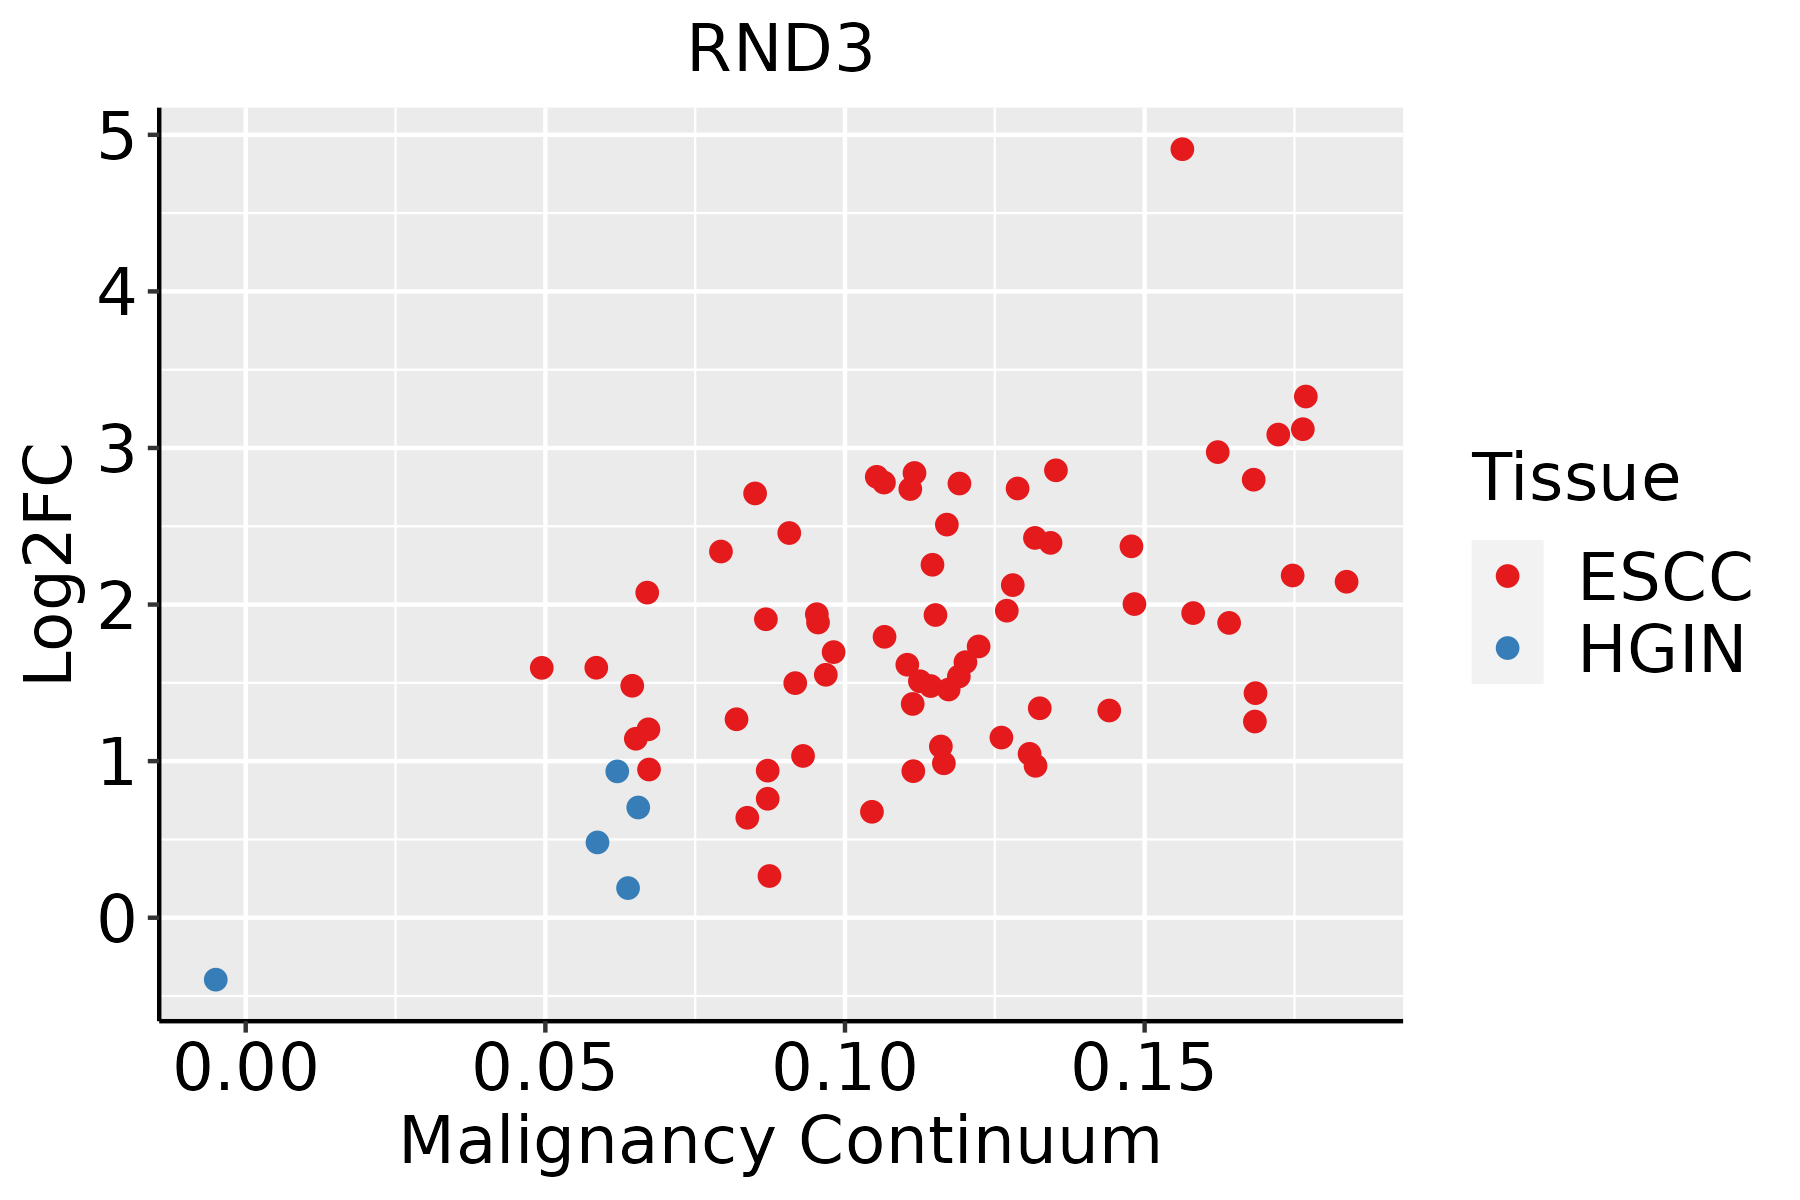 | ESCC: Esophageal squamous cell carcinoma |
| HGIN: High-grade intraepithelial neoplasias | ||
| LGIN: Low-grade intraepithelial neoplasias | ||
| Liver | 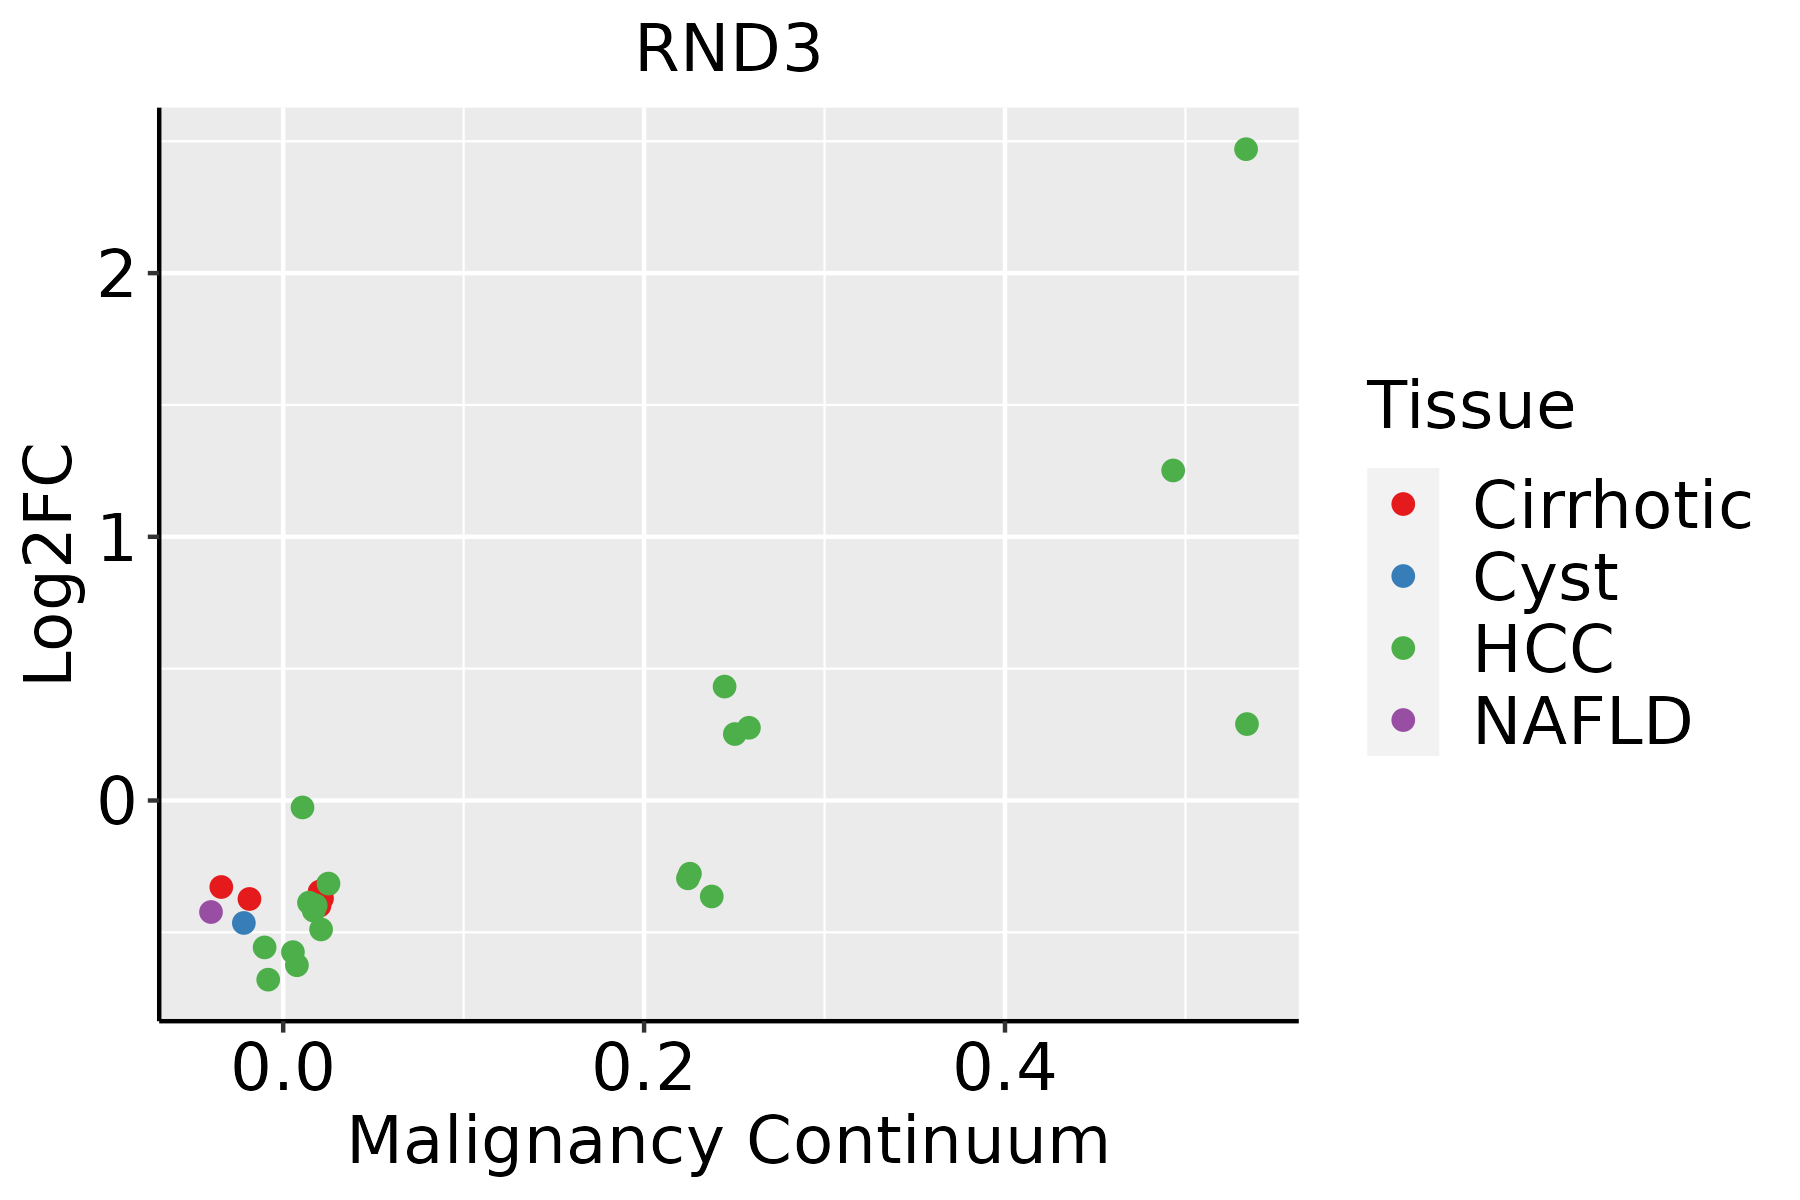 | HCC: Hepatocellular carcinoma |
| NAFLD: Non-alcoholic fatty liver disease | ||
| Oral Cavity |  | EOLP: Erosive Oral lichen planus |
| LP: leukoplakia | ||
| NEOLP: Non-erosive oral lichen planus | ||
| OSCC: Oral squamous cell carcinoma | ||
| Prostate |  | BPH: Benign Prostatic Hyperplasia |
| Skin | 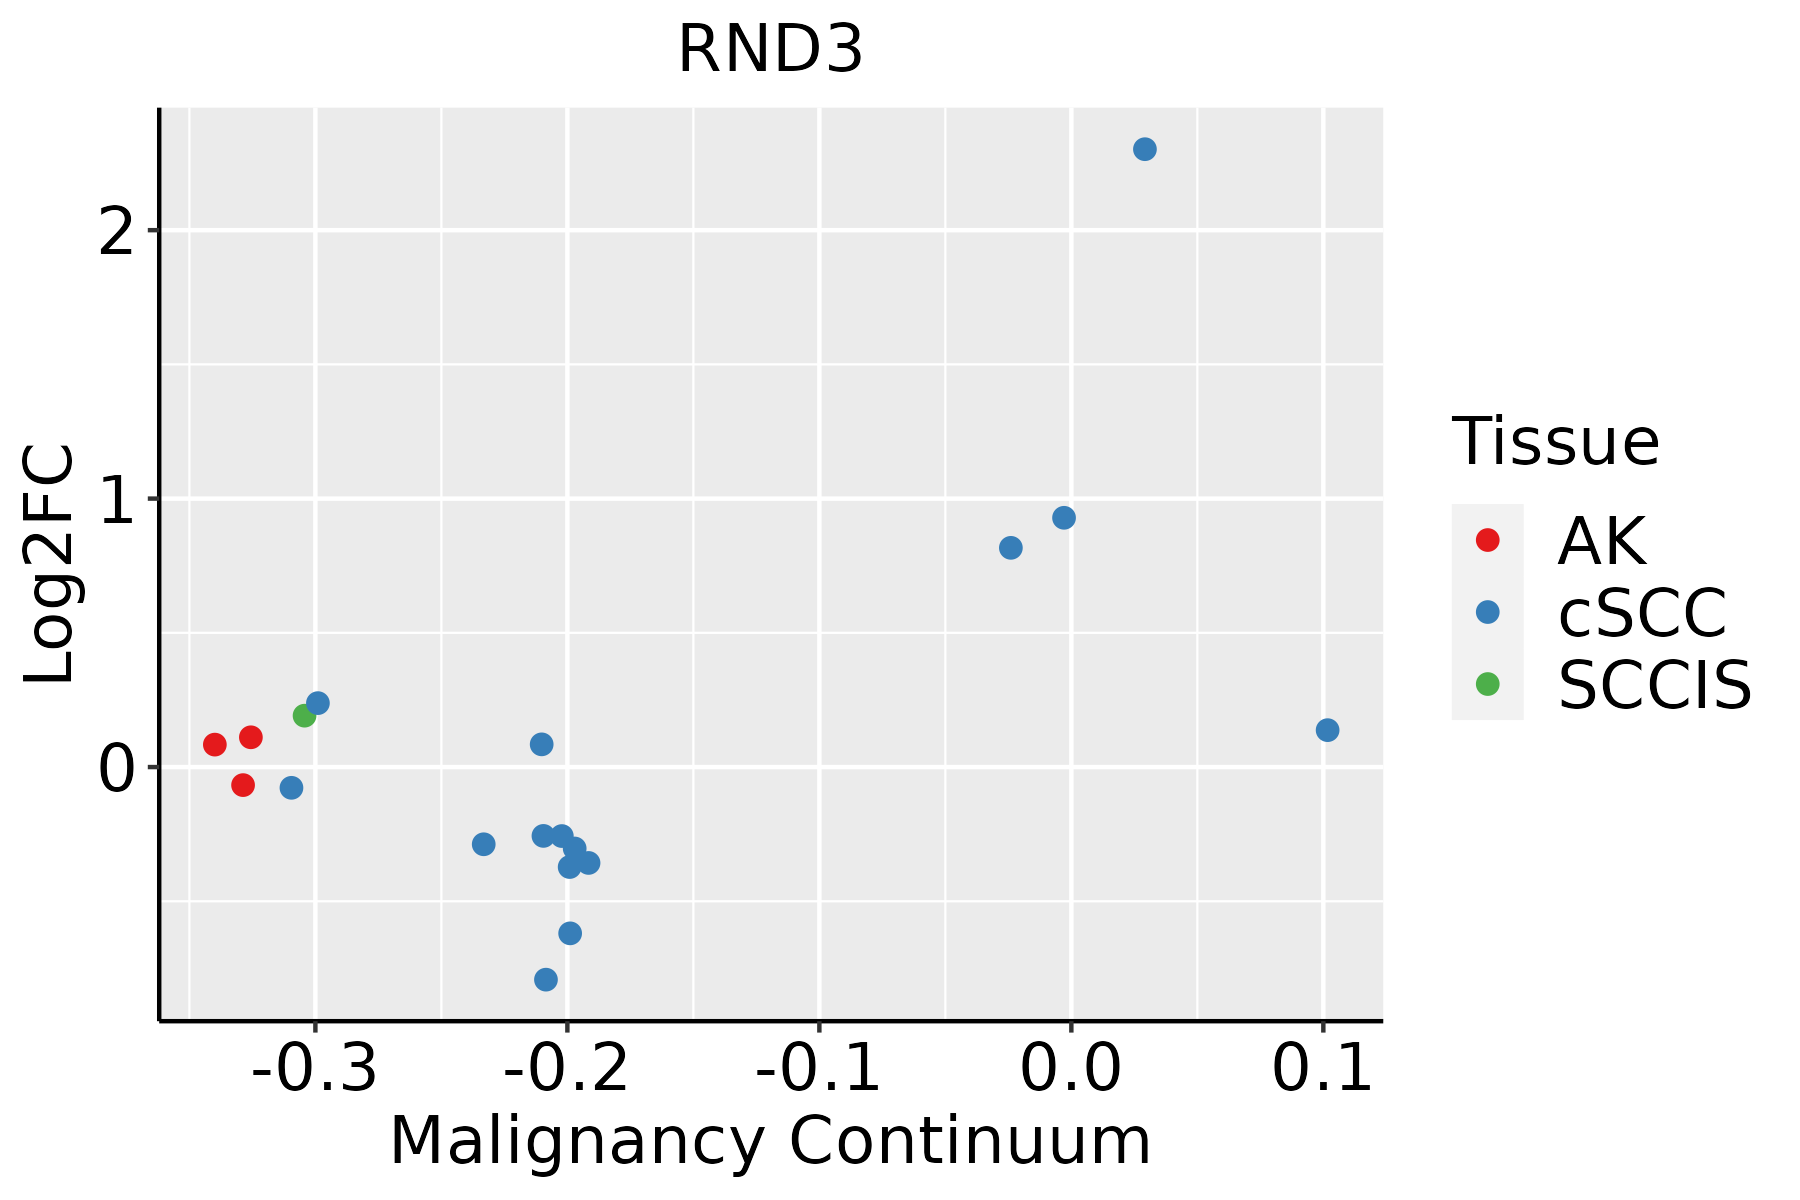 | AK: Actinic keratosis |
| cSCC: Cutaneous squamous cell carcinoma | ||
| SCCIS:squamous cell carcinoma in situ | ||
| Thyroid | 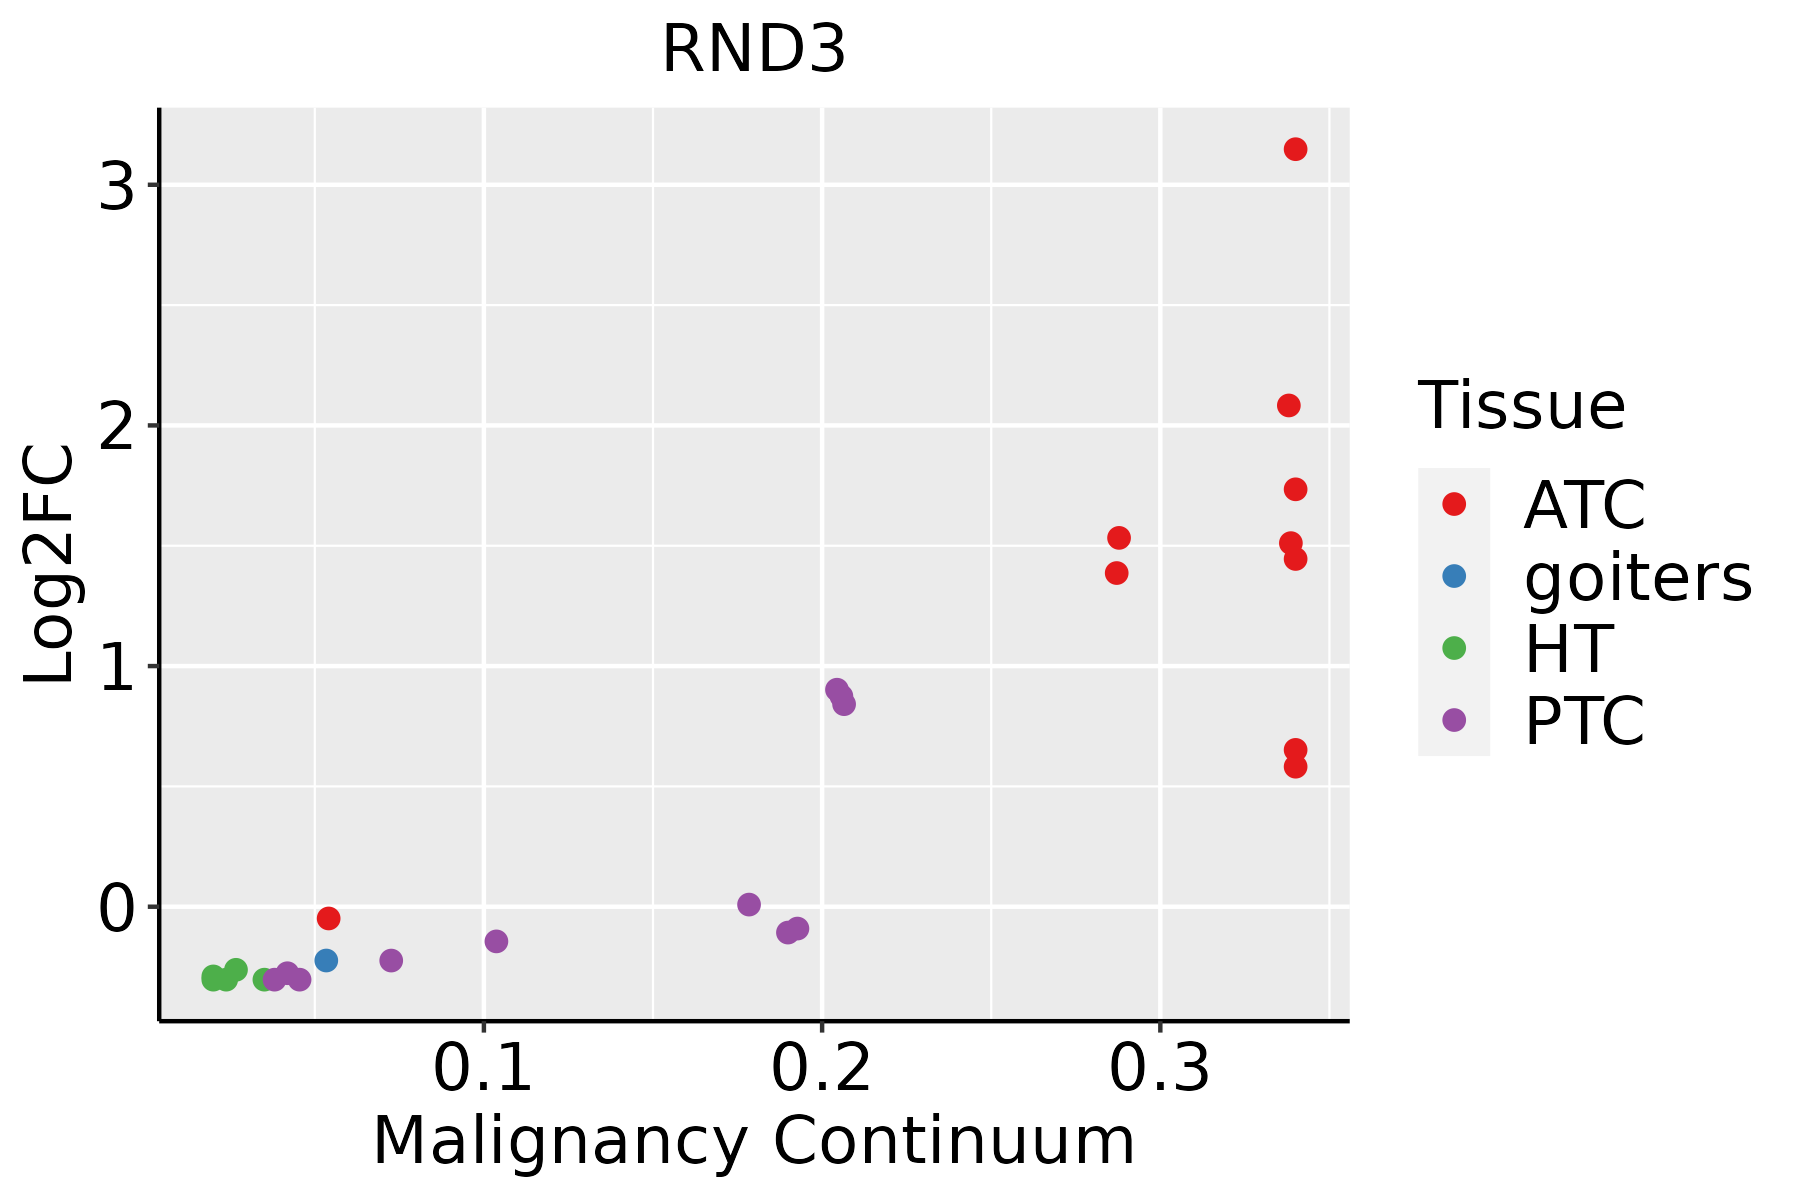 | ATC: Anaplastic thyroid cancer |
| HT: Hashimoto's thyroiditis | ||
| PTC: Papillary thyroid cancer |
| ∗log2FC in expression of this searched gene in stem-like cells from each diseased tissue sample relative to stem-like cells in normal samples in each tissue plotted against the malignancy continuum. Samples are colored based on if they are from different disease stage. |
Top |
Malignant transformation related pathway analysis |
| Find out the enriched GO biological processes and KEGG pathways involved in transition from healthy to precancer to cancer |
| Tissue | Disease Stage | Enriched GO biological Processes |
| Colorectum | AD |  |
| Colorectum | SER |  |
| Colorectum | MSS |  |
| Colorectum | MSI-H |  |
| Colorectum | FAP |  |
| ∗Top 15 enriched GO BP terms are showed in the bar plot of each disease state in each tissue. Each row represents a significant GO biological process which is colored according to the -log10(p.adjust). |
| Page: 1 2 3 4 5 6 7 8 9 |
| GO ID | Tissue | Disease Stage | Description | Gene Ratio | Bg Ratio | pvalue | p.adjust | Count |
| GO:00329709 | Breast | Precancer | regulation of actin filament-based process | 42/1080 | 397/18723 | 1.11e-04 | 2.01e-03 | 42 |
| GO:00070159 | Breast | Precancer | actin filament organization | 44/1080 | 442/18723 | 3.02e-04 | 4.35e-03 | 44 |
| GO:00329569 | Breast | Precancer | regulation of actin cytoskeleton organization | 36/1080 | 358/18723 | 8.56e-04 | 9.88e-03 | 36 |
| GO:00071638 | Breast | Precancer | establishment or maintenance of cell polarity | 23/1080 | 218/18723 | 3.82e-03 | 3.06e-02 | 23 |
| GO:00226049 | Breast | Precancer | regulation of cell morphogenesis | 29/1080 | 309/18723 | 6.88e-03 | 4.67e-02 | 29 |
| GO:003297014 | Breast | IDC | regulation of actin filament-based process | 56/1434 | 397/18723 | 6.37e-06 | 1.99e-04 | 56 |
| GO:003295614 | Breast | IDC | regulation of actin cytoskeleton organization | 48/1434 | 358/18723 | 1.03e-04 | 1.96e-03 | 48 |
| GO:000701514 | Breast | IDC | actin filament organization | 55/1434 | 442/18723 | 2.45e-04 | 3.84e-03 | 55 |
| GO:000716314 | Breast | IDC | establishment or maintenance of cell polarity | 32/1434 | 218/18723 | 2.84e-04 | 4.33e-03 | 32 |
| GO:003297024 | Breast | DCIS | regulation of actin filament-based process | 56/1390 | 397/18723 | 2.50e-06 | 8.74e-05 | 56 |
| GO:003295624 | Breast | DCIS | regulation of actin cytoskeleton organization | 48/1390 | 358/18723 | 4.82e-05 | 9.92e-04 | 48 |
| GO:000701524 | Breast | DCIS | actin filament organization | 56/1390 | 442/18723 | 5.90e-05 | 1.19e-03 | 56 |
| GO:000716324 | Breast | DCIS | establishment or maintenance of cell polarity | 32/1390 | 218/18723 | 1.62e-04 | 2.71e-03 | 32 |
| GO:000701510 | Cervix | CC | actin filament organization | 109/2311 | 442/18723 | 4.92e-13 | 2.45e-10 | 109 |
| GO:002260410 | Cervix | CC | regulation of cell morphogenesis | 84/2311 | 309/18723 | 1.00e-12 | 4.29e-10 | 84 |
| GO:003297010 | Cervix | CC | regulation of actin filament-based process | 96/2311 | 397/18723 | 4.00e-11 | 8.54e-09 | 96 |
| GO:00071639 | Cervix | CC | establishment or maintenance of cell polarity | 63/2311 | 218/18723 | 4.25e-11 | 8.76e-09 | 63 |
| GO:003295610 | Cervix | CC | regulation of actin cytoskeleton organization | 86/2311 | 358/18723 | 5.90e-10 | 7.51e-08 | 86 |
| GO:00083608 | Cervix | CC | regulation of cell shape | 38/2311 | 154/18723 | 1.86e-05 | 3.46e-04 | 38 |
| GO:00308657 | Cervix | CC | cortical cytoskeleton organization | 19/2311 | 61/18723 | 8.72e-05 | 1.16e-03 | 19 |
| Page: 1 2 3 4 5 6 7 |
| Pathway ID | Tissue | Disease Stage | Description | Gene Ratio | Bg Ratio | pvalue | p.adjust | qvalue | Count |
| Page: 1 |
Top |
Cell-cell communication analysis |
| Identification of potential cell-cell interactions between two cell types and their ligand-receptor pairs for different disease states |
| Ligand | Receptor | LRpair | Pathway | Tissue | Disease Stage |
| Page: 1 |
Top |
Single-cell gene regulatory network inference analysis |
| Find out the significant the regulons (TFs) and the target genes of each regulon across cell types for different disease states |
| TF | Cell Type | Tissue | Disease Stage | Target Gene | RSS | Regulon Activity |
| ∗The dot plots of a searched regulon are shown for all cell subpopulations in each disease state of each tissue based on the regulon specific score inferred using pySCENIC and by calculating the average expression. |
| Page: 1 |
Top |
Somatic mutation of malignant transformation related genes |
| Annotation of somatic variants for genes involved in malignant transformation |
| Hugo Symbol | Variant Class | Variant Classification | dbSNP RS | HGVSc | HGVSp | HGVSp Short | SWISSPROT | BIOTYPE | SIFT | PolyPhen | Tumor Sample Barcode | Tissue | Histology | Sex | Age | Stage | Therapy Types | Drugs | Outcome |
| RND3 | SNV | Missense_Mutation | rs747141041 | c.284N>T | p.Ser95Leu | p.S95L | P61587 | protein_coding | deleterious(0.04) | possibly_damaging(0.873) | TCGA-AC-A23H-01 | Breast | breast invasive carcinoma | Female | >=65 | I/II | Unknown | Unknown | PD |
| RND3 | SNV | Missense_Mutation | rs536121901 | c.526N>A | p.Glu176Lys | p.E176K | P61587 | protein_coding | deleterious(0) | probably_damaging(1) | TCGA-AN-A046-01 | Breast | breast invasive carcinoma | Female | >=65 | I/II | Unknown | Unknown | SD |
| RND3 | SNV | Missense_Mutation | c.268C>A | p.Leu90Ile | p.L90I | P61587 | protein_coding | deleterious(0) | probably_damaging(0.95) | TCGA-BH-A18G-01 | Breast | breast invasive carcinoma | Female | >=65 | I/II | Unknown | Unknown | SD | |
| RND3 | SNV | Missense_Mutation | c.478N>C | p.Asp160His | p.D160H | P61587 | protein_coding | deleterious(0) | probably_damaging(0.957) | TCGA-C8-A8HP-01 | Breast | breast invasive carcinoma | Female | <65 | III/IV | Chemotherapy | 5-fluorouracil | CR | |
| RND3 | SNV | Missense_Mutation | rs747141041 | c.284C>T | p.Ser95Leu | p.S95L | P61587 | protein_coding | deleterious(0.04) | possibly_damaging(0.873) | TCGA-Q1-A5R2-01 | Cervix | cervical & endocervical cancer | Female | <65 | I/II | Chemotherapy | cisplatin | PR |
| RND3 | SNV | Missense_Mutation | c.242N>A | p.Ser81Tyr | p.S81Y | P61587 | protein_coding | deleterious(0) | probably_damaging(0.999) | TCGA-AA-A010-01 | Colorectum | colon adenocarcinoma | Female | <65 | I/II | Chemotherapy | folinic | CR | |
| RND3 | SNV | Missense_Mutation | c.290N>T | p.Ala97Val | p.A97V | P61587 | protein_coding | tolerated(0.16) | probably_damaging(0.983) | TCGA-CI-6624-01 | Colorectum | rectum adenocarcinoma | Female | <65 | I/II | Unknown | Unknown | SD | |
| RND3 | SNV | Missense_Mutation | novel | c.675N>T | p.Glu225Asp | p.E225D | P61587 | protein_coding | tolerated(0.47) | benign(0.001) | TCGA-A5-A0G2-01 | Endometrium | uterine corpus endometrioid carcinoma | Female | <65 | III/IV | Unknown | Unknown | SD |
| RND3 | SNV | Missense_Mutation | novel | c.361N>G | p.Ile121Val | p.I121V | P61587 | protein_coding | tolerated(0.53) | benign(0.067) | TCGA-AJ-A23N-01 | Endometrium | uterine corpus endometrioid carcinoma | Female | >=65 | III/IV | Chemotherapy | carboplatin | PD |
| RND3 | SNV | Missense_Mutation | novel | c.230N>G | p.Asp77Gly | p.D77G | P61587 | protein_coding | deleterious(0.02) | probably_damaging(1) | TCGA-AJ-A3EK-01 | Endometrium | uterine corpus endometrioid carcinoma | Female | <65 | I/II | Chemotherapy | carboplatin | CR |
| Page: 1 2 3 |
Top |
Related drugs of malignant transformation related genes |
| Identification of chemicals and drugs interact with genes involved in malignant transfromation |
| (DGIdb 4.0) |
| Entrez ID | Symbol | Category | Interaction Types | Drug Claim Name | Drug Name | PMIDs |
| Page: 1 |

Copyright 2023-Present -The University of Texas Health Science Center at Houston |