
|
|||||
|
 | |
| |
| |
| |
| |
| |
|
Gene: RND1 |
Gene summary for RND1 |
| Gene information | Species | Human | Gene symbol | RND1 | Gene ID | 27289 |
| Gene name | Rho family GTPase 1 | |
| Gene Alias | ARHS | |
| Cytomap | 12q13.12 | |
| Gene Type | protein-coding | GO ID | GO:0000902 | UniProtAcc | Q92730 |
Top |
Malignant transformation analysis |
| Identification of the aberrant gene expression in precancerous and cancerous lesions by comparing the gene expression of stem-like cells in diseased tissues with normal stem cells |
| Entrez ID | Symbol | Replicates | Species | Organ | Tissue | Adj P-value | Log2FC | Malignancy |
| 27289 | RND1 | P1T-E | Human | Esophagus | ESCC | 1.25e-09 | 6.32e-01 | 0.0875 |
| 27289 | RND1 | P2T-E | Human | Esophagus | ESCC | 1.14e-13 | 3.07e-01 | 0.1177 |
| 27289 | RND1 | P4T-E | Human | Esophagus | ESCC | 5.08e-12 | 5.61e-01 | 0.1323 |
| 27289 | RND1 | P8T-E | Human | Esophagus | ESCC | 1.63e-32 | 1.67e+00 | 0.0889 |
| 27289 | RND1 | P10T-E | Human | Esophagus | ESCC | 6.85e-03 | 2.06e-02 | 0.116 |
| 27289 | RND1 | P11T-E | Human | Esophagus | ESCC | 6.48e-03 | 2.84e-01 | 0.1426 |
| 27289 | RND1 | P16T-E | Human | Esophagus | ESCC | 2.52e-06 | 1.59e-01 | 0.1153 |
| 27289 | RND1 | P23T-E | Human | Esophagus | ESCC | 6.97e-12 | 6.01e-01 | 0.108 |
| 27289 | RND1 | P27T-E | Human | Esophagus | ESCC | 1.20e-03 | 8.12e-02 | 0.1055 |
| 27289 | RND1 | P31T-E | Human | Esophagus | ESCC | 2.25e-03 | -3.07e-02 | 0.1251 |
| 27289 | RND1 | P36T-E | Human | Esophagus | ESCC | 5.98e-04 | 4.36e-01 | 0.1187 |
| 27289 | RND1 | P37T-E | Human | Esophagus | ESCC | 7.65e-03 | 1.02e-01 | 0.1371 |
| 27289 | RND1 | P42T-E | Human | Esophagus | ESCC | 2.13e-02 | 2.50e-01 | 0.1175 |
| 27289 | RND1 | P48T-E | Human | Esophagus | ESCC | 3.26e-02 | 2.42e-01 | 0.0959 |
| 27289 | RND1 | P52T-E | Human | Esophagus | ESCC | 4.33e-02 | 1.41e-01 | 0.1555 |
| 27289 | RND1 | P54T-E | Human | Esophagus | ESCC | 2.86e-17 | 7.10e-01 | 0.0975 |
| 27289 | RND1 | P56T-E | Human | Esophagus | ESCC | 1.80e-06 | 1.15e+00 | 0.1613 |
| 27289 | RND1 | P57T-E | Human | Esophagus | ESCC | 1.08e-04 | 2.62e-01 | 0.0926 |
| 27289 | RND1 | P61T-E | Human | Esophagus | ESCC | 7.45e-32 | 8.17e-01 | 0.099 |
| 27289 | RND1 | P65T-E | Human | Esophagus | ESCC | 1.09e-06 | 2.64e-01 | 0.0978 |
| Page: 1 2 |
| Tissue | Expression Dynamics | Abbreviation |
| Esophagus | 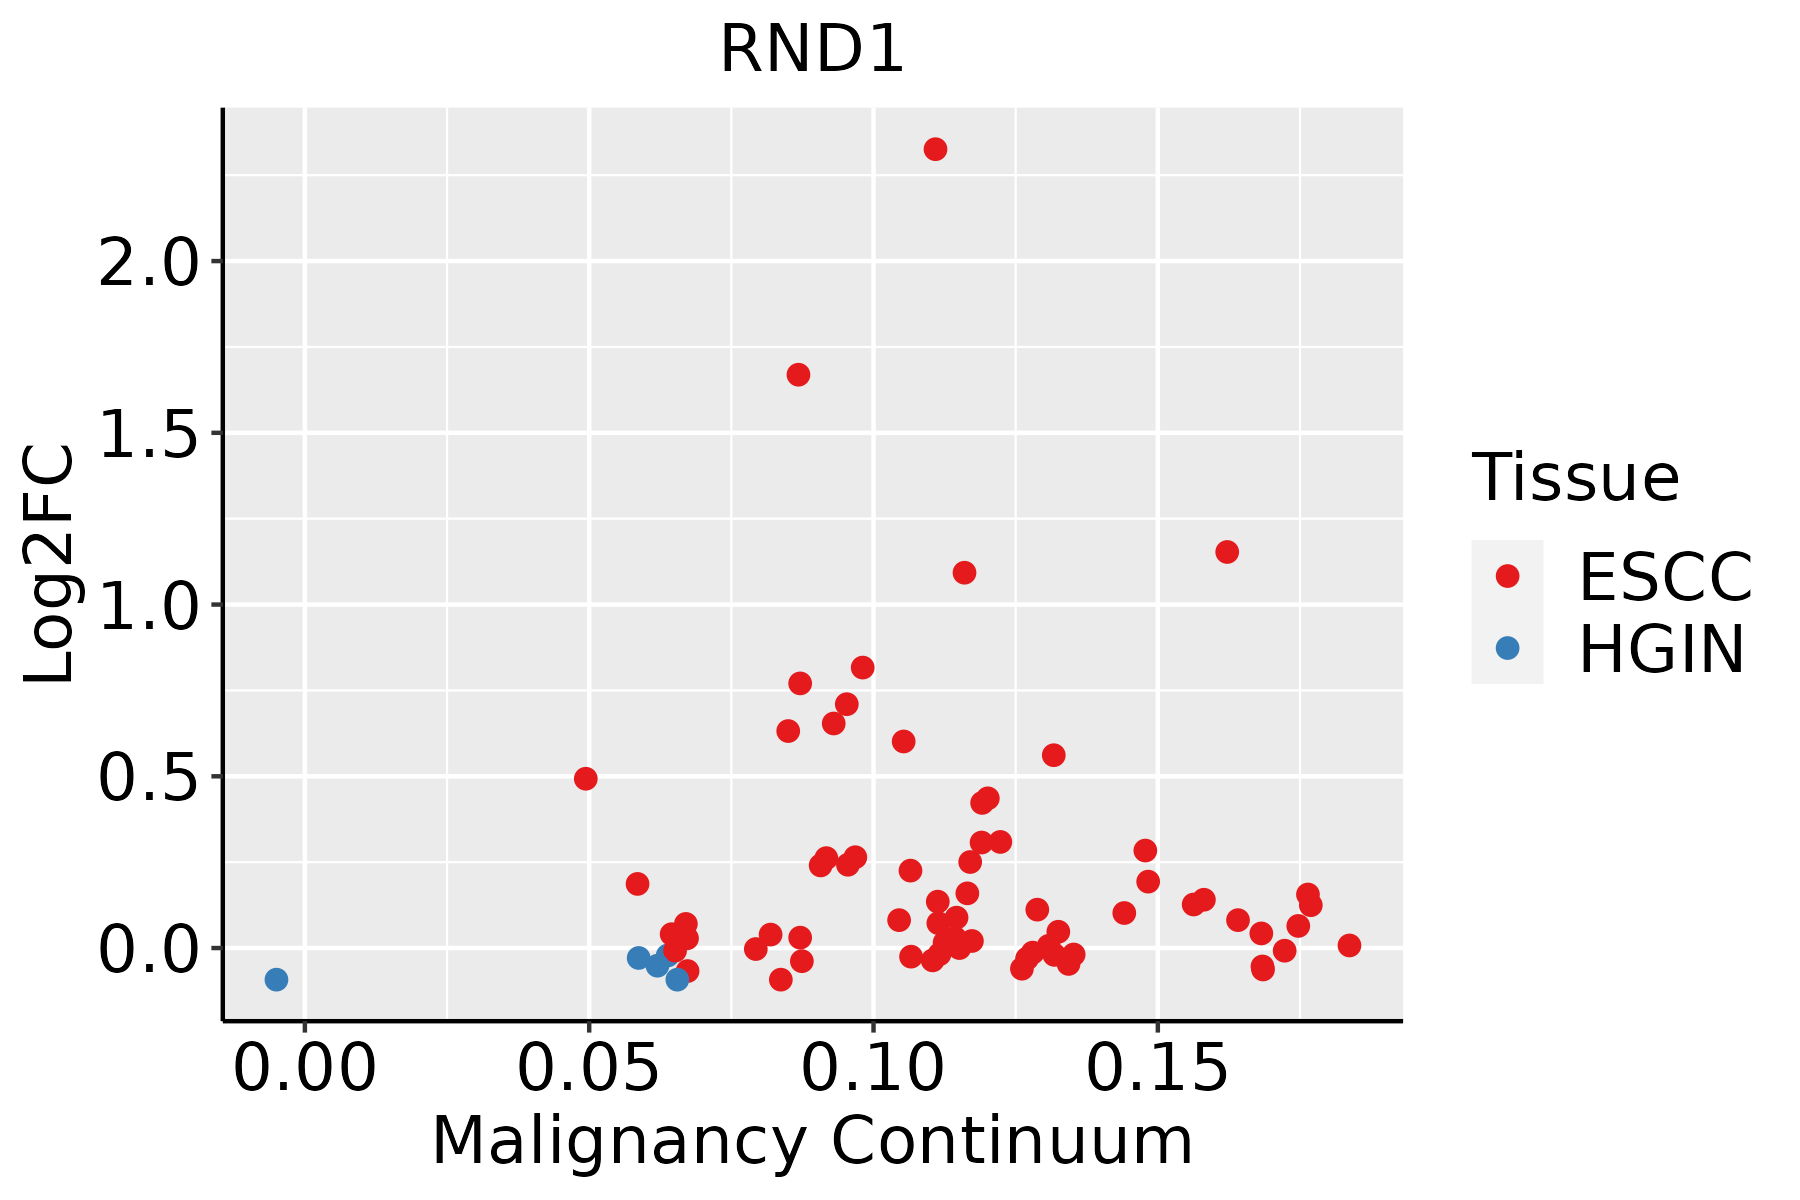 | ESCC: Esophageal squamous cell carcinoma |
| HGIN: High-grade intraepithelial neoplasias | ||
| LGIN: Low-grade intraepithelial neoplasias | ||
| Liver |  | HCC: Hepatocellular carcinoma |
| NAFLD: Non-alcoholic fatty liver disease | ||
| Oral Cavity | 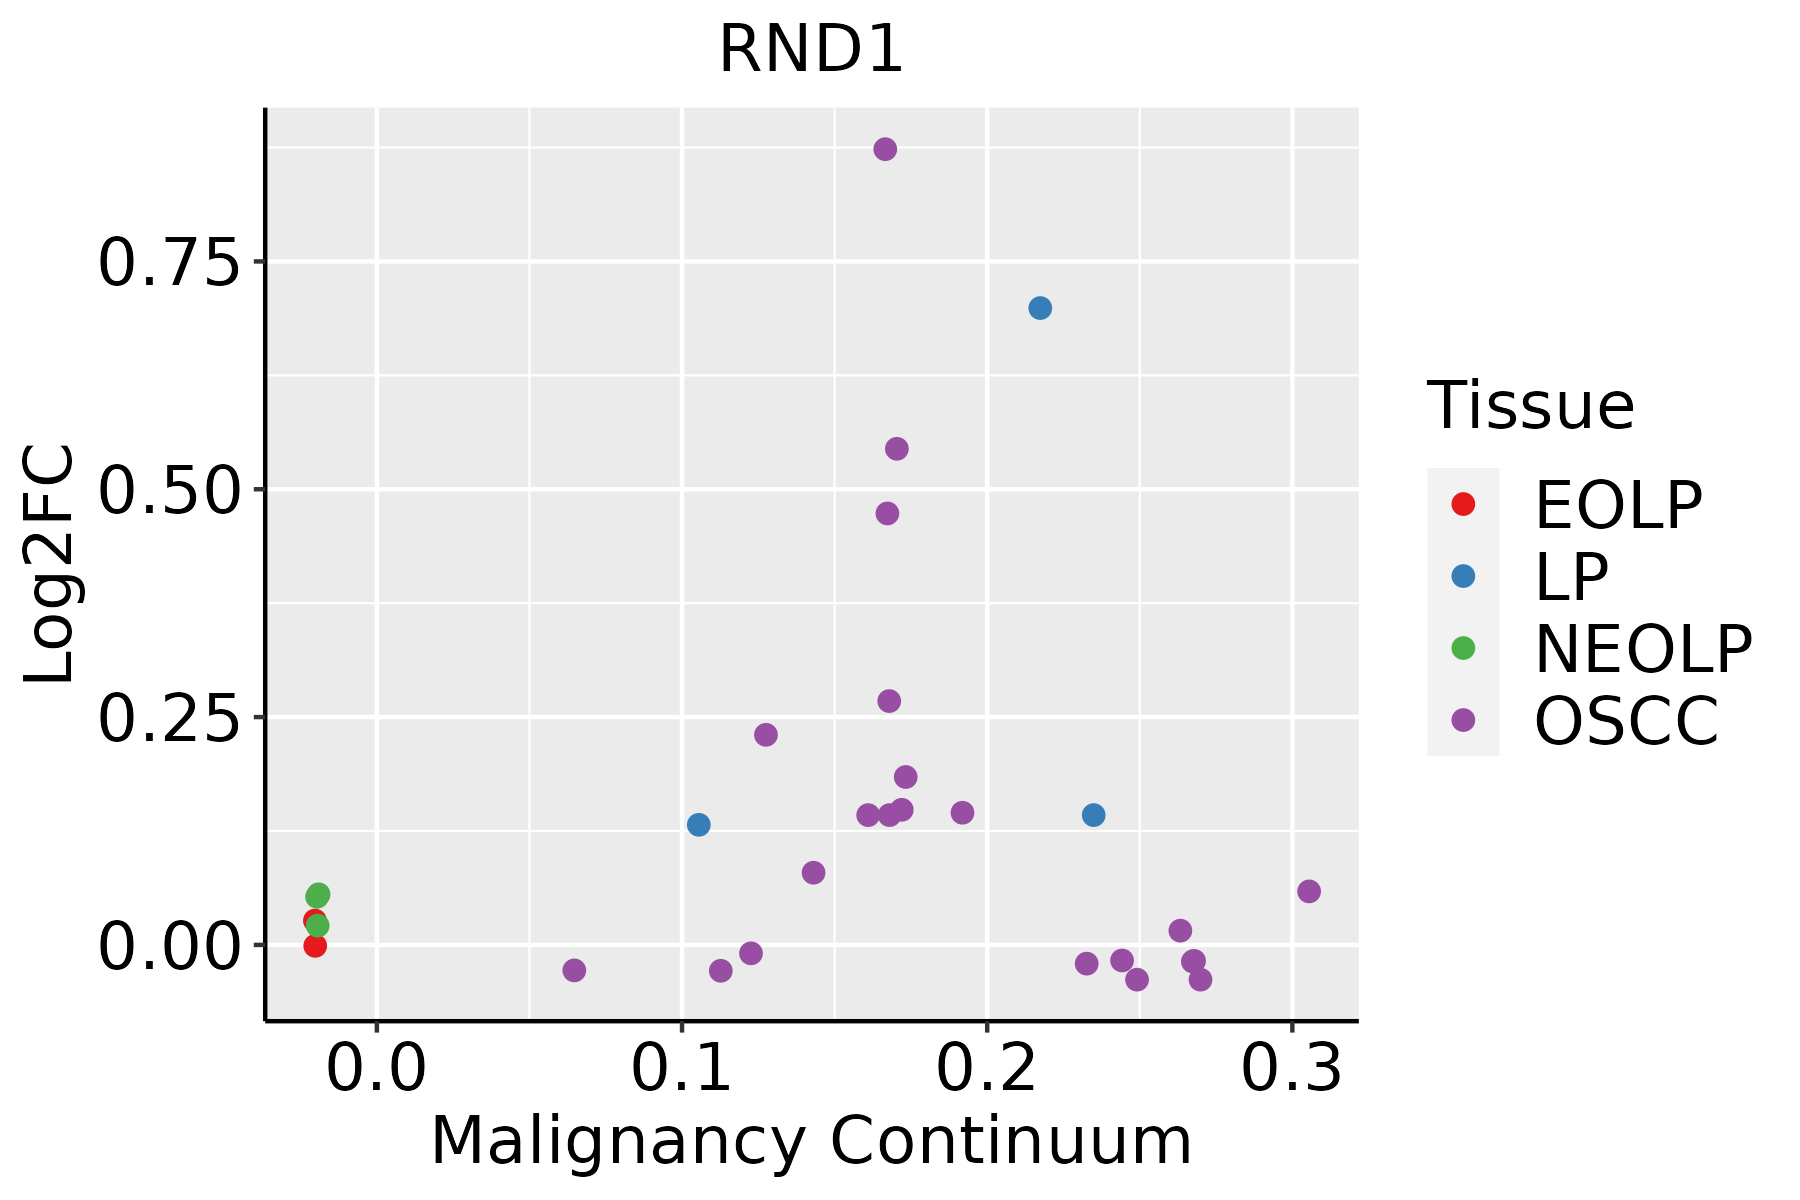 | EOLP: Erosive Oral lichen planus |
| LP: leukoplakia | ||
| NEOLP: Non-erosive oral lichen planus | ||
| OSCC: Oral squamous cell carcinoma |
| ∗log2FC in expression of this searched gene in stem-like cells from each diseased tissue sample relative to stem-like cells in normal samples in each tissue plotted against the malignancy continuum. Samples are colored based on if they are from different disease stage. |
Top |
Malignant transformation related pathway analysis |
| Find out the enriched GO biological processes and KEGG pathways involved in transition from healthy to precancer to cancer |
| Tissue | Disease Stage | Enriched GO biological Processes |
| Colorectum | AD |  |
| Colorectum | SER |  |
| Colorectum | MSS |  |
| Colorectum | MSI-H |  |
| Colorectum | FAP |  |
| ∗Top 15 enriched GO BP terms are showed in the bar plot of each disease state in each tissue. Each row represents a significant GO biological process which is colored according to the -log10(p.adjust). |
| Page: 1 2 3 4 5 6 7 8 9 |
| GO ID | Tissue | Disease Stage | Description | Gene Ratio | Bg Ratio | pvalue | p.adjust | Count |
| GO:000716320 | Esophagus | ESCC | establishment or maintenance of cell polarity | 143/8552 | 218/18723 | 2.05e-09 | 4.65e-08 | 143 |
| GO:000701527 | Esophagus | ESCC | actin filament organization | 259/8552 | 442/18723 | 2.37e-08 | 4.50e-07 | 259 |
| GO:0032970111 | Esophagus | ESCC | regulation of actin filament-based process | 231/8552 | 397/18723 | 2.91e-07 | 4.20e-06 | 231 |
| GO:0032956111 | Esophagus | ESCC | regulation of actin cytoskeleton organization | 210/8552 | 358/18723 | 4.40e-07 | 6.00e-06 | 210 |
| GO:002260420 | Esophagus | ESCC | regulation of cell morphogenesis | 180/8552 | 309/18723 | 5.19e-06 | 5.45e-05 | 180 |
| GO:003086517 | Esophagus | ESCC | cortical cytoskeleton organization | 44/8552 | 61/18723 | 2.50e-05 | 2.13e-04 | 44 |
| GO:000836018 | Esophagus | ESCC | regulation of cell shape | 92/8552 | 154/18723 | 3.00e-04 | 1.81e-03 | 92 |
| GO:000701512 | Liver | Cirrhotic | actin filament organization | 171/4634 | 442/18723 | 3.93e-11 | 2.30e-09 | 171 |
| GO:002260412 | Liver | Cirrhotic | regulation of cell morphogenesis | 127/4634 | 309/18723 | 1.45e-10 | 7.44e-09 | 127 |
| GO:003297012 | Liver | Cirrhotic | regulation of actin filament-based process | 152/4634 | 397/18723 | 1.12e-09 | 5.00e-08 | 152 |
| GO:003295612 | Liver | Cirrhotic | regulation of actin cytoskeleton organization | 136/4634 | 358/18723 | 1.47e-08 | 5.49e-07 | 136 |
| GO:000836012 | Liver | Cirrhotic | regulation of cell shape | 69/4634 | 154/18723 | 4.21e-08 | 1.36e-06 | 69 |
| GO:000716312 | Liver | Cirrhotic | establishment or maintenance of cell polarity | 82/4634 | 218/18723 | 1.55e-05 | 2.11e-04 | 82 |
| GO:00308656 | Liver | Cirrhotic | cortical cytoskeleton organization | 30/4634 | 61/18723 | 3.16e-05 | 3.93e-04 | 30 |
| GO:00071624 | Liver | Cirrhotic | negative regulation of cell adhesion | 93/4634 | 303/18723 | 1.06e-02 | 4.66e-02 | 93 |
| GO:002260422 | Liver | HCC | regulation of cell morphogenesis | 188/7958 | 309/18723 | 4.84e-11 | 1.82e-09 | 188 |
| GO:000701522 | Liver | HCC | actin filament organization | 252/7958 | 442/18723 | 3.83e-10 | 1.25e-08 | 252 |
| GO:000716322 | Liver | HCC | establishment or maintenance of cell polarity | 133/7958 | 218/18723 | 2.48e-08 | 5.73e-07 | 133 |
| GO:003297022 | Liver | HCC | regulation of actin filament-based process | 222/7958 | 397/18723 | 3.81e-08 | 8.30e-07 | 222 |
| GO:003086512 | Liver | HCC | cortical cytoskeleton organization | 47/7958 | 61/18723 | 4.03e-08 | 8.69e-07 | 47 |
| Page: 1 2 |
| Pathway ID | Tissue | Disease Stage | Description | Gene Ratio | Bg Ratio | pvalue | p.adjust | qvalue | Count |
| hsa0436016 | Esophagus | ESCC | Axon guidance | 108/4205 | 182/8465 | 5.13e-03 | 1.30e-02 | 6.67e-03 | 108 |
| hsa0436017 | Esophagus | ESCC | Axon guidance | 108/4205 | 182/8465 | 5.13e-03 | 1.30e-02 | 6.67e-03 | 108 |
| Page: 1 |
Top |
Cell-cell communication analysis |
| Identification of potential cell-cell interactions between two cell types and their ligand-receptor pairs for different disease states |
| Ligand | Receptor | LRpair | Pathway | Tissue | Disease Stage |
| Page: 1 |
Top |
Single-cell gene regulatory network inference analysis |
| Find out the significant the regulons (TFs) and the target genes of each regulon across cell types for different disease states |
| TF | Cell Type | Tissue | Disease Stage | Target Gene | RSS | Regulon Activity |
| ∗The dot plots of a searched regulon are shown for all cell subpopulations in each disease state of each tissue based on the regulon specific score inferred using pySCENIC and by calculating the average expression. |
| Page: 1 |
Top |
Somatic mutation of malignant transformation related genes |
| Annotation of somatic variants for genes involved in malignant transformation |
| Hugo Symbol | Variant Class | Variant Classification | dbSNP RS | HGVSc | HGVSp | HGVSp Short | SWISSPROT | BIOTYPE | SIFT | PolyPhen | Tumor Sample Barcode | Tissue | Histology | Sex | Age | Stage | Therapy Types | Drugs | Outcome |
| RND1 | SNV | Missense_Mutation | novel | c.586C>A | p.Gln196Lys | p.Q196K | Q92730 | protein_coding | tolerated(1) | benign(0) | TCGA-A7-A0DB-01 | Breast | breast invasive carcinoma | Female | <65 | I/II | Hormone Therapy | arimidex | SD |
| RND1 | SNV | Missense_Mutation | c.651C>G | p.Ile217Met | p.I217M | Q92730 | protein_coding | tolerated(0.29) | benign(0.06) | TCGA-AQ-A04H-01 | Breast | breast invasive carcinoma | Female | <65 | III/IV | Chemotherapy | taxotere | SD | |
| RND1 | insertion | In_Frame_Ins | novel | c.616_617insCCCCCCGCTCCAGAGGAAGGAAAGCTGTGG | p.Arg206delinsProProArgSerArgGlyArgLysAlaValGly | p.R206delinsPPRSRGRKAVG | Q92730 | protein_coding | TCGA-BH-A0EE-01 | Breast | breast invasive carcinoma | Female | >=65 | I/II | Chemotherapy | docetaxel | SD | ||
| RND1 | SNV | Missense_Mutation | c.378N>C | p.Lys126Asn | p.K126N | Q92730 | protein_coding | deleterious(0) | probably_damaging(0.994) | TCGA-EK-A2PG-01 | Cervix | cervical & endocervical cancer | Female | >=65 | I/II | Unknown | Unknown | SD | |
| RND1 | SNV | Missense_Mutation | novel | c.574A>G | p.Ser192Gly | p.S192G | Q92730 | protein_coding | tolerated(0.59) | benign(0) | TCGA-AA-3952-01 | Colorectum | colon adenocarcinoma | Male | >=65 | III/IV | Unknown | Unknown | PD |
| RND1 | SNV | Missense_Mutation | novel | c.395N>G | p.Asp132Gly | p.D132G | Q92730 | protein_coding | deleterious(0) | probably_damaging(0.993) | TCGA-AA-A00N-01 | Colorectum | colon adenocarcinoma | Male | >=65 | I/II | Unknown | Unknown | PD |
| RND1 | SNV | Missense_Mutation | rs764356367 | c.287N>A | p.Arg96His | p.R96H | Q92730 | protein_coding | deleterious(0.02) | probably_damaging(0.988) | TCGA-AJ-A3BH-01 | Endometrium | uterine corpus endometrioid carcinoma | Female | Unknown | I/II | Unknown | Unknown | SD |
| RND1 | SNV | Missense_Mutation | rs769890484 | c.307N>A | p.Ala103Thr | p.A103T | Q92730 | protein_coding | deleterious(0) | benign(0.072) | TCGA-AJ-A3EK-01 | Endometrium | uterine corpus endometrioid carcinoma | Female | <65 | I/II | Chemotherapy | carboplatin | CR |
| RND1 | SNV | Missense_Mutation | c.641N>T | p.Ser214Phe | p.S214F | Q92730 | protein_coding | deleterious(0.01) | benign(0.205) | TCGA-AP-A0LM-01 | Endometrium | uterine corpus endometrioid carcinoma | Female | <65 | III/IV | Chemotherapy | cisplatin | SD | |
| RND1 | SNV | Missense_Mutation | rs769890484 | c.307G>A | p.Ala103Thr | p.A103T | Q92730 | protein_coding | deleterious(0) | benign(0.072) | TCGA-AX-A2HD-01 | Endometrium | uterine corpus endometrioid carcinoma | Female | >=65 | III/IV | Unknown | Unknown | SD |
| Page: 1 2 3 |
Top |
Related drugs of malignant transformation related genes |
| Identification of chemicals and drugs interact with genes involved in malignant transfromation |
| (DGIdb 4.0) |
| Entrez ID | Symbol | Category | Interaction Types | Drug Claim Name | Drug Name | PMIDs |
| Page: 1 |

Copyright 2023-Present -The University of Texas Health Science Center at Houston |