
|
|||||
|
 | |
| |
| |
| |
| |
| |
|
Gene: RNASET2 |
Gene summary for RNASET2 |
| Gene information | Species | Human | Gene symbol | RNASET2 | Gene ID | 8635 |
| Gene name | ribonuclease T2 | |
| Gene Alias | RNASE6PL | |
| Cytomap | 6q27 | |
| Gene Type | protein-coding | GO ID | GO:0002376 | UniProtAcc | O00584 |
Top |
Malignant transformation analysis |
| Identification of the aberrant gene expression in precancerous and cancerous lesions by comparing the gene expression of stem-like cells in diseased tissues with normal stem cells |
| Entrez ID | Symbol | Replicates | Species | Organ | Tissue | Adj P-value | Log2FC | Malignancy |
| 8635 | RNASET2 | GSM4909281 | Human | Breast | IDC | 2.08e-10 | 3.44e-01 | 0.21 |
| 8635 | RNASET2 | GSM4909286 | Human | Breast | IDC | 3.99e-11 | 3.10e-01 | 0.1081 |
| 8635 | RNASET2 | GSM4909293 | Human | Breast | IDC | 5.69e-10 | 1.87e-01 | 0.1581 |
| 8635 | RNASET2 | GSM4909298 | Human | Breast | IDC | 6.72e-06 | 1.55e-01 | 0.1551 |
| 8635 | RNASET2 | GSM4909306 | Human | Breast | IDC | 6.29e-20 | 5.83e-01 | 0.1564 |
| 8635 | RNASET2 | GSM4909308 | Human | Breast | IDC | 2.76e-06 | 2.29e-01 | 0.158 |
| 8635 | RNASET2 | GSM4909311 | Human | Breast | IDC | 1.25e-07 | -9.12e-03 | 0.1534 |
| 8635 | RNASET2 | GSM4909317 | Human | Breast | IDC | 3.28e-11 | 3.62e-01 | 0.1355 |
| 8635 | RNASET2 | GSM4909319 | Human | Breast | IDC | 1.05e-10 | -1.71e-01 | 0.1563 |
| 8635 | RNASET2 | M1 | Human | Breast | IDC | 1.80e-02 | 2.18e-01 | 0.1577 |
| 8635 | RNASET2 | NCCBC11 | Human | Breast | DCIS | 3.07e-13 | 7.90e-01 | 0.1232 |
| 8635 | RNASET2 | NCCBC14 | Human | Breast | DCIS | 1.77e-07 | 2.77e-01 | 0.2021 |
| 8635 | RNASET2 | NCCBC3 | Human | Breast | DCIS | 1.12e-07 | 4.67e-01 | 0.1198 |
| 8635 | RNASET2 | NCCBC5 | Human | Breast | DCIS | 1.48e-10 | 3.11e-01 | 0.2046 |
| 8635 | RNASET2 | P1 | Human | Breast | IDC | 4.75e-03 | -8.48e-02 | 0.1527 |
| 8635 | RNASET2 | DCIS2 | Human | Breast | DCIS | 4.13e-37 | 3.08e-02 | 0.0085 |
| 8635 | RNASET2 | CA_HPV_1 | Human | Cervix | CC | 2.83e-12 | 2.91e-01 | 0.0264 |
| 8635 | RNASET2 | CA_HPV_3 | Human | Cervix | CC | 6.80e-03 | 1.92e-01 | 0.0414 |
| 8635 | RNASET2 | CCI_1 | Human | Cervix | CC | 1.50e-13 | -7.21e-01 | 0.528 |
| 8635 | RNASET2 | CCI_2 | Human | Cervix | CC | 1.72e-12 | -7.21e-01 | 0.5249 |
| Page: 1 2 3 4 5 6 7 8 9 10 11 |
| Tissue | Expression Dynamics | Abbreviation |
| Breast | 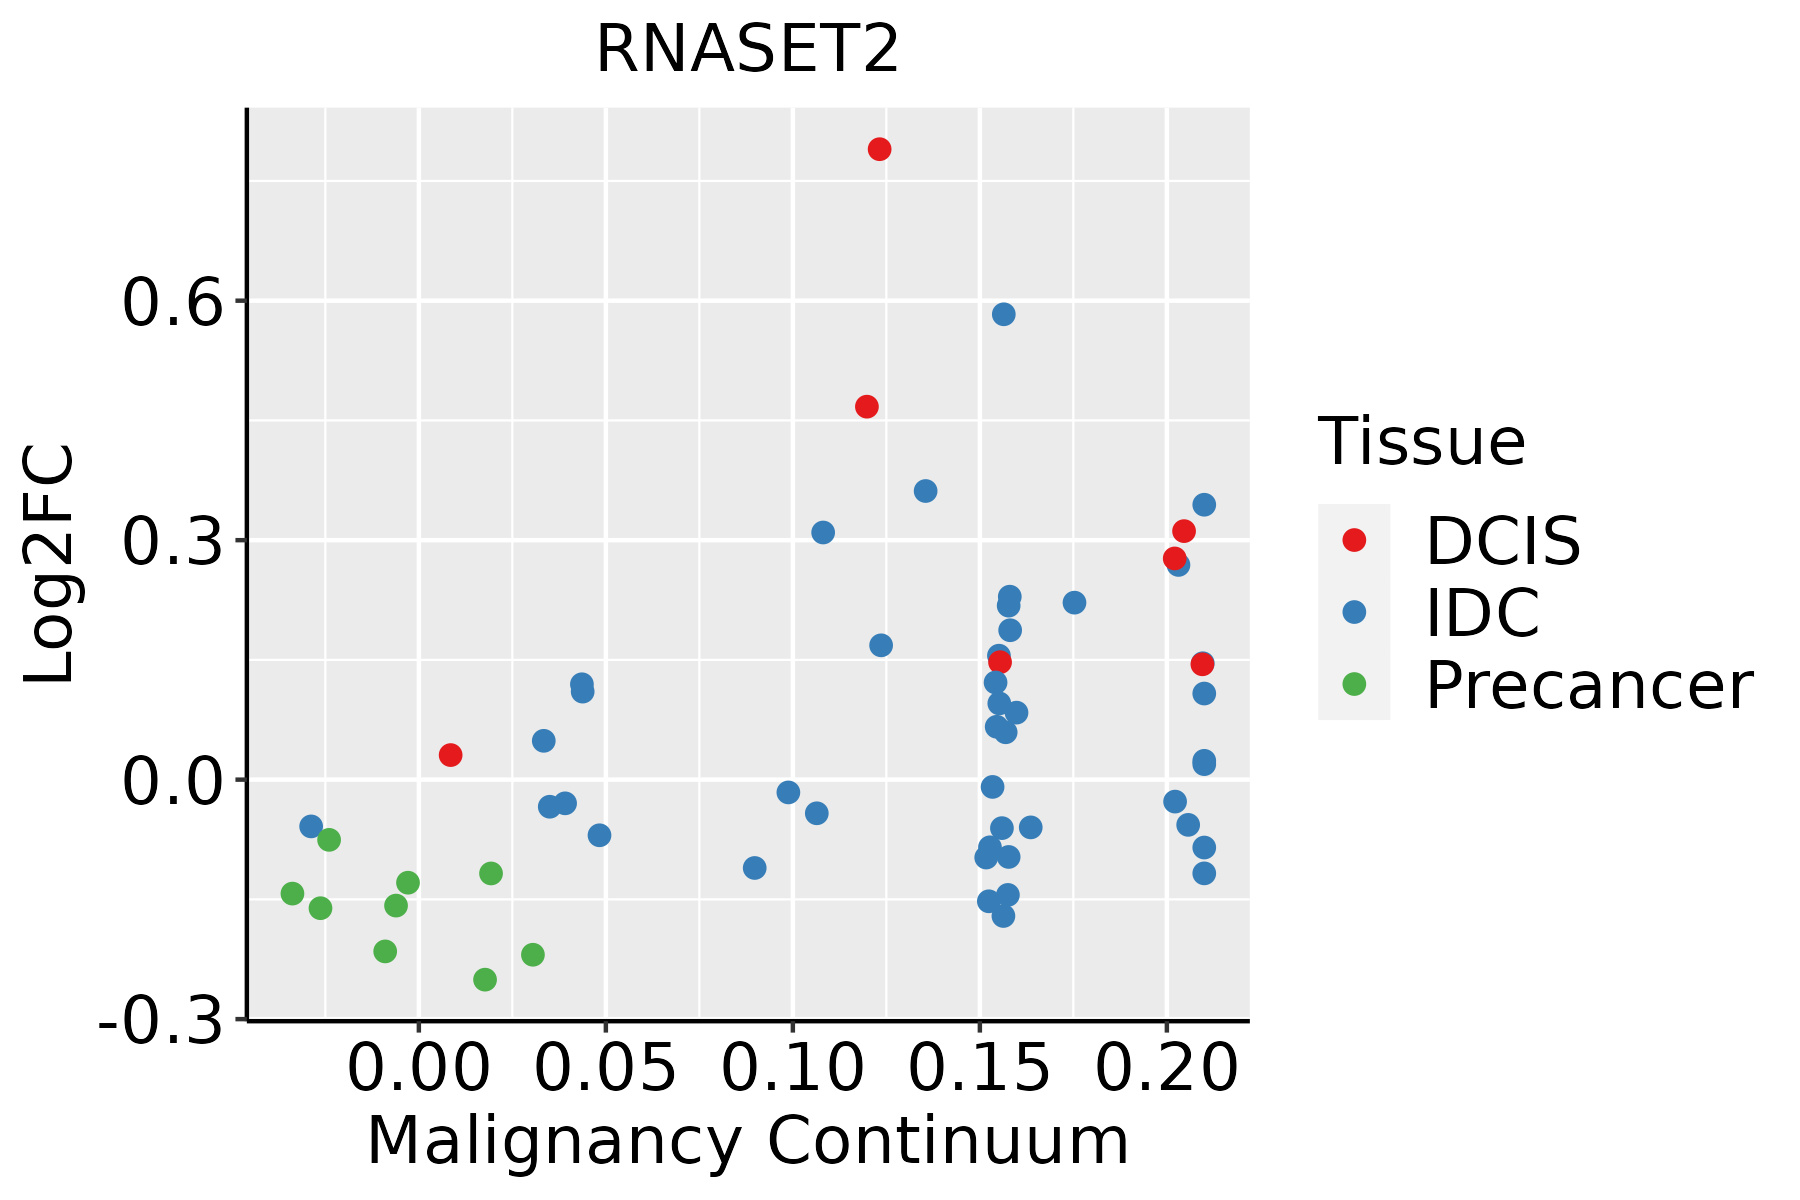 | IDC: Invasive ductal carcinoma |
| DCIS: Ductal carcinoma in situ | ||
| Precancer(BRCA1-mut): Precancerous lesion from BRCA1 mutation carriers | ||
| Cervix |  | CC: Cervix cancer |
| HSIL_HPV: HPV-infected high-grade squamous intraepithelial lesions | ||
| N_HPV: HPV-infected normal cervix | ||
| Colorectum (GSE201348) |  | FAP: Familial adenomatous polyposis |
| CRC: Colorectal cancer | ||
| Colorectum (HTA11) |  | AD: Adenomas |
| SER: Sessile serrated lesions | ||
| MSI-H: Microsatellite-high colorectal cancer | ||
| MSS: Microsatellite stable colorectal cancer | ||
| Endometrium | 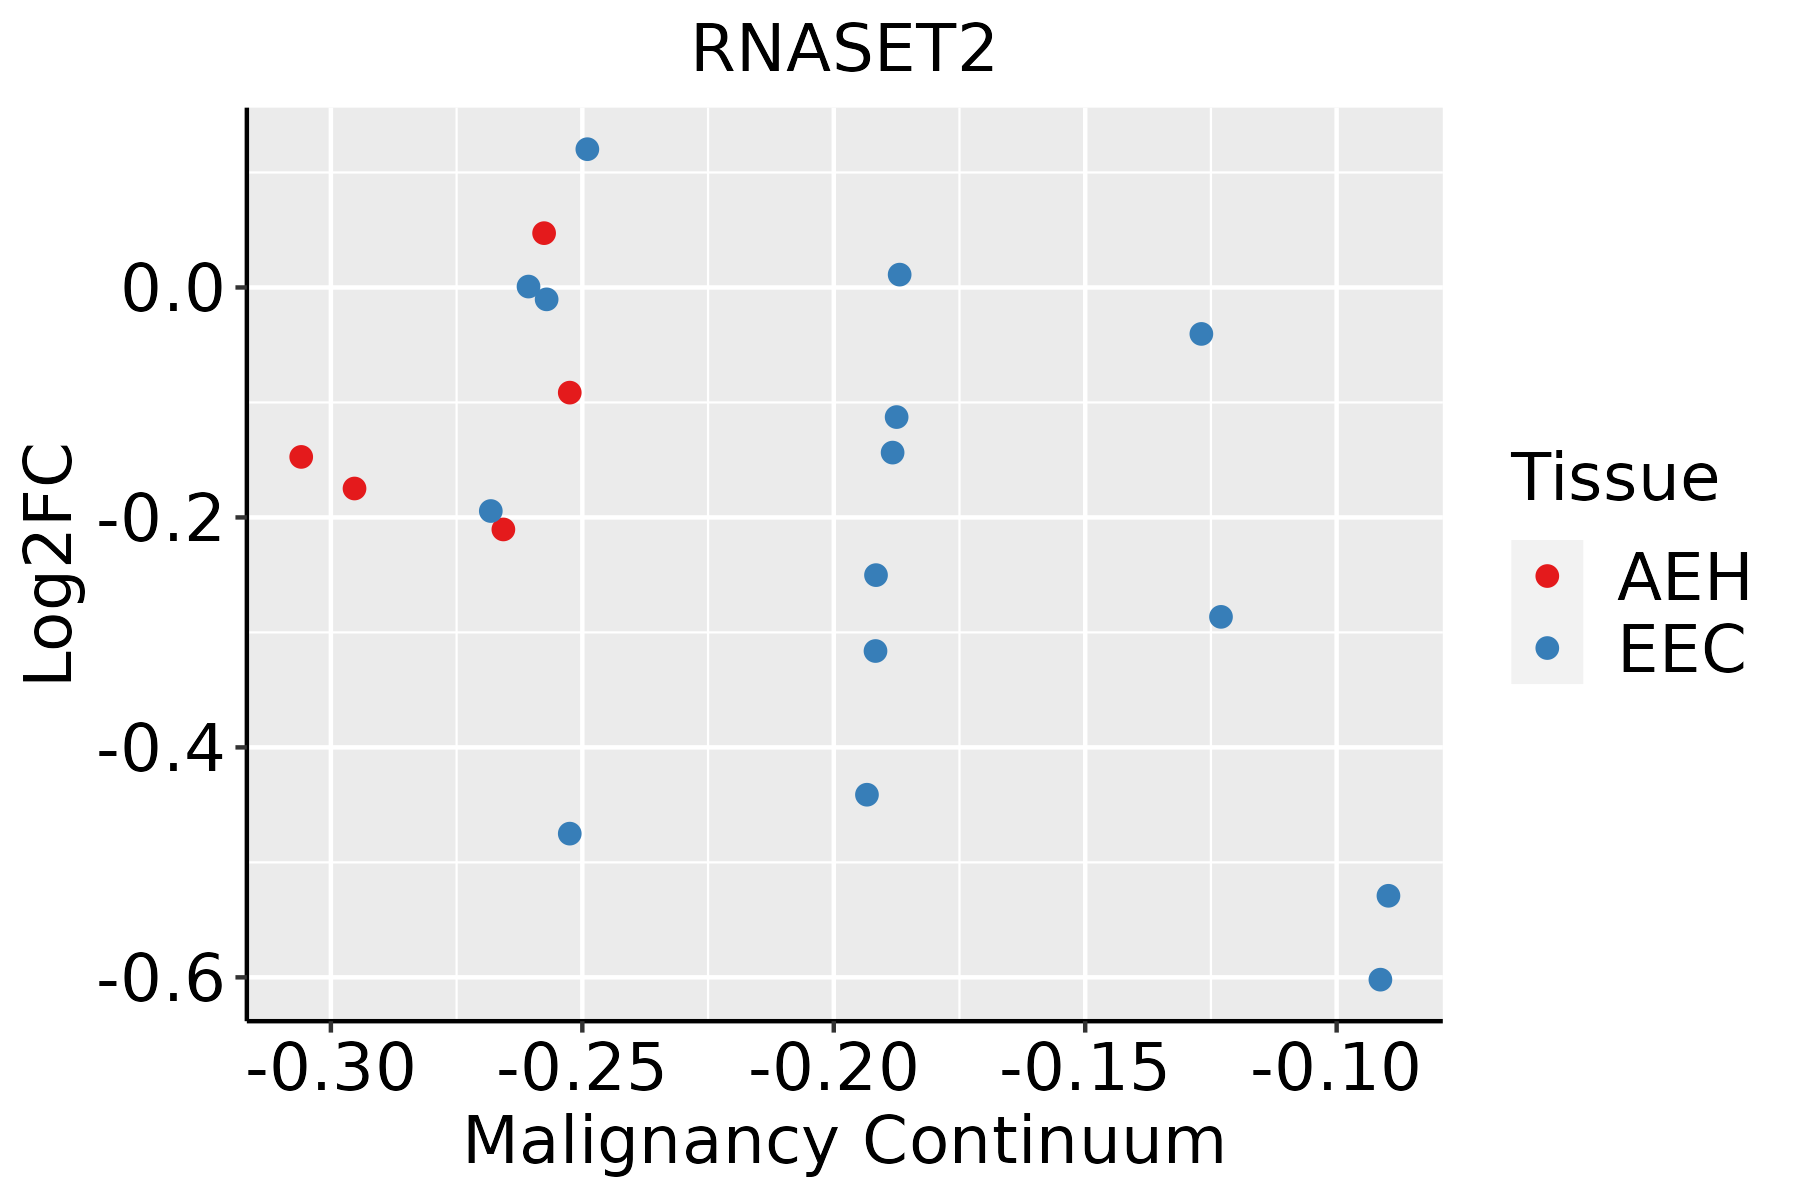 | AEH: Atypical endometrial hyperplasia |
| EEC: Endometrioid Cancer | ||
| Esophagus |  | ESCC: Esophageal squamous cell carcinoma |
| HGIN: High-grade intraepithelial neoplasias | ||
| LGIN: Low-grade intraepithelial neoplasias | ||
| Liver |  | HCC: Hepatocellular carcinoma |
| NAFLD: Non-alcoholic fatty liver disease | ||
| Oral Cavity |  | EOLP: Erosive Oral lichen planus |
| LP: leukoplakia | ||
| NEOLP: Non-erosive oral lichen planus | ||
| OSCC: Oral squamous cell carcinoma | ||
| Prostate | 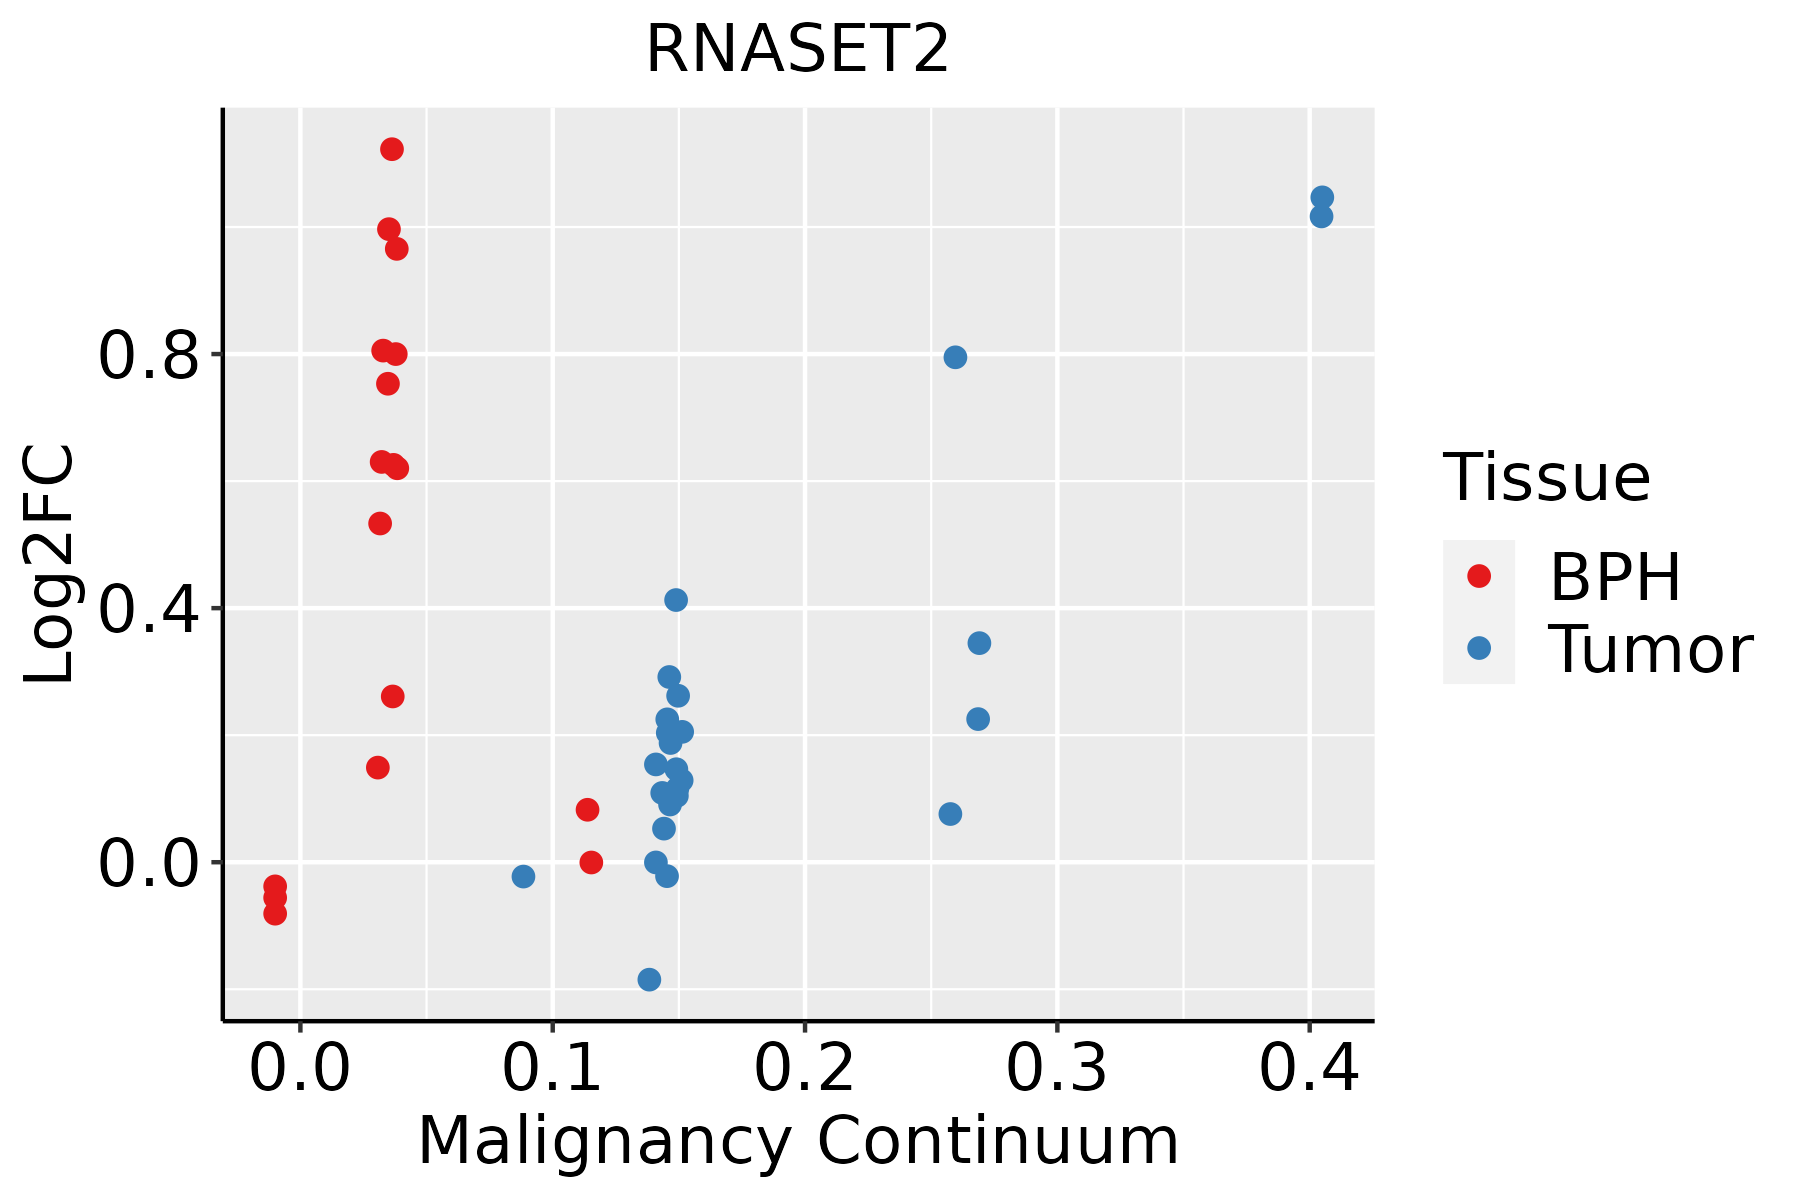 | BPH: Benign Prostatic Hyperplasia |
| Skin | 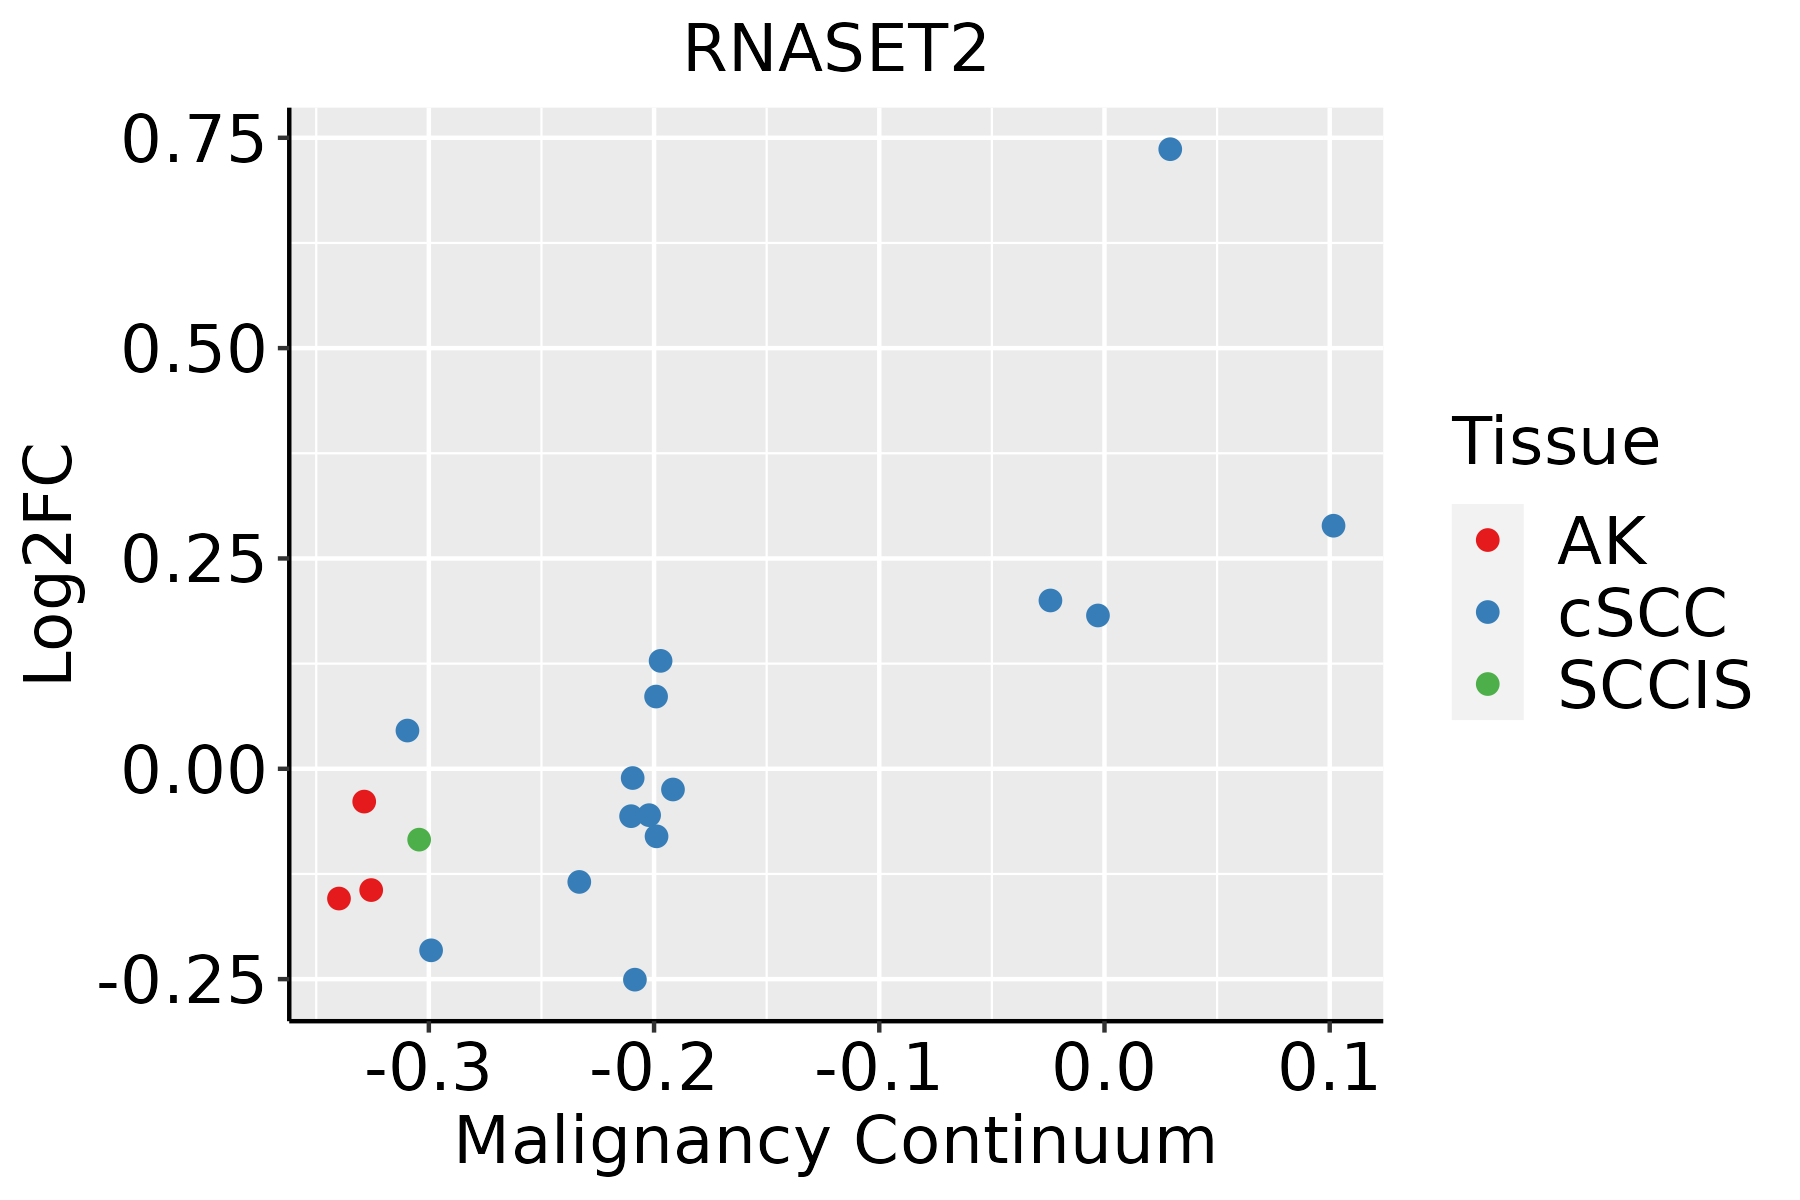 | AK: Actinic keratosis |
| cSCC: Cutaneous squamous cell carcinoma | ||
| SCCIS:squamous cell carcinoma in situ | ||
| Thyroid | 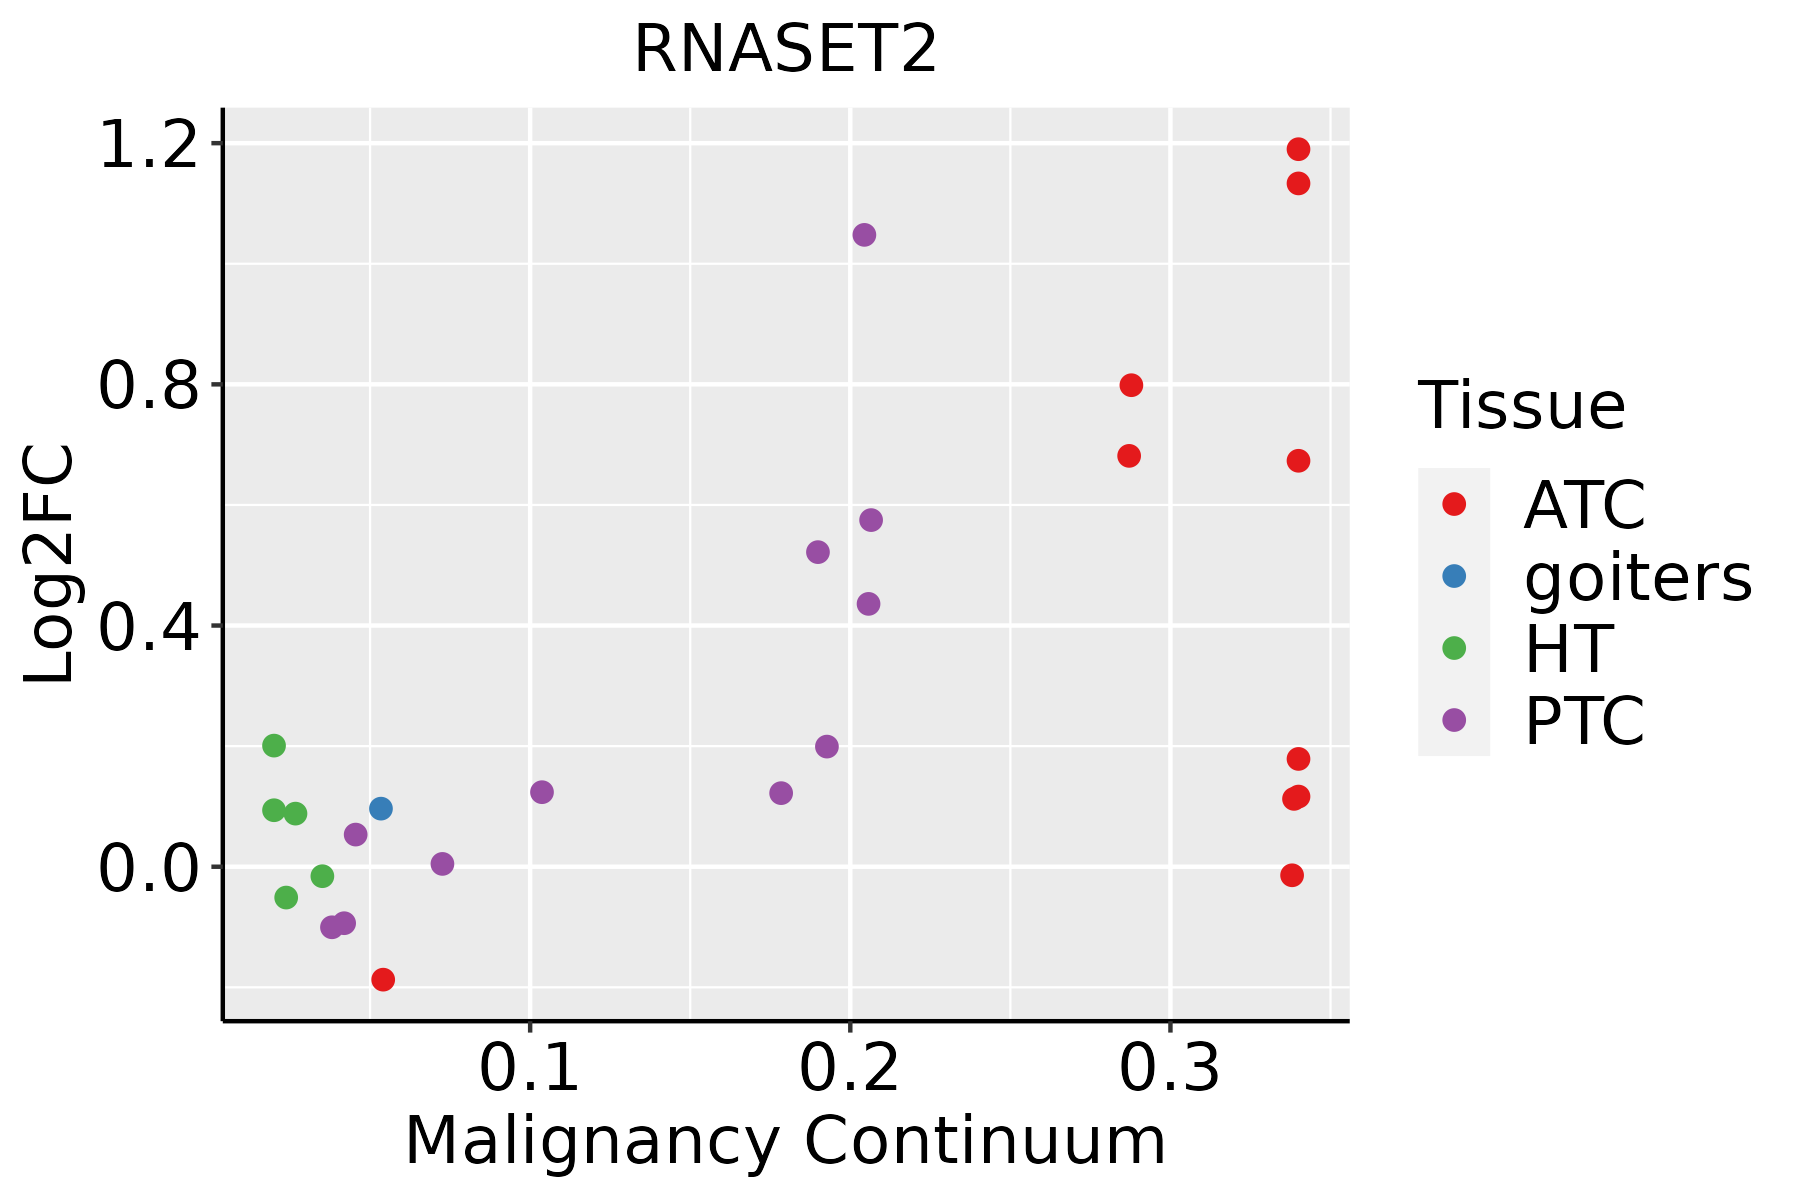 | ATC: Anaplastic thyroid cancer |
| HT: Hashimoto's thyroiditis | ||
| PTC: Papillary thyroid cancer |
| ∗log2FC in expression of this searched gene in stem-like cells from each diseased tissue sample relative to stem-like cells in normal samples in each tissue plotted against the malignancy continuum. Samples are colored based on if they are from different disease stage. |
Top |
Malignant transformation related pathway analysis |
| Find out the enriched GO biological processes and KEGG pathways involved in transition from healthy to precancer to cancer |
| Tissue | Disease Stage | Enriched GO biological Processes |
| Colorectum | AD |  |
| Colorectum | SER |  |
| Colorectum | MSS |  |
| Colorectum | MSI-H |  |
| Colorectum | FAP |  |
| ∗Top 15 enriched GO BP terms are showed in the bar plot of each disease state in each tissue. Each row represents a significant GO biological process which is colored according to the -log10(p.adjust). |
| Page: 1 2 3 4 5 6 7 8 9 |
| GO ID | Tissue | Disease Stage | Description | Gene Ratio | Bg Ratio | pvalue | p.adjust | Count |
| GO:000640113 | Breast | IDC | RNA catabolic process | 38/1434 | 278/18723 | 3.54e-04 | 5.16e-03 | 38 |
| GO:190136112 | Breast | IDC | organic cyclic compound catabolic process | 56/1434 | 495/18723 | 2.12e-03 | 1.99e-02 | 56 |
| GO:004670012 | Breast | IDC | heterocycle catabolic process | 51/1434 | 445/18723 | 2.51e-03 | 2.25e-02 | 51 |
| GO:003465513 | Breast | IDC | nucleobase-containing compound catabolic process | 47/1434 | 407/18723 | 3.12e-03 | 2.63e-02 | 47 |
| GO:004427012 | Breast | IDC | cellular nitrogen compound catabolic process | 50/1434 | 451/18723 | 5.29e-03 | 3.93e-02 | 50 |
| GO:001943912 | Breast | IDC | aromatic compound catabolic process | 51/1434 | 467/18723 | 6.54e-03 | 4.59e-02 | 51 |
| GO:000640123 | Breast | DCIS | RNA catabolic process | 38/1390 | 278/18723 | 1.91e-04 | 3.08e-03 | 38 |
| GO:003465522 | Breast | DCIS | nucleobase-containing compound catabolic process | 47/1390 | 407/18723 | 1.69e-03 | 1.68e-02 | 47 |
| GO:190136122 | Breast | DCIS | organic cyclic compound catabolic process | 55/1390 | 495/18723 | 1.75e-03 | 1.71e-02 | 55 |
| GO:004670022 | Breast | DCIS | heterocycle catabolic process | 50/1390 | 445/18723 | 2.19e-03 | 2.03e-02 | 50 |
| GO:001943922 | Breast | DCIS | aromatic compound catabolic process | 51/1390 | 467/18723 | 3.58e-03 | 2.92e-02 | 51 |
| GO:004427022 | Breast | DCIS | cellular nitrogen compound catabolic process | 49/1390 | 451/18723 | 4.68e-03 | 3.56e-02 | 49 |
| GO:00064019 | Cervix | CC | RNA catabolic process | 62/2311 | 278/18723 | 2.18e-06 | 6.56e-05 | 62 |
| GO:00467008 | Cervix | CC | heterocycle catabolic process | 80/2311 | 445/18723 | 3.23e-04 | 3.42e-03 | 80 |
| GO:00346559 | Cervix | CC | nucleobase-containing compound catabolic process | 74/2311 | 407/18723 | 3.77e-04 | 3.88e-03 | 74 |
| GO:00442709 | Cervix | CC | cellular nitrogen compound catabolic process | 79/2311 | 451/18723 | 7.80e-04 | 6.91e-03 | 79 |
| GO:00194398 | Cervix | CC | aromatic compound catabolic process | 79/2311 | 467/18723 | 2.14e-03 | 1.54e-02 | 79 |
| GO:19013618 | Cervix | CC | organic cyclic compound catabolic process | 80/2311 | 495/18723 | 6.77e-03 | 3.72e-02 | 80 |
| GO:0006401 | Colorectum | AD | RNA catabolic process | 102/3918 | 278/18723 | 8.64e-10 | 6.76e-08 | 102 |
| GO:0044270 | Colorectum | AD | cellular nitrogen compound catabolic process | 147/3918 | 451/18723 | 3.35e-09 | 2.23e-07 | 147 |
| Page: 1 2 3 4 5 6 7 |
| Pathway ID | Tissue | Disease Stage | Description | Gene Ratio | Bg Ratio | pvalue | p.adjust | qvalue | Count |
| Page: 1 |
Top |
Cell-cell communication analysis |
| Identification of potential cell-cell interactions between two cell types and their ligand-receptor pairs for different disease states |
| Ligand | Receptor | LRpair | Pathway | Tissue | Disease Stage |
| Page: 1 |
Top |
Single-cell gene regulatory network inference analysis |
| Find out the significant the regulons (TFs) and the target genes of each regulon across cell types for different disease states |
| TF | Cell Type | Tissue | Disease Stage | Target Gene | RSS | Regulon Activity |
| ∗The dot plots of a searched regulon are shown for all cell subpopulations in each disease state of each tissue based on the regulon specific score inferred using pySCENIC and by calculating the average expression. |
| Page: 1 |
Top |
Somatic mutation of malignant transformation related genes |
| Annotation of somatic variants for genes involved in malignant transformation |
| Hugo Symbol | Variant Class | Variant Classification | dbSNP RS | HGVSc | HGVSp | HGVSp Short | SWISSPROT | BIOTYPE | SIFT | PolyPhen | Tumor Sample Barcode | Tissue | Histology | Sex | Age | Stage | Therapy Types | Drugs | Outcome |
| RNASET2 | SNV | Missense_Mutation | c.97G>A | p.Glu33Lys | p.E33K | O00584 | protein_coding | tolerated(0.19) | benign(0.091) | TCGA-AC-A23H-01 | Breast | breast invasive carcinoma | Female | >=65 | I/II | Unknown | Unknown | PD | |
| RNASET2 | SNV | Missense_Mutation | novel | c.533N>A | p.Val178Glu | p.V178E | O00584 | protein_coding | deleterious(0) | probably_damaging(0.989) | TCGA-EW-A6SB-01 | Breast | breast invasive carcinoma | Female | <65 | I/II | Unknown | Unknown | SD |
| RNASET2 | insertion | In_Frame_Ins | novel | c.462_463insAGG | p.Leu154_Gly155insArg | p.L154_G155insR | O00584 | protein_coding | TCGA-B6-A0I2-01 | Breast | breast invasive carcinoma | Female | <65 | I/II | Unknown | Unknown | SD | ||
| RNASET2 | insertion | In_Frame_Ins | novel | c.460_461insATGGGACCAGTTGCTTCT | p.Lys153_Leu154insTyrGlyThrSerCysPhe | p.K153_L154insYGTSCF | O00584 | protein_coding | TCGA-B6-A0I2-01 | Breast | breast invasive carcinoma | Female | <65 | I/II | Unknown | Unknown | SD | ||
| RNASET2 | SNV | Missense_Mutation | novel | c.685G>A | p.Ala229Thr | p.A229T | O00584 | protein_coding | tolerated(0.41) | benign(0.003) | TCGA-EA-A410-01 | Cervix | cervical & endocervical cancer | Female | <65 | I/II | Unknown | Unknown | SD |
| RNASET2 | SNV | Missense_Mutation | c.518N>T | p.Ala173Val | p.A173V | O00584 | protein_coding | tolerated(1) | benign(0.007) | TCGA-AA-3715-01 | Colorectum | colon adenocarcinoma | Male | >=65 | I/II | Unknown | Unknown | PD | |
| RNASET2 | SNV | Missense_Mutation | c.550T>A | p.Cys184Ser | p.C184S | O00584 | protein_coding | deleterious(0) | probably_damaging(1) | TCGA-AA-A02H-01 | Colorectum | colon adenocarcinoma | Female | >=65 | III/IV | Unknown | Unknown | PD | |
| RNASET2 | SNV | Missense_Mutation | novel | c.508N>T | p.Asp170Tyr | p.D170Y | O00584 | protein_coding | deleterious(0) | possibly_damaging(0.747) | TCGA-AG-A002-01 | Colorectum | rectum adenocarcinoma | Male | <65 | I/II | Unknown | Unknown | SD |
| RNASET2 | SNV | Missense_Mutation | novel | c.265C>A | p.Leu89Ile | p.L89I | O00584 | protein_coding | tolerated(0.14) | possibly_damaging(0.858) | TCGA-F5-6814-01 | Colorectum | rectum adenocarcinoma | Male | <65 | I/II | Unknown | Unknown | SD |
| RNASET2 | SNV | Missense_Mutation | novel | c.401N>G | p.Tyr134Cys | p.Y134C | O00584 | protein_coding | deleterious(0) | probably_damaging(1) | TCGA-A5-A1OF-01 | Endometrium | uterine corpus endometrioid carcinoma | Female | <65 | I/II | Unknown | Unknown | SD |
| Page: 1 2 3 |
Top |
Related drugs of malignant transformation related genes |
| Identification of chemicals and drugs interact with genes involved in malignant transfromation |
| (DGIdb 4.0) |
| Entrez ID | Symbol | Category | Interaction Types | Drug Claim Name | Drug Name | PMIDs |
| Page: 1 |

Copyright 2023-Present -The University of Texas Health Science Center at Houston |