
|
|||||
|
 | |
| |
| |
| |
| |
| |
|
Gene: RNASEK |
Gene summary for RNASEK |
| Gene information | Species | Human | Gene symbol | RNASEK | Gene ID | 440400 |
| Gene name | ribonuclease K | |
| Gene Alias | RNASEK | |
| Cytomap | 17p13.1 | |
| Gene Type | protein-coding | GO ID | GO:0006139 | UniProtAcc | Q6P5S7 |
Top |
Malignant transformation analysis |
| Identification of the aberrant gene expression in precancerous and cancerous lesions by comparing the gene expression of stem-like cells in diseased tissues with normal stem cells |
| Entrez ID | Symbol | Replicates | Species | Organ | Tissue | Adj P-value | Log2FC | Malignancy |
| 440400 | RNASEK | sample1 | Human | Cervix | CC | 1.88e-12 | 5.95e-01 | 0.0959 |
| 440400 | RNASEK | sample3 | Human | Cervix | CC | 1.91e-65 | 8.75e-01 | 0.1387 |
| 440400 | RNASEK | H2 | Human | Cervix | HSIL_HPV | 5.37e-22 | 6.75e-01 | 0.0632 |
| 440400 | RNASEK | L1 | Human | Cervix | CC | 3.93e-12 | 5.73e-01 | 0.0802 |
| 440400 | RNASEK | T1 | Human | Cervix | CC | 1.25e-23 | 6.08e-01 | 0.0918 |
| 440400 | RNASEK | T2 | Human | Cervix | CC | 1.42e-11 | 6.24e-01 | 0.0709 |
| 440400 | RNASEK | T3 | Human | Cervix | CC | 1.30e-48 | 8.55e-01 | 0.1389 |
| 440400 | RNASEK | HTA11_3410_2000001011 | Human | Colorectum | AD | 1.22e-13 | 2.85e-01 | 0.0155 |
| 440400 | RNASEK | HTA11_2487_2000001011 | Human | Colorectum | SER | 5.89e-29 | 8.03e-01 | -0.1808 |
| 440400 | RNASEK | HTA11_2951_2000001011 | Human | Colorectum | AD | 1.84e-10 | 4.63e-01 | 0.0216 |
| 440400 | RNASEK | HTA11_1938_2000001011 | Human | Colorectum | AD | 7.67e-28 | 8.22e-01 | -0.0811 |
| 440400 | RNASEK | HTA11_78_2000001011 | Human | Colorectum | AD | 2.65e-10 | 2.81e-01 | -0.1088 |
| 440400 | RNASEK | HTA11_347_2000001011 | Human | Colorectum | AD | 1.13e-40 | 6.81e-01 | -0.1954 |
| 440400 | RNASEK | HTA11_411_2000001011 | Human | Colorectum | SER | 1.51e-16 | 1.25e+00 | -0.2602 |
| 440400 | RNASEK | HTA11_2112_2000001011 | Human | Colorectum | SER | 5.26e-10 | 6.56e-01 | -0.2196 |
| 440400 | RNASEK | HTA11_3361_2000001011 | Human | Colorectum | AD | 3.79e-24 | 5.95e-01 | -0.1207 |
| 440400 | RNASEK | HTA11_83_2000001011 | Human | Colorectum | SER | 7.80e-11 | 3.69e-01 | -0.1526 |
| 440400 | RNASEK | HTA11_696_2000001011 | Human | Colorectum | AD | 5.74e-37 | 6.16e-01 | -0.1464 |
| 440400 | RNASEK | HTA11_866_2000001011 | Human | Colorectum | AD | 3.84e-22 | 4.53e-01 | -0.1001 |
| 440400 | RNASEK | HTA11_1391_2000001011 | Human | Colorectum | AD | 9.06e-39 | 8.50e-01 | -0.059 |
| Page: 1 2 3 4 5 6 7 8 9 10 11 12 13 14 |
| Tissue | Expression Dynamics | Abbreviation |
| Cervix | 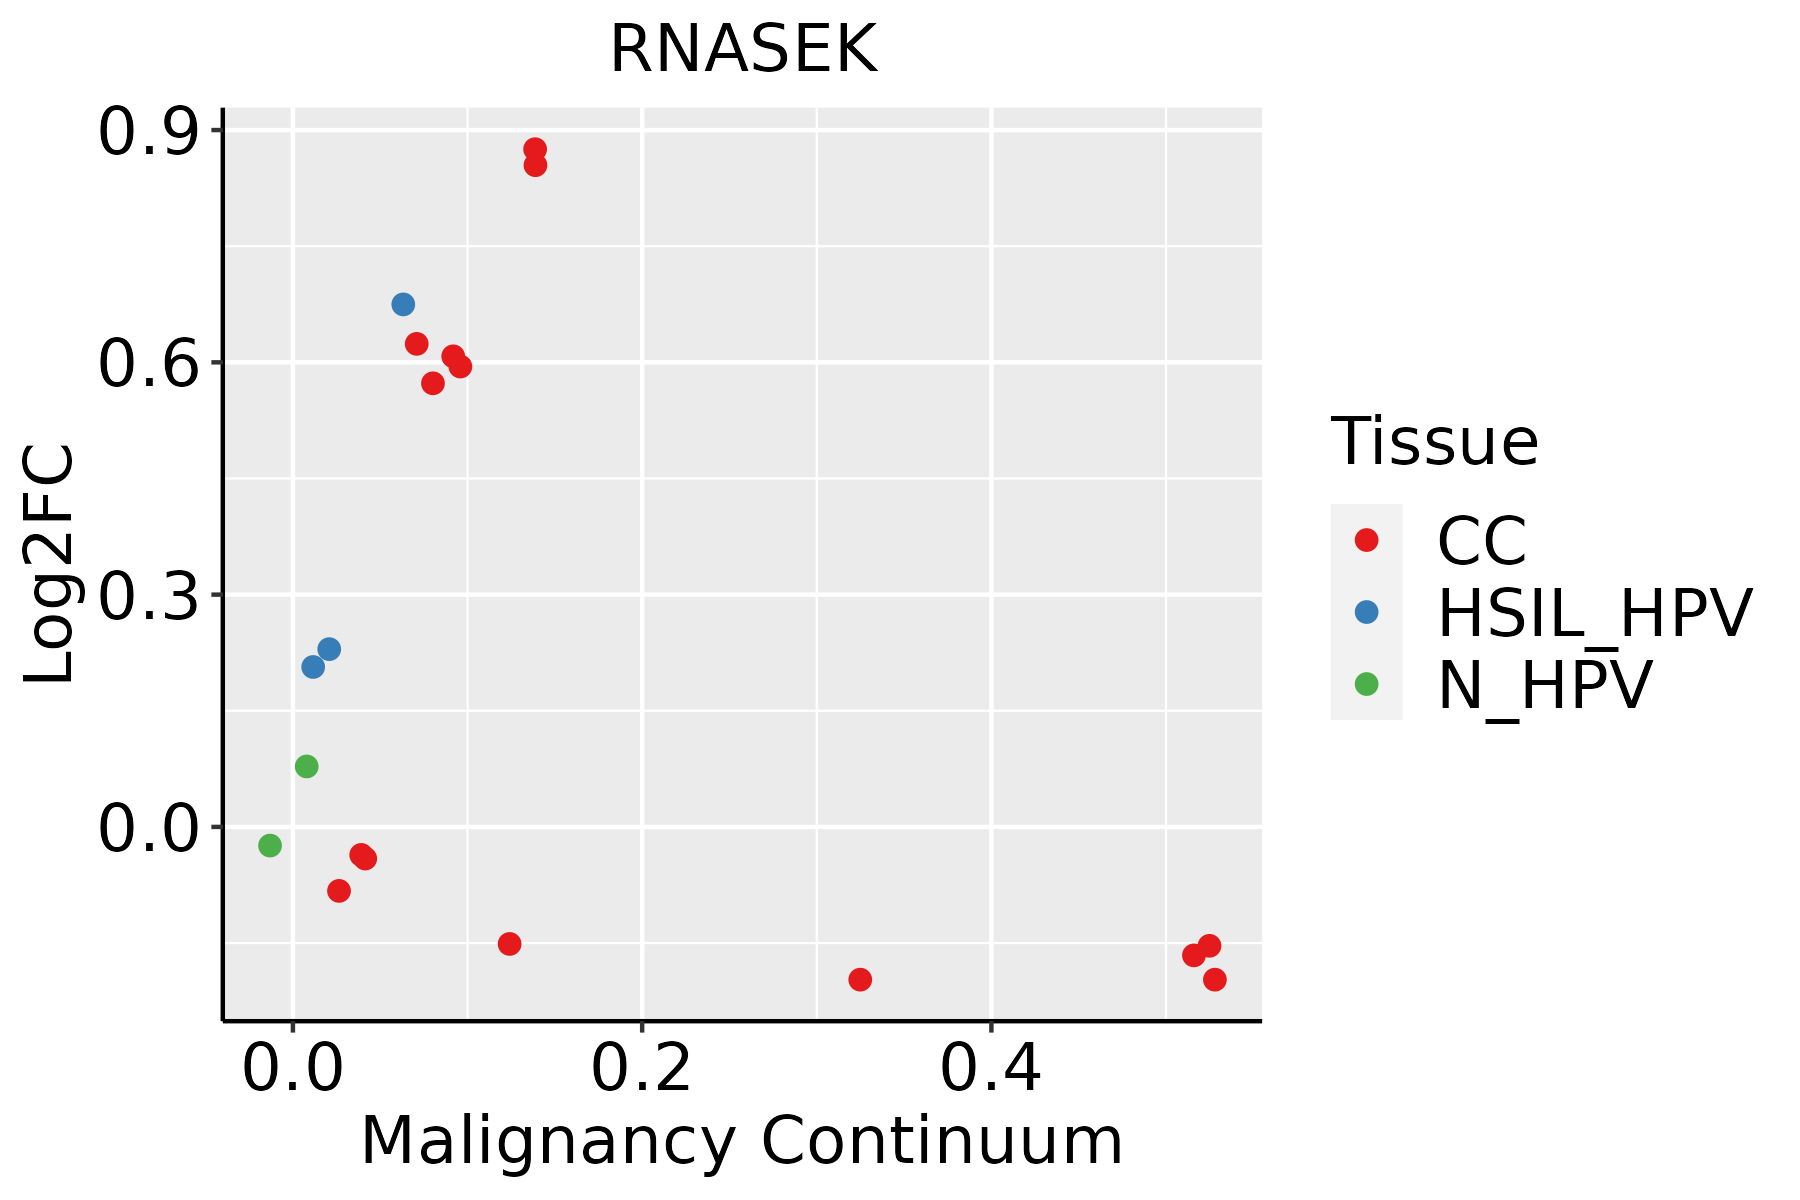 | CC: Cervix cancer |
| HSIL_HPV: HPV-infected high-grade squamous intraepithelial lesions | ||
| N_HPV: HPV-infected normal cervix | ||
| Colorectum (GSE201348) |  | FAP: Familial adenomatous polyposis |
| CRC: Colorectal cancer | ||
| Colorectum (HTA11) |  | AD: Adenomas |
| SER: Sessile serrated lesions | ||
| MSI-H: Microsatellite-high colorectal cancer | ||
| MSS: Microsatellite stable colorectal cancer | ||
| Endometrium | 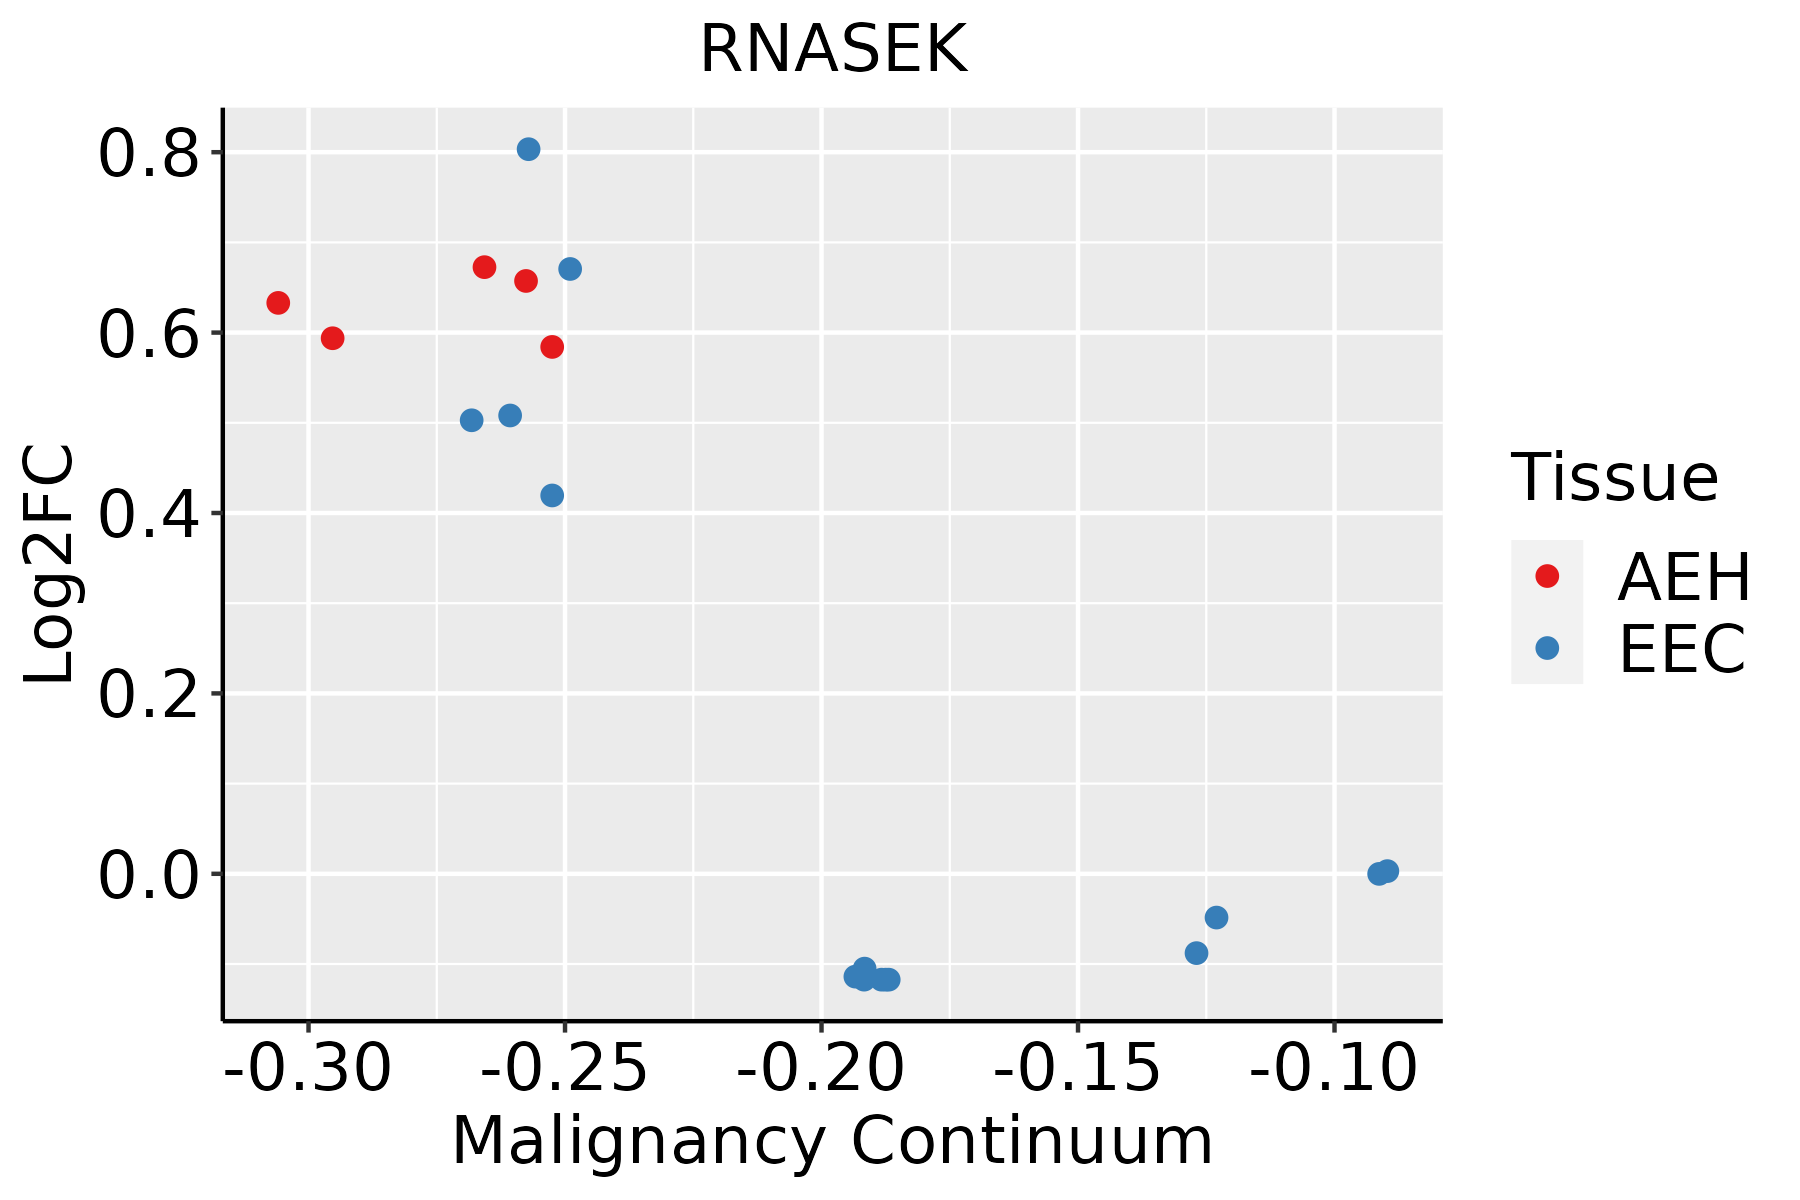 | AEH: Atypical endometrial hyperplasia |
| EEC: Endometrioid Cancer | ||
| Esophagus |  | ESCC: Esophageal squamous cell carcinoma |
| HGIN: High-grade intraepithelial neoplasias | ||
| LGIN: Low-grade intraepithelial neoplasias | ||
| GC | 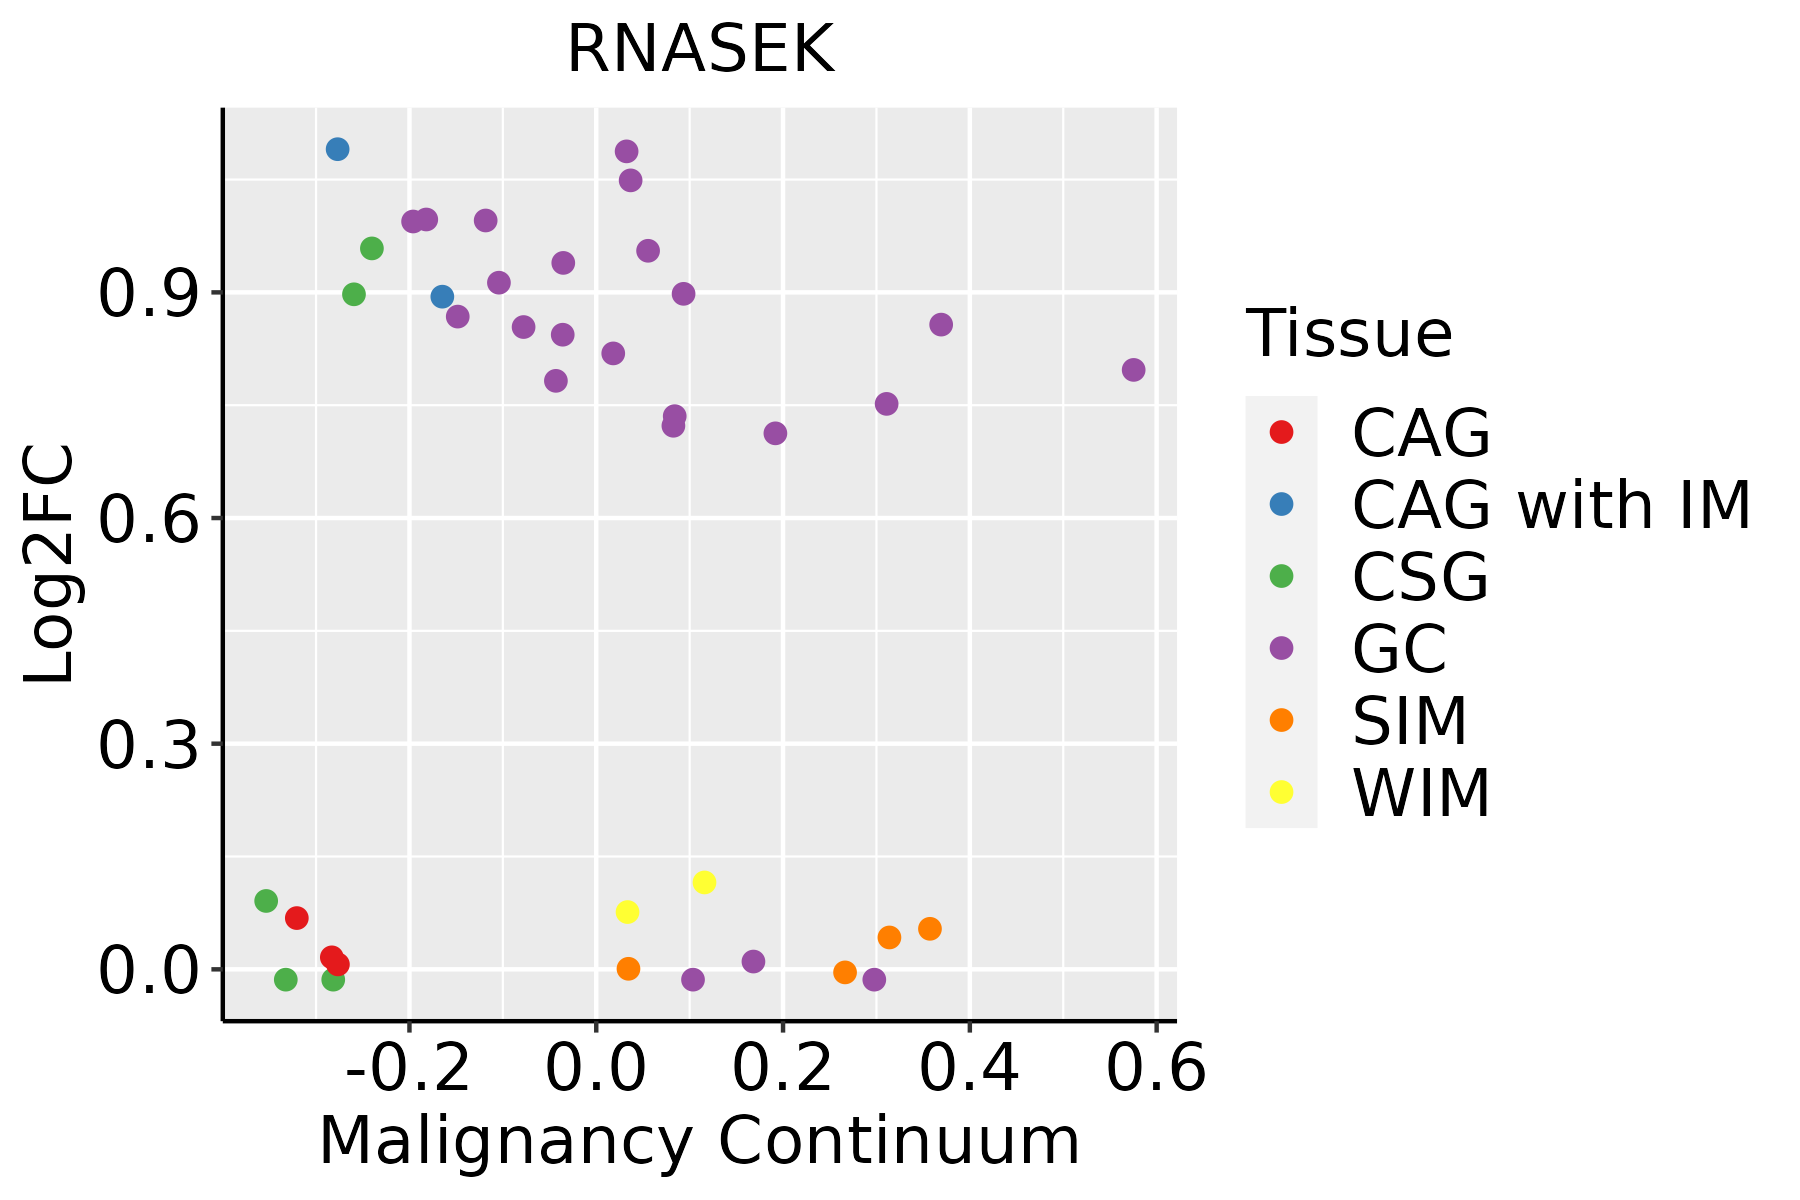 | CAG: Chronic atrophic gastritis |
| CAG with IM: Chronic atrophic gastritis with intestinal metaplasia | ||
| CSG: Chronic superficial gastritis | ||
| GC: Gastric cancer | ||
| SIM: Severe intestinal metaplasia | ||
| WIM: Wild intestinal metaplasia | ||
| Liver | 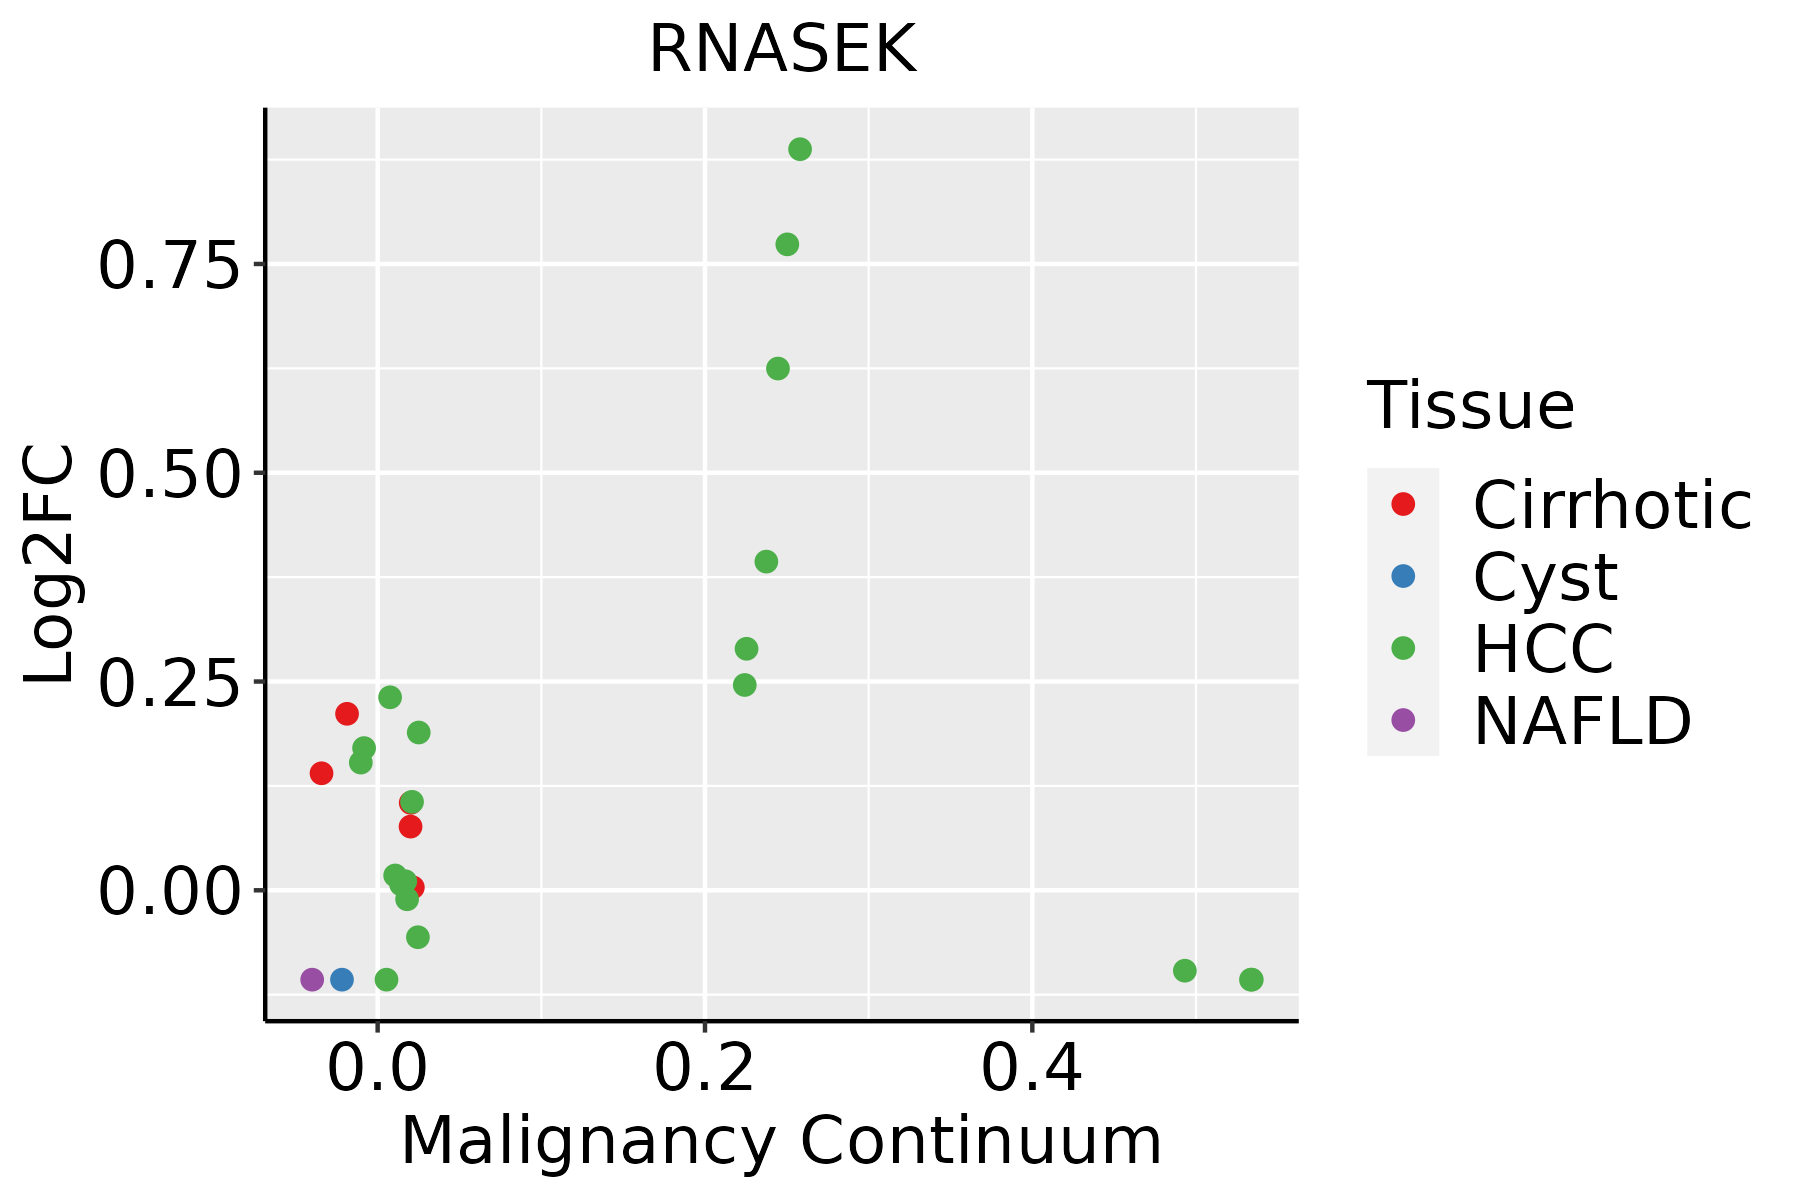 | HCC: Hepatocellular carcinoma |
| NAFLD: Non-alcoholic fatty liver disease | ||
| Lung |  | AAH: Atypical adenomatous hyperplasia |
| AIS: Adenocarcinoma in situ | ||
| IAC: Invasive lung adenocarcinoma | ||
| MIA: Minimally invasive adenocarcinoma | ||
| Oral Cavity |  | EOLP: Erosive Oral lichen planus |
| LP: leukoplakia | ||
| NEOLP: Non-erosive oral lichen planus | ||
| OSCC: Oral squamous cell carcinoma | ||
| Prostate | 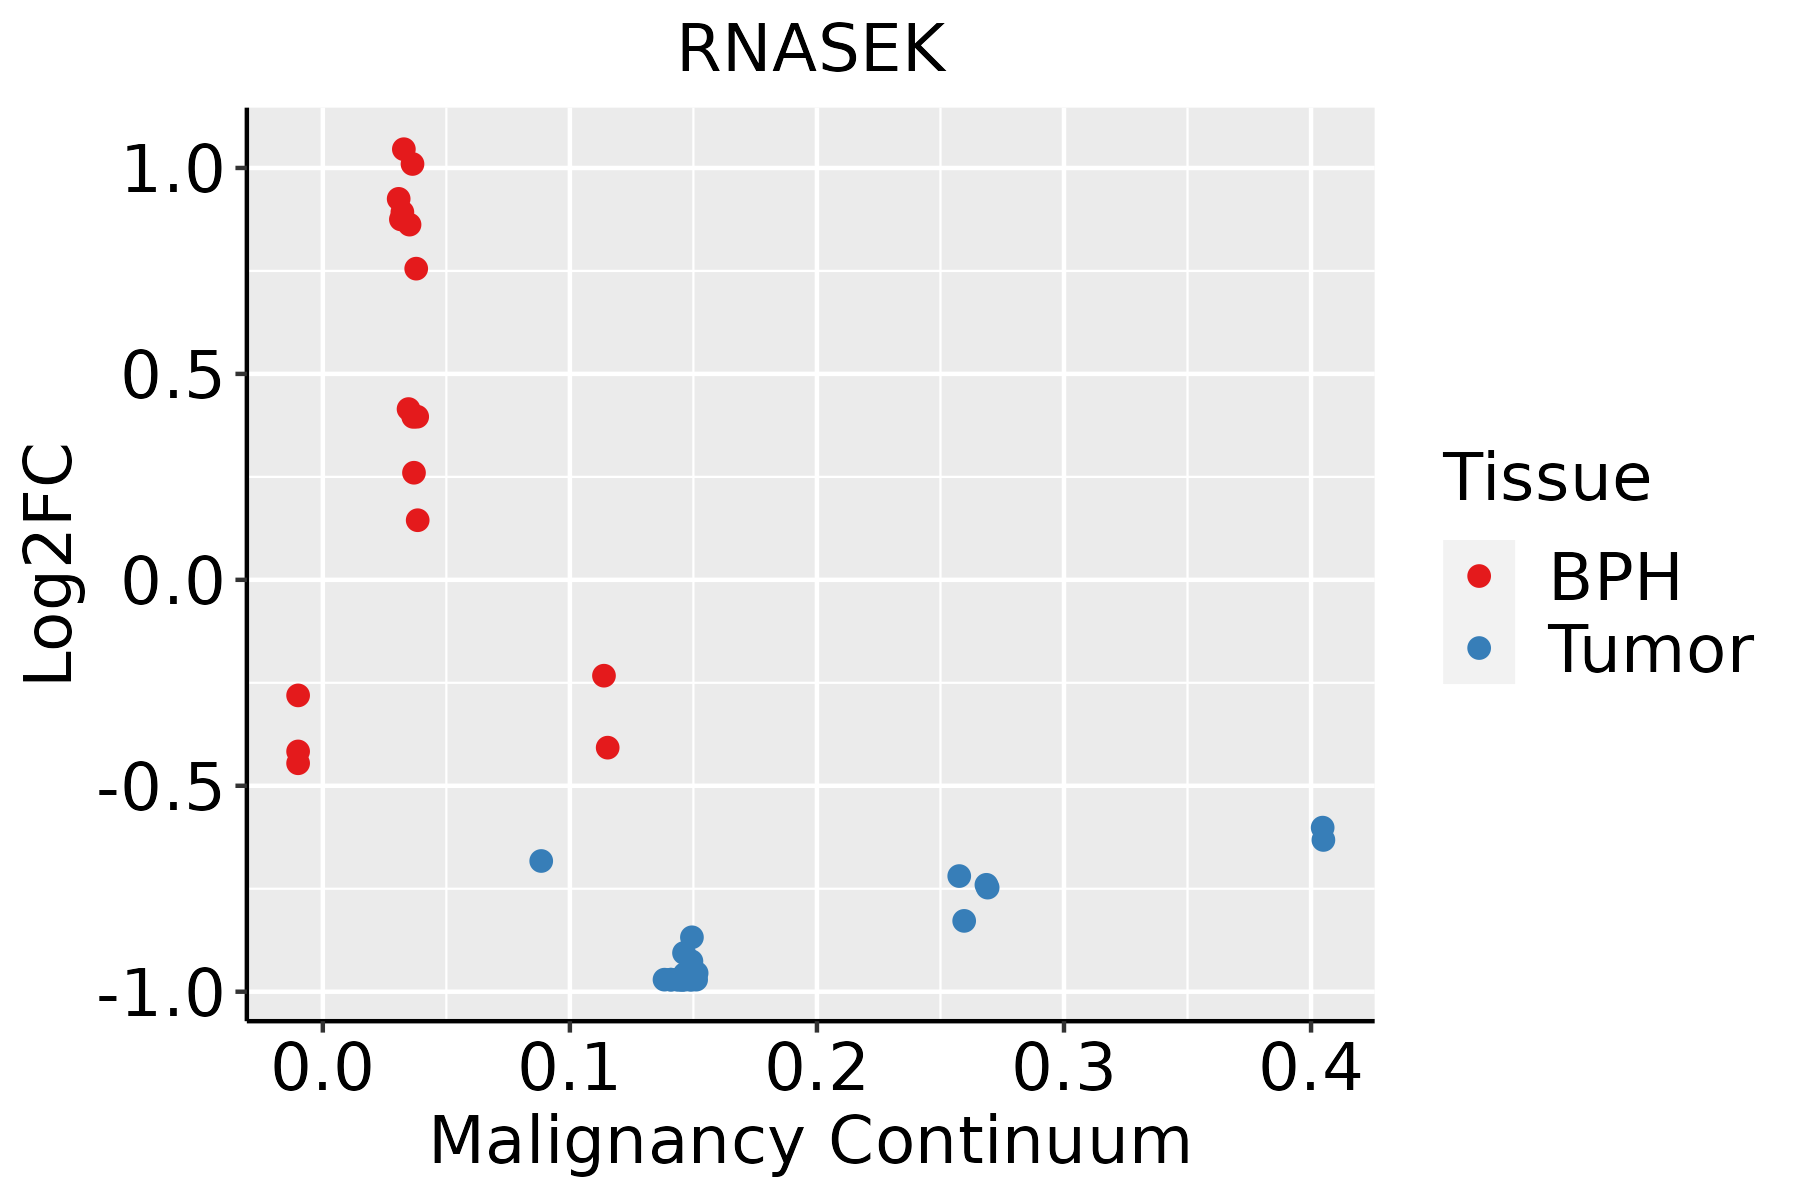 | BPH: Benign Prostatic Hyperplasia |
| Skin | 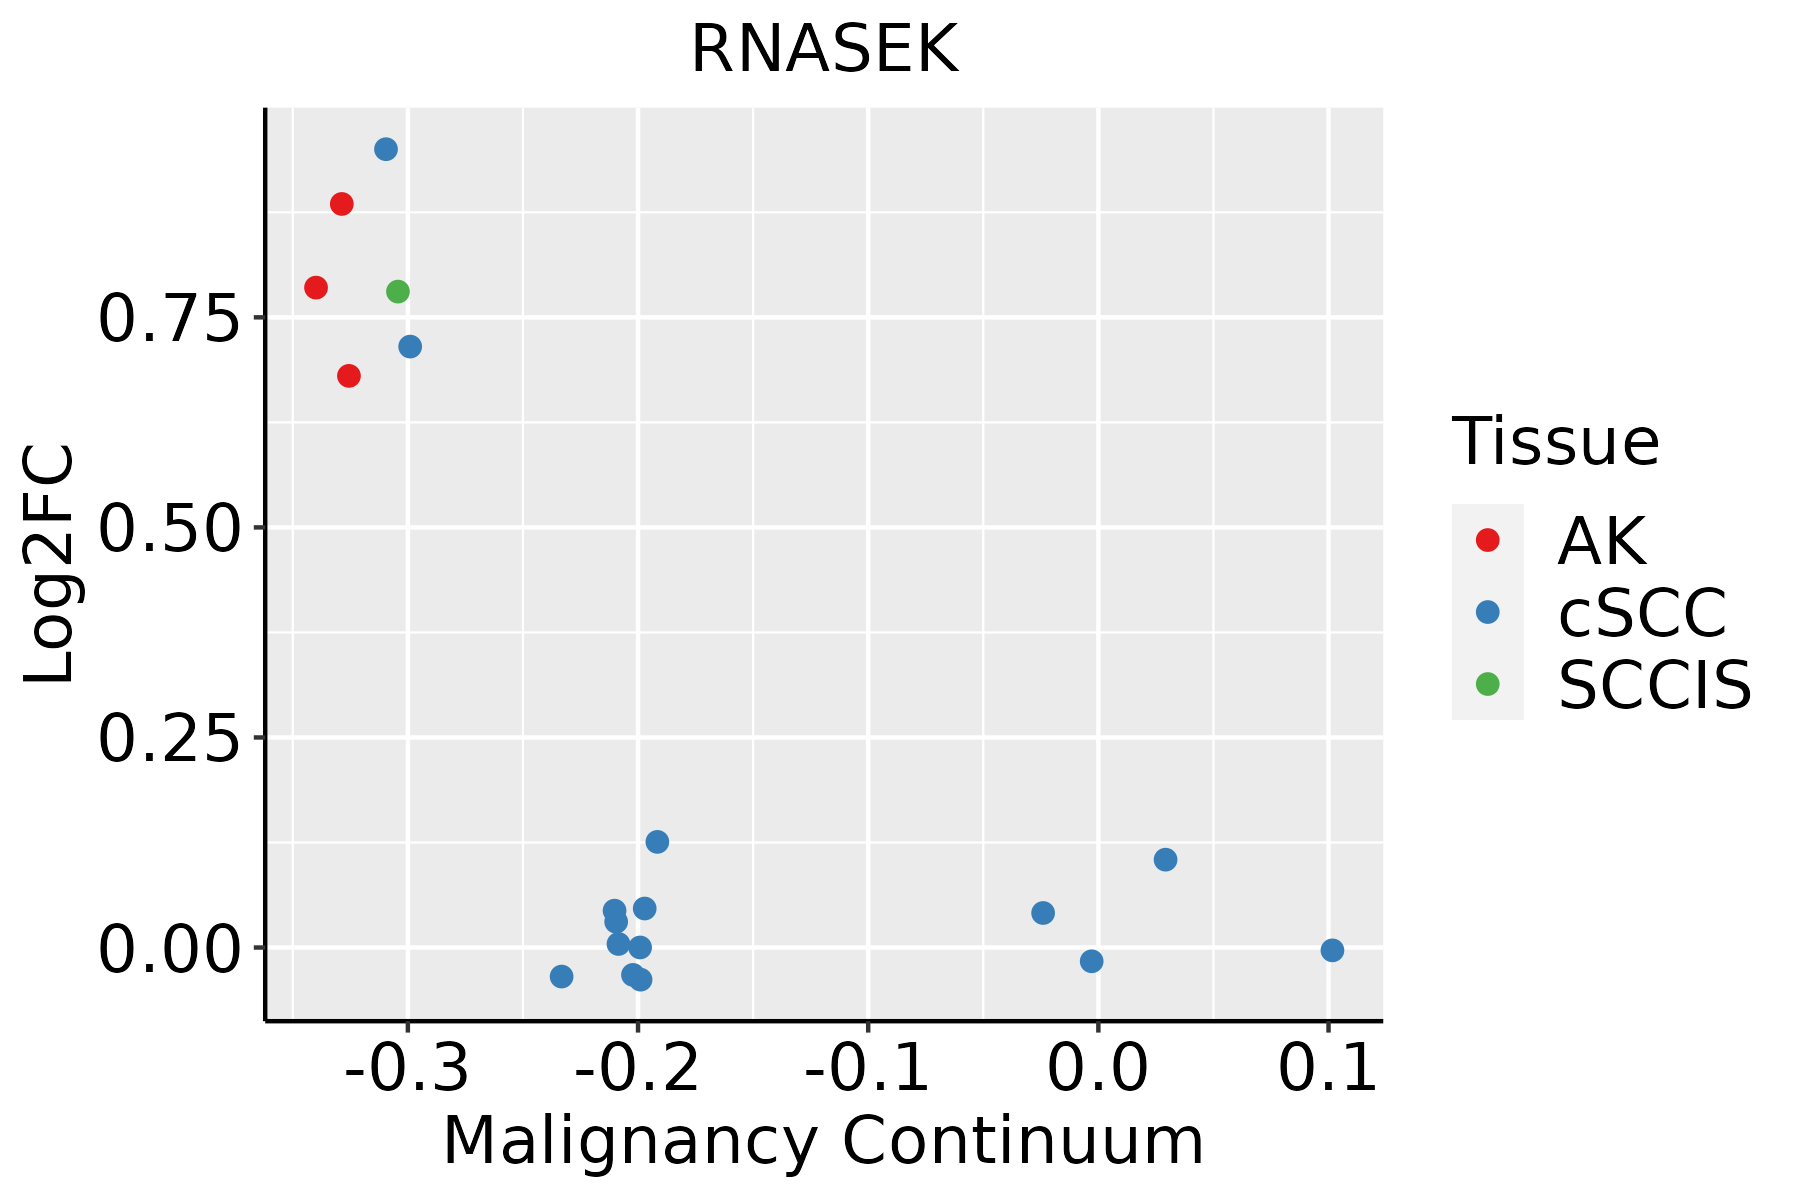 | AK: Actinic keratosis |
| cSCC: Cutaneous squamous cell carcinoma | ||
| SCCIS:squamous cell carcinoma in situ | ||
| Thyroid | 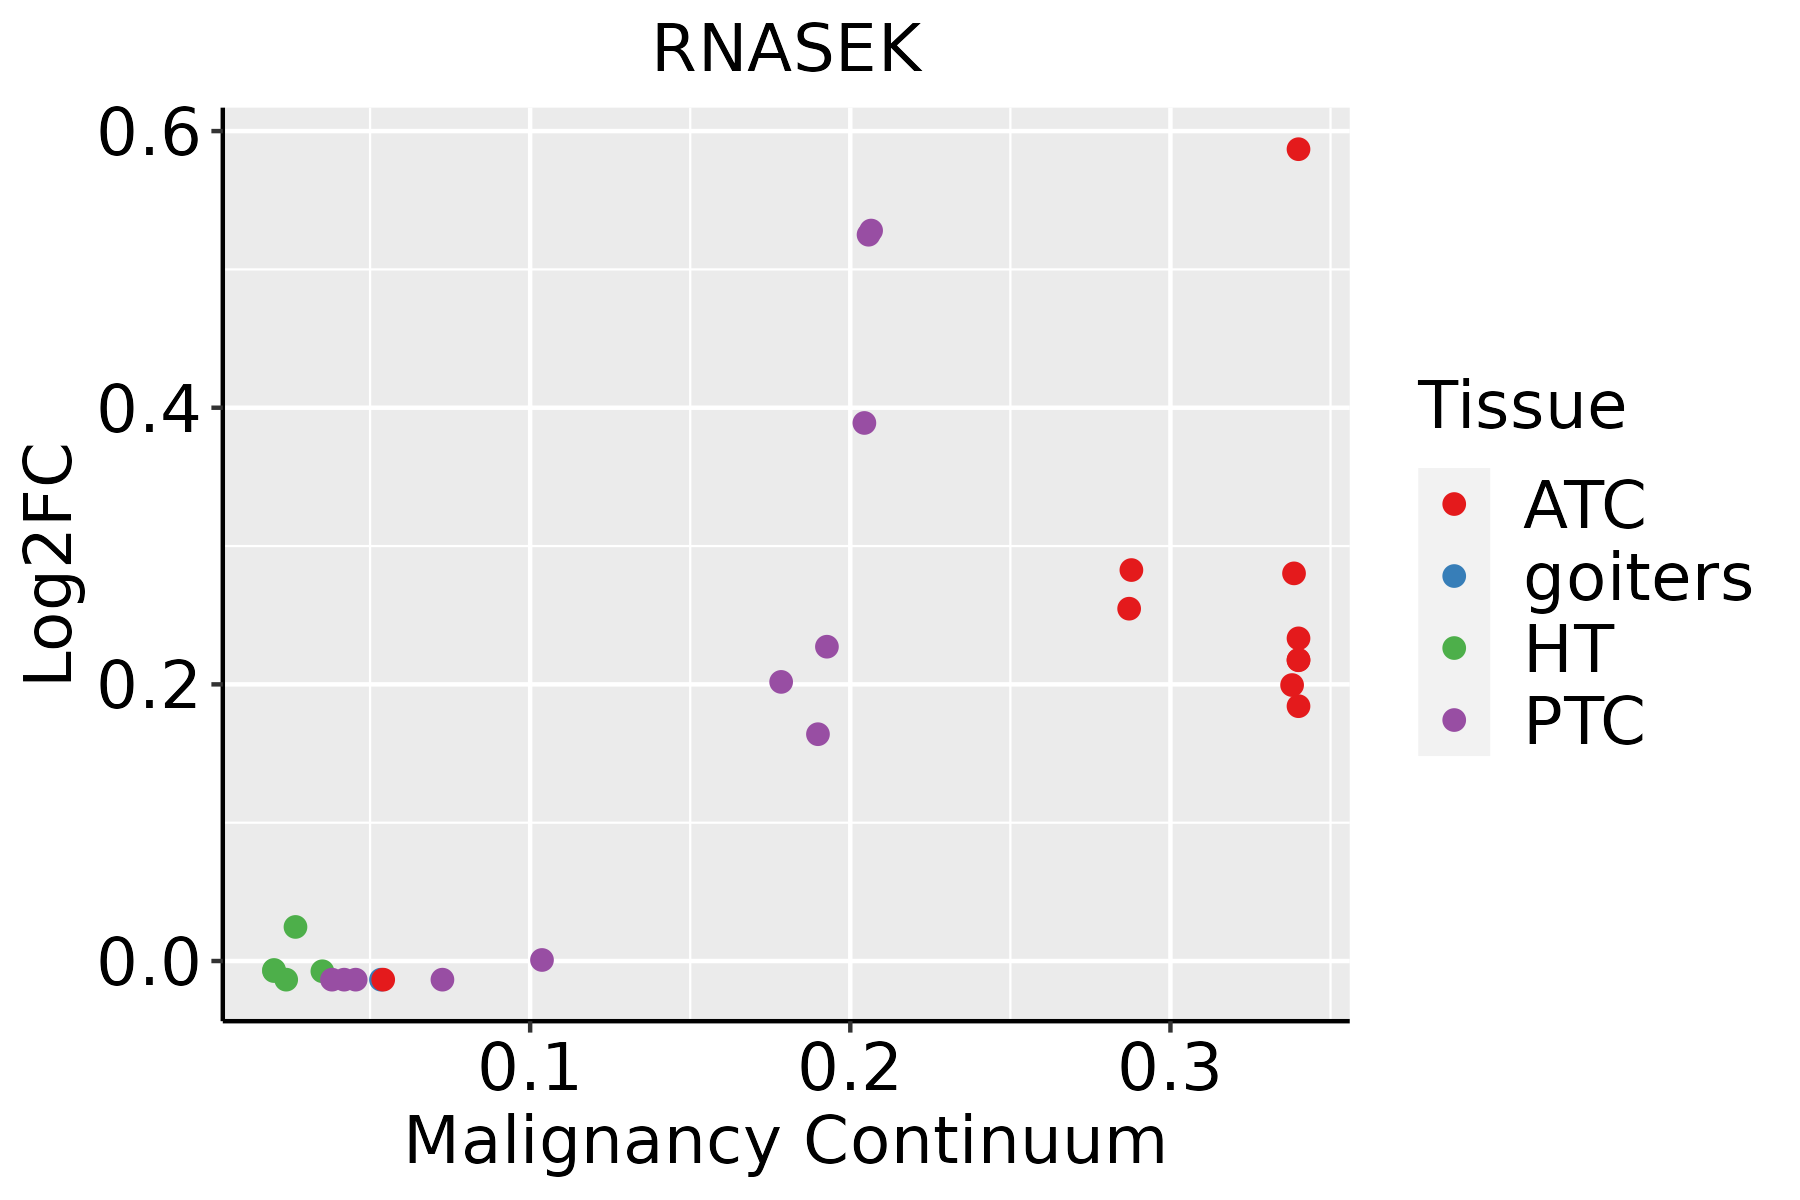 | ATC: Anaplastic thyroid cancer |
| HT: Hashimoto's thyroiditis | ||
| PTC: Papillary thyroid cancer |
| ∗log2FC in expression of this searched gene in stem-like cells from each diseased tissue sample relative to stem-like cells in normal samples in each tissue plotted against the malignancy continuum. Samples are colored based on if they are from different disease stage. |
Top |
Malignant transformation related pathway analysis |
| Find out the enriched GO biological processes and KEGG pathways involved in transition from healthy to precancer to cancer |
| Tissue | Disease Stage | Enriched GO biological Processes |
| Colorectum | AD |  |
| Colorectum | SER |  |
| Colorectum | MSS |  |
| Colorectum | MSI-H |  |
| Colorectum | FAP |  |
| ∗Top 15 enriched GO BP terms are showed in the bar plot of each disease state in each tissue. Each row represents a significant GO biological process which is colored according to the -log10(p.adjust). |
| Page: 1 2 3 4 5 6 7 8 9 |
| GO ID | Tissue | Disease Stage | Description | Gene Ratio | Bg Ratio | pvalue | p.adjust | Count |
| GO:00905013 | Esophagus | ESCC | RNA phosphodiester bond hydrolysis | 110/8552 | 152/18723 | 1.95e-11 | 6.81e-10 | 110 |
| GO:00903053 | Esophagus | ESCC | nucleic acid phosphodiester bond hydrolysis | 163/8552 | 261/18723 | 3.07e-08 | 5.73e-07 | 163 |
| GO:00905023 | Esophagus | ESCC | RNA phosphodiester bond hydrolysis, endonucleolytic | 55/8552 | 82/18723 | 7.34e-05 | 5.51e-04 | 55 |
| GO:0090501 | Liver | Cirrhotic | RNA phosphodiester bond hydrolysis | 54/4634 | 152/18723 | 1.89e-03 | 1.19e-02 | 54 |
| GO:00905011 | Liver | HCC | RNA phosphodiester bond hydrolysis | 101/7958 | 152/18723 | 1.99e-09 | 5.63e-08 | 101 |
| GO:0090305 | Liver | HCC | nucleic acid phosphodiester bond hydrolysis | 152/7958 | 261/18723 | 1.90e-07 | 3.46e-06 | 152 |
| GO:0090502 | Liver | HCC | RNA phosphodiester bond hydrolysis, endonucleolytic | 52/7958 | 82/18723 | 1.06e-04 | 9.08e-04 | 52 |
| GO:00905012 | Oral cavity | OSCC | RNA phosphodiester bond hydrolysis | 95/7305 | 152/18723 | 3.65e-09 | 8.22e-08 | 95 |
| GO:00903052 | Oral cavity | OSCC | nucleic acid phosphodiester bond hydrolysis | 142/7305 | 261/18723 | 2.90e-07 | 4.43e-06 | 142 |
| GO:00905022 | Oral cavity | OSCC | RNA phosphodiester bond hydrolysis, endonucleolytic | 44/7305 | 82/18723 | 4.95e-03 | 1.94e-02 | 44 |
| GO:00905014 | Skin | cSCC | RNA phosphodiester bond hydrolysis | 71/4864 | 152/18723 | 2.72e-08 | 7.41e-07 | 71 |
| GO:00903054 | Skin | cSCC | nucleic acid phosphodiester bond hydrolysis | 97/4864 | 261/18723 | 4.08e-05 | 4.34e-04 | 97 |
| GO:00905024 | Skin | cSCC | RNA phosphodiester bond hydrolysis, endonucleolytic | 34/4864 | 82/18723 | 1.58e-03 | 9.75e-03 | 34 |
| GO:00905015 | Thyroid | PTC | RNA phosphodiester bond hydrolysis | 76/5968 | 152/18723 | 2.40e-06 | 3.17e-05 | 76 |
| GO:00903055 | Thyroid | PTC | nucleic acid phosphodiester bond hydrolysis | 105/5968 | 261/18723 | 2.53e-03 | 1.31e-02 | 105 |
| GO:009050112 | Thyroid | ATC | RNA phosphodiester bond hydrolysis | 76/6293 | 152/18723 | 2.07e-05 | 1.86e-04 | 76 |
| GO:009030511 | Thyroid | ATC | nucleic acid phosphodiester bond hydrolysis | 107/6293 | 261/18723 | 7.21e-03 | 2.84e-02 | 107 |
| Page: 1 |
| Pathway ID | Tissue | Disease Stage | Description | Gene Ratio | Bg Ratio | pvalue | p.adjust | qvalue | Count |
| Page: 1 |
Top |
Cell-cell communication analysis |
| Identification of potential cell-cell interactions between two cell types and their ligand-receptor pairs for different disease states |
| Ligand | Receptor | LRpair | Pathway | Tissue | Disease Stage |
| Page: 1 |
Top |
Single-cell gene regulatory network inference analysis |
| Find out the significant the regulons (TFs) and the target genes of each regulon across cell types for different disease states |
| TF | Cell Type | Tissue | Disease Stage | Target Gene | RSS | Regulon Activity |
| ∗The dot plots of a searched regulon are shown for all cell subpopulations in each disease state of each tissue based on the regulon specific score inferred using pySCENIC and by calculating the average expression. |
| Page: 1 |
Top |
Somatic mutation of malignant transformation related genes |
| Annotation of somatic variants for genes involved in malignant transformation |
| Hugo Symbol | Variant Class | Variant Classification | dbSNP RS | HGVSc | HGVSp | HGVSp Short | SWISSPROT | BIOTYPE | SIFT | PolyPhen | Tumor Sample Barcode | Tissue | Histology | Sex | Age | Stage | Therapy Types | Drugs | Outcome |
| RNASEK | SNV | Missense_Mutation | novel | c.214N>C | p.Phe72Leu | p.F72L | Q6P5S7 | protein_coding | tolerated(0.16) | benign(0.298) | TCGA-AP-A1E0-01 | Endometrium | uterine corpus endometrioid carcinoma | Female | <65 | III/IV | Chemotherapy | paclitaxel | SD |
| RNASEK | SNV | Missense_Mutation | rs772160846 | c.81N>A | p.Ser27Arg | p.S27R | Q6P5S7 | protein_coding | tolerated_low_confidence(0.16) | benign(0) | TCGA-D1-A0ZQ-01 | Endometrium | uterine corpus endometrioid carcinoma | Female | >=65 | I/II | Unknown | Unknown | SD |
| Page: 1 |
Top |
Related drugs of malignant transformation related genes |
| Identification of chemicals and drugs interact with genes involved in malignant transfromation |
| (DGIdb 4.0) |
| Entrez ID | Symbol | Category | Interaction Types | Drug Claim Name | Drug Name | PMIDs |
| Page: 1 |

Copyright 2023-Present -The University of Texas Health Science Center at Houston |