
|
|||||
|
 | |
| |
| |
| |
| |
| |
|
Gene: RNASEH2C |
Gene summary for RNASEH2C |
| Gene information | Species | Human | Gene symbol | RNASEH2C | Gene ID | 84153 |
| Gene name | ribonuclease H2 subunit C | |
| Gene Alias | AGS3 | |
| Cytomap | 11q13.1 | |
| Gene Type | protein-coding | GO ID | GO:0006139 | UniProtAcc | A0A024R5B3 |
Top |
Malignant transformation analysis |
| Identification of the aberrant gene expression in precancerous and cancerous lesions by comparing the gene expression of stem-like cells in diseased tissues with normal stem cells |
| Entrez ID | Symbol | Replicates | Species | Organ | Tissue | Adj P-value | Log2FC | Malignancy |
| 84153 | RNASEH2C | GSM4909291 | Human | Breast | IDC | 1.44e-17 | 5.92e-01 | 0.1753 |
| 84153 | RNASEH2C | GSM4909296 | Human | Breast | IDC | 1.67e-07 | -1.70e-01 | 0.1524 |
| 84153 | RNASEH2C | GSM4909297 | Human | Breast | IDC | 1.89e-06 | -1.05e-01 | 0.1517 |
| 84153 | RNASEH2C | GSM4909301 | Human | Breast | IDC | 2.12e-23 | 5.97e-01 | 0.1577 |
| 84153 | RNASEH2C | GSM4909304 | Human | Breast | IDC | 8.68e-04 | 2.80e-01 | 0.1636 |
| 84153 | RNASEH2C | GSM4909307 | Human | Breast | IDC | 9.30e-12 | 4.57e-01 | 0.1569 |
| 84153 | RNASEH2C | GSM4909308 | Human | Breast | IDC | 1.73e-17 | 5.22e-01 | 0.158 |
| 84153 | RNASEH2C | GSM4909309 | Human | Breast | IDC | 1.20e-02 | 1.63e-01 | 0.0483 |
| 84153 | RNASEH2C | GSM4909311 | Human | Breast | IDC | 3.33e-22 | -5.74e-02 | 0.1534 |
| 84153 | RNASEH2C | GSM4909312 | Human | Breast | IDC | 1.36e-04 | 2.06e-02 | 0.1552 |
| 84153 | RNASEH2C | GSM4909315 | Human | Breast | IDC | 2.99e-05 | -2.61e-01 | 0.21 |
| 84153 | RNASEH2C | GSM4909319 | Human | Breast | IDC | 6.59e-26 | 2.18e-02 | 0.1563 |
| 84153 | RNASEH2C | GSM4909320 | Human | Breast | IDC | 6.63e-05 | 2.02e-02 | 0.1575 |
| 84153 | RNASEH2C | GSM4909321 | Human | Breast | IDC | 1.90e-12 | 1.27e-01 | 0.1559 |
| 84153 | RNASEH2C | M2 | Human | Breast | IDC | 1.66e-07 | 3.77e-01 | 0.21 |
| 84153 | RNASEH2C | NCCBC14 | Human | Breast | DCIS | 6.88e-05 | -5.54e-03 | 0.2021 |
| 84153 | RNASEH2C | NCCBC2 | Human | Breast | DCIS | 1.15e-02 | -1.14e-01 | 0.1554 |
| 84153 | RNASEH2C | NCCBC3 | Human | Breast | DCIS | 6.36e-04 | 1.18e-02 | 0.1198 |
| 84153 | RNASEH2C | NCCBC5 | Human | Breast | DCIS | 3.74e-08 | 1.17e-02 | 0.2046 |
| 84153 | RNASEH2C | P1 | Human | Breast | IDC | 4.81e-11 | -1.71e-01 | 0.1527 |
| Page: 1 2 3 4 5 6 7 |
| Tissue | Expression Dynamics | Abbreviation |
| Breast | 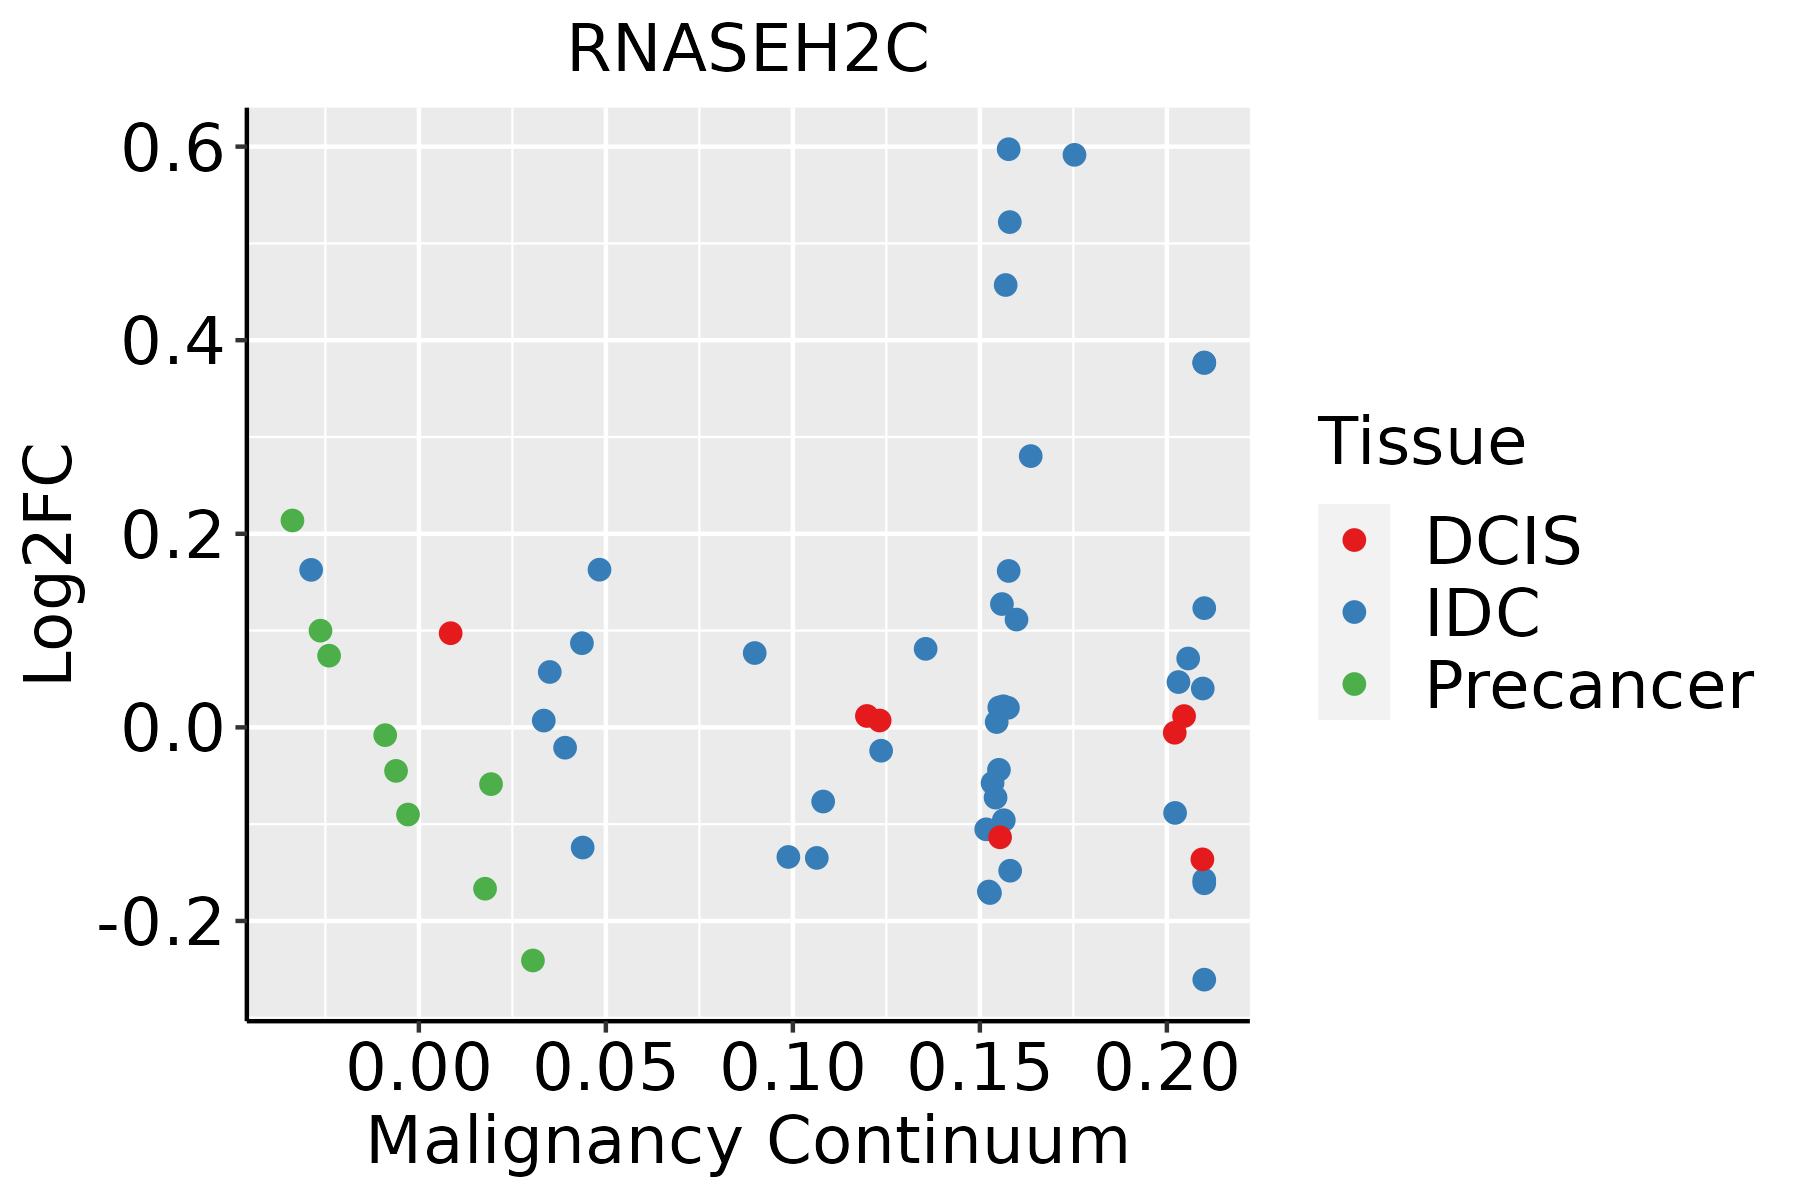 | IDC: Invasive ductal carcinoma |
| DCIS: Ductal carcinoma in situ | ||
| Precancer(BRCA1-mut): Precancerous lesion from BRCA1 mutation carriers | ||
| Esophagus | 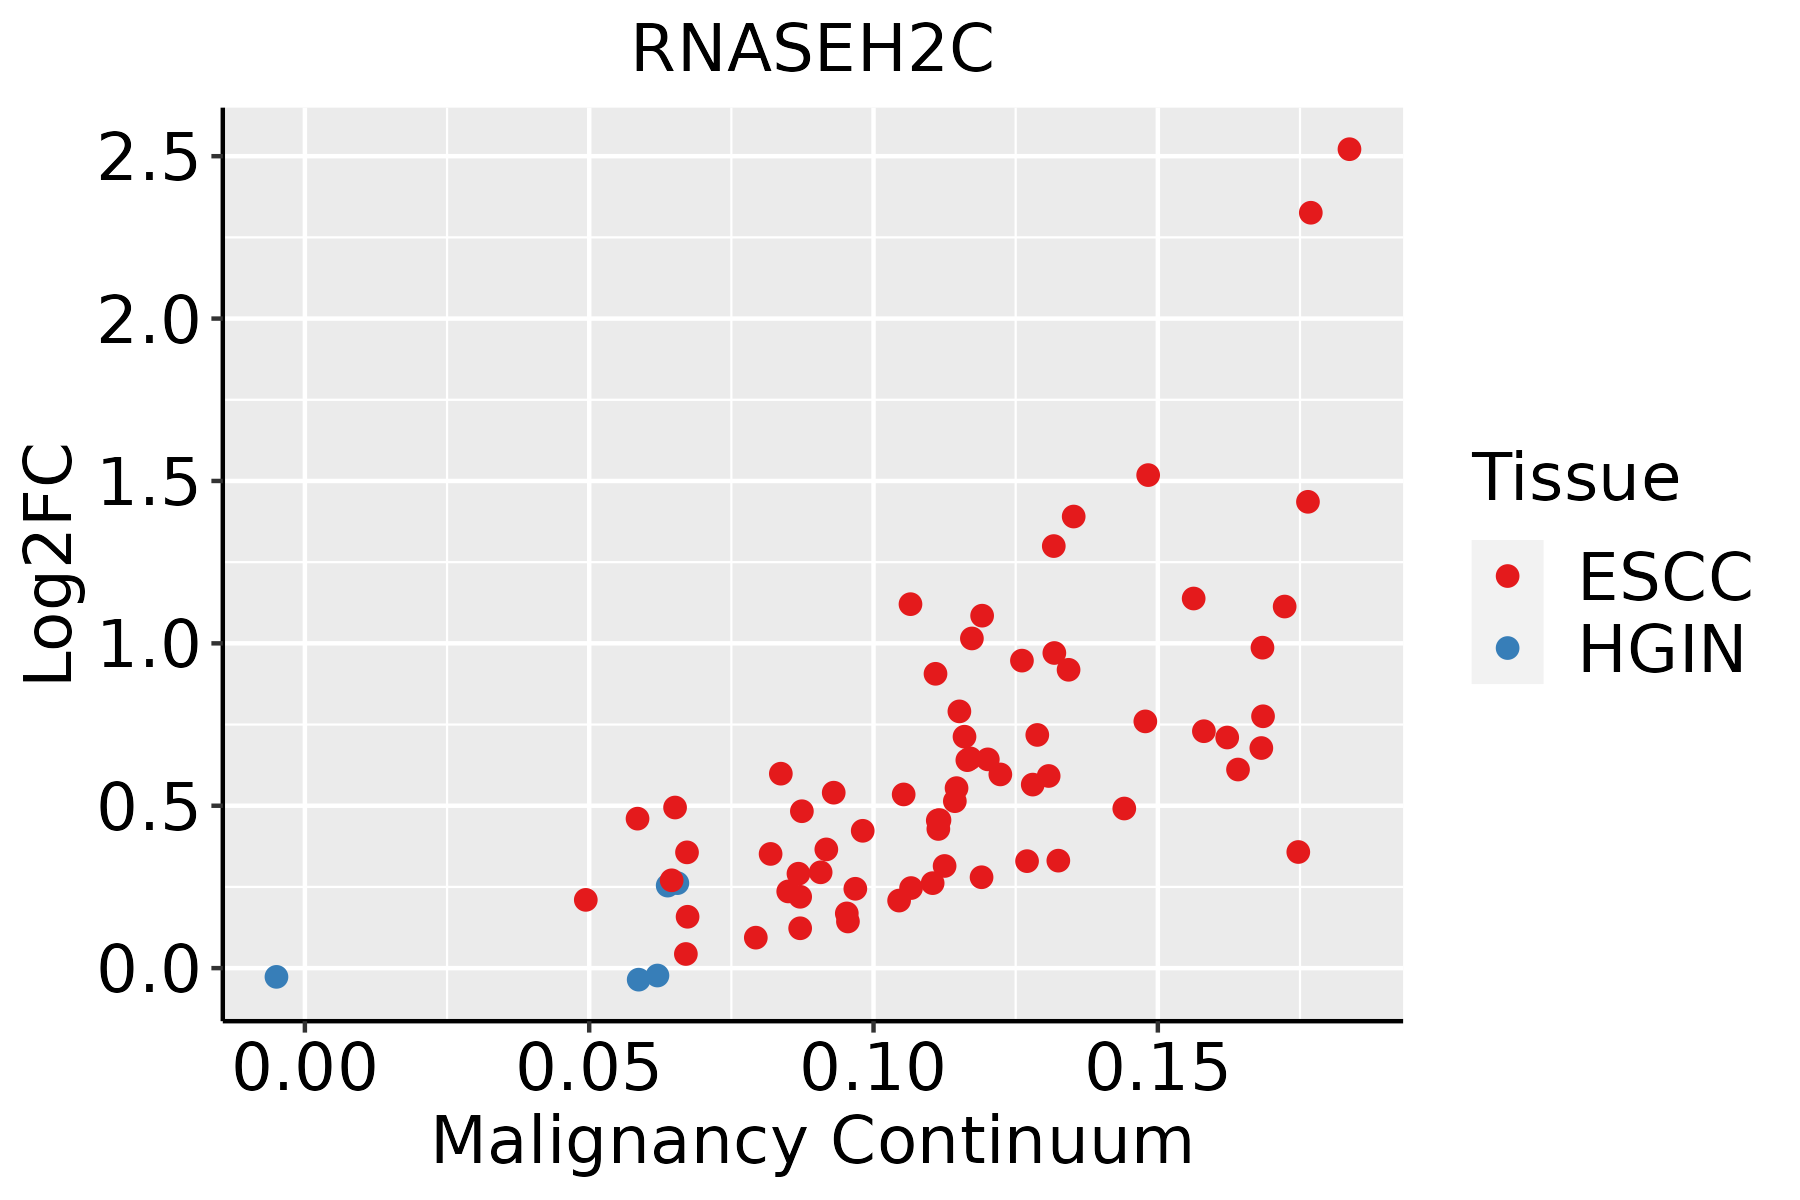 | ESCC: Esophageal squamous cell carcinoma |
| HGIN: High-grade intraepithelial neoplasias | ||
| LGIN: Low-grade intraepithelial neoplasias | ||
| Liver | 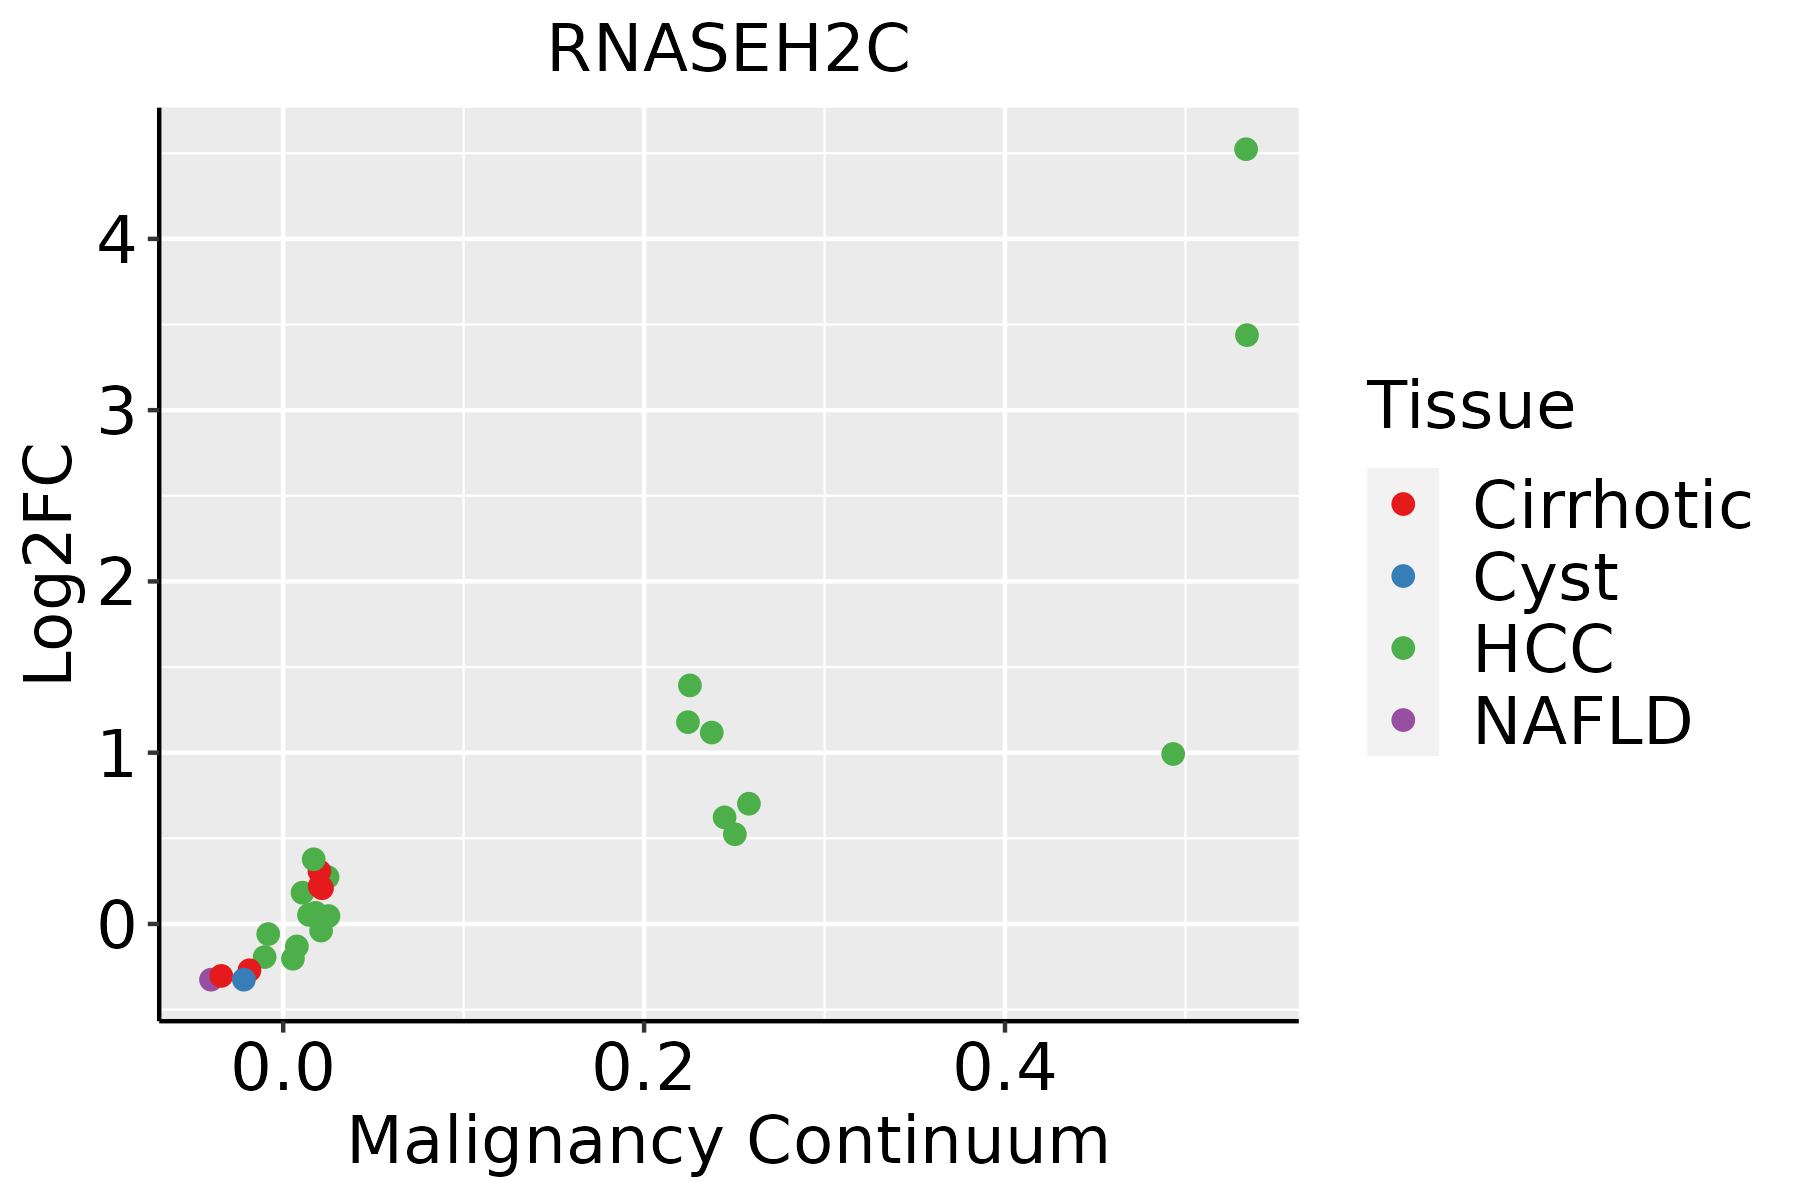 | HCC: Hepatocellular carcinoma |
| NAFLD: Non-alcoholic fatty liver disease | ||
| Oral Cavity |  | EOLP: Erosive Oral lichen planus |
| LP: leukoplakia | ||
| NEOLP: Non-erosive oral lichen planus | ||
| OSCC: Oral squamous cell carcinoma | ||
| Thyroid | 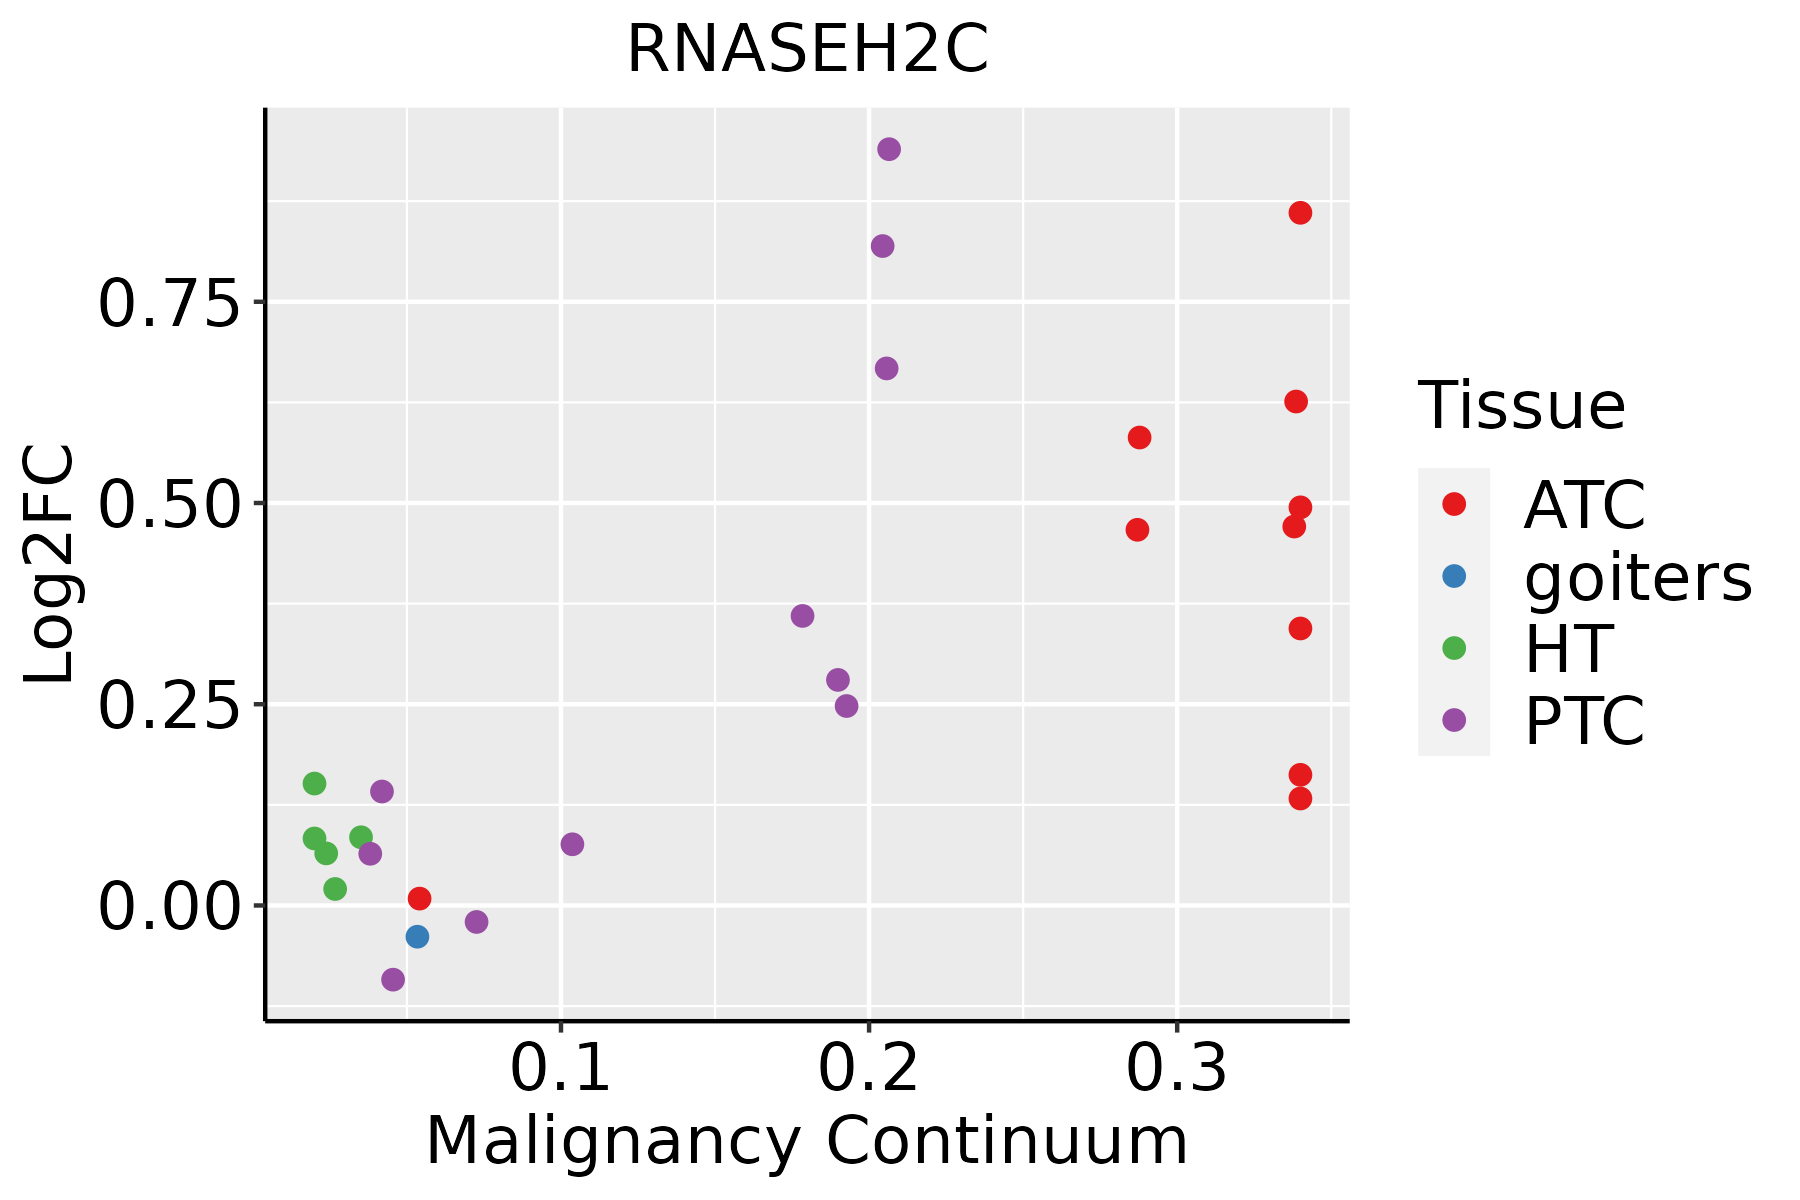 | ATC: Anaplastic thyroid cancer |
| HT: Hashimoto's thyroiditis | ||
| PTC: Papillary thyroid cancer |
| ∗log2FC in expression of this searched gene in stem-like cells from each diseased tissue sample relative to stem-like cells in normal samples in each tissue plotted against the malignancy continuum. Samples are colored based on if they are from different disease stage. |
Top |
Malignant transformation related pathway analysis |
| Find out the enriched GO biological processes and KEGG pathways involved in transition from healthy to precancer to cancer |
| Tissue | Disease Stage | Enriched GO biological Processes |
| Colorectum | AD |  |
| Colorectum | SER |  |
| Colorectum | MSS |  |
| Colorectum | MSI-H |  |
| Colorectum | FAP |  |
| ∗Top 15 enriched GO BP terms are showed in the bar plot of each disease state in each tissue. Each row represents a significant GO biological process which is colored according to the -log10(p.adjust). |
| Page: 1 2 3 4 5 6 7 8 9 |
| GO ID | Tissue | Disease Stage | Description | Gene Ratio | Bg Ratio | pvalue | p.adjust | Count |
| GO:000640113 | Breast | IDC | RNA catabolic process | 38/1434 | 278/18723 | 3.54e-04 | 5.16e-03 | 38 |
| GO:190136112 | Breast | IDC | organic cyclic compound catabolic process | 56/1434 | 495/18723 | 2.12e-03 | 1.99e-02 | 56 |
| GO:004670012 | Breast | IDC | heterocycle catabolic process | 51/1434 | 445/18723 | 2.51e-03 | 2.25e-02 | 51 |
| GO:003465513 | Breast | IDC | nucleobase-containing compound catabolic process | 47/1434 | 407/18723 | 3.12e-03 | 2.63e-02 | 47 |
| GO:004427012 | Breast | IDC | cellular nitrogen compound catabolic process | 50/1434 | 451/18723 | 5.29e-03 | 3.93e-02 | 50 |
| GO:001943912 | Breast | IDC | aromatic compound catabolic process | 51/1434 | 467/18723 | 6.54e-03 | 4.59e-02 | 51 |
| GO:000640123 | Breast | DCIS | RNA catabolic process | 38/1390 | 278/18723 | 1.91e-04 | 3.08e-03 | 38 |
| GO:003465522 | Breast | DCIS | nucleobase-containing compound catabolic process | 47/1390 | 407/18723 | 1.69e-03 | 1.68e-02 | 47 |
| GO:190136122 | Breast | DCIS | organic cyclic compound catabolic process | 55/1390 | 495/18723 | 1.75e-03 | 1.71e-02 | 55 |
| GO:004670022 | Breast | DCIS | heterocycle catabolic process | 50/1390 | 445/18723 | 2.19e-03 | 2.03e-02 | 50 |
| GO:001943922 | Breast | DCIS | aromatic compound catabolic process | 51/1390 | 467/18723 | 3.58e-03 | 2.92e-02 | 51 |
| GO:004427022 | Breast | DCIS | cellular nitrogen compound catabolic process | 49/1390 | 451/18723 | 4.68e-03 | 3.56e-02 | 49 |
| GO:000640120 | Esophagus | HGIN | RNA catabolic process | 77/2587 | 278/18723 | 7.63e-10 | 6.36e-08 | 77 |
| GO:003465519 | Esophagus | HGIN | nucleobase-containing compound catabolic process | 98/2587 | 407/18723 | 1.44e-08 | 8.94e-07 | 98 |
| GO:004670017 | Esophagus | HGIN | heterocycle catabolic process | 103/2587 | 445/18723 | 5.44e-08 | 2.99e-06 | 103 |
| GO:004427018 | Esophagus | HGIN | cellular nitrogen compound catabolic process | 103/2587 | 451/18723 | 1.10e-07 | 5.56e-06 | 103 |
| GO:001943917 | Esophagus | HGIN | aromatic compound catabolic process | 105/2587 | 467/18723 | 1.89e-07 | 9.31e-06 | 105 |
| GO:190136117 | Esophagus | HGIN | organic cyclic compound catabolic process | 106/2587 | 495/18723 | 1.94e-06 | 7.13e-05 | 106 |
| GO:0006401110 | Esophagus | ESCC | RNA catabolic process | 204/8552 | 278/18723 | 3.39e-21 | 5.66e-19 | 204 |
| GO:0034655110 | Esophagus | ESCC | nucleobase-containing compound catabolic process | 272/8552 | 407/18723 | 2.92e-18 | 2.90e-16 | 272 |
| Page: 1 2 3 |
| Pathway ID | Tissue | Disease Stage | Description | Gene Ratio | Bg Ratio | pvalue | p.adjust | qvalue | Count |
| hsa030304 | Esophagus | ESCC | DNA replication | 32/4205 | 36/8465 | 7.71e-07 | 5.06e-06 | 2.59e-06 | 32 |
| hsa0303011 | Esophagus | ESCC | DNA replication | 32/4205 | 36/8465 | 7.71e-07 | 5.06e-06 | 2.59e-06 | 32 |
| hsa03030 | Oral cavity | OSCC | DNA replication | 31/3704 | 36/8465 | 1.70e-07 | 1.19e-06 | 6.03e-07 | 31 |
| hsa030301 | Oral cavity | OSCC | DNA replication | 31/3704 | 36/8465 | 1.70e-07 | 1.19e-06 | 6.03e-07 | 31 |
| hsa030302 | Oral cavity | LP | DNA replication | 23/2418 | 36/8465 | 1.08e-05 | 7.79e-05 | 5.02e-05 | 23 |
| hsa030303 | Oral cavity | LP | DNA replication | 23/2418 | 36/8465 | 1.08e-05 | 7.79e-05 | 5.02e-05 | 23 |
| Page: 1 |
Top |
Cell-cell communication analysis |
| Identification of potential cell-cell interactions between two cell types and their ligand-receptor pairs for different disease states |
| Ligand | Receptor | LRpair | Pathway | Tissue | Disease Stage |
| Page: 1 |
Top |
Single-cell gene regulatory network inference analysis |
| Find out the significant the regulons (TFs) and the target genes of each regulon across cell types for different disease states |
| TF | Cell Type | Tissue | Disease Stage | Target Gene | RSS | Regulon Activity |
| RNASEH2C | MDSC | Prostate | ADJ | IDH2,TMEM106C,ATP5I, etc. | 8.11e-02 |  |
| RNASEH2C | PLA | Prostate | BPH | IDH2,TMEM106C,ATP5I, etc. | 5.36e-02 |  |
| RNASEH2C | PLA | Prostate | Tumor | IDH2,TMEM106C,ATP5I, etc. | 7.14e-02 |  |
| ∗The dot plots of a searched regulon are shown for all cell subpopulations in each disease state of each tissue based on the regulon specific score inferred using pySCENIC and by calculating the average expression. |
| Page: 1 |
Top |
Somatic mutation of malignant transformation related genes |
| Annotation of somatic variants for genes involved in malignant transformation |
| Hugo Symbol | Variant Class | Variant Classification | dbSNP RS | HGVSc | HGVSp | HGVSp Short | SWISSPROT | BIOTYPE | SIFT | PolyPhen | Tumor Sample Barcode | Tissue | Histology | Sex | Age | Stage | Therapy Types | Drugs | Outcome |
| RNASEH2C | SNV | Missense_Mutation | novel | c.364N>A | p.Ala122Thr | p.A122T | Q8TDP1 | protein_coding | deleterious(0.01) | probably_damaging(0.999) | TCGA-DI-A1BU-01 | Endometrium | uterine corpus endometrioid carcinoma | Female | <65 | I/II | Chemotherapy | paclitaxel | SD |
| RNASEH2C | SNV | Missense_Mutation | c.115N>C | p.Asp39His | p.D39H | Q8TDP1 | protein_coding | deleterious(0.01) | benign(0.315) | TCGA-DD-A1EL-01 | Liver | liver hepatocellular carcinoma | Male | <65 | I/II | Unknown | Unknown | PD | |
| RNASEH2C | SNV | Missense_Mutation | c.191N>A | p.Arg64Gln | p.R64Q | Q8TDP1 | protein_coding | deleterious(0) | probably_damaging(0.957) | TCGA-BR-8363-01 | Stomach | stomach adenocarcinoma | Female | >=65 | I/II | Unknown | Unknown | SD | |
| RNASEH2C | SNV | Missense_Mutation | novel | c.360N>G | p.Ile120Met | p.I120M | Q8TDP1 | protein_coding | tolerated(0.27) | benign(0.018) | TCGA-CG-4438-01 | Stomach | stomach adenocarcinoma | Male | <65 | III/IV | Unknown | Unknown | SD |
| Page: 1 |
Top |
Related drugs of malignant transformation related genes |
| Identification of chemicals and drugs interact with genes involved in malignant transfromation |
| (DGIdb 4.0) |
| Entrez ID | Symbol | Category | Interaction Types | Drug Claim Name | Drug Name | PMIDs |
| Page: 1 |

Copyright 2023-Present -The University of Texas Health Science Center at Houston |