
|
|||||
|
 | |
| |
| |
| |
| |
| |
|
Gene: RNASEH2B |
Gene summary for RNASEH2B |
| Gene information | Species | Human | Gene symbol | RNASEH2B | Gene ID | 79621 |
| Gene name | ribonuclease H2 subunit B | |
| Gene Alias | AGS2 | |
| Cytomap | 13q14.3 | |
| Gene Type | protein-coding | GO ID | GO:0000075 | UniProtAcc | Q5TBB1 |
Top |
Malignant transformation analysis |
| Identification of the aberrant gene expression in precancerous and cancerous lesions by comparing the gene expression of stem-like cells in diseased tissues with normal stem cells |
| Entrez ID | Symbol | Replicates | Species | Organ | Tissue | Adj P-value | Log2FC | Malignancy |
| 79621 | RNASEH2B | LZE2T | Human | Esophagus | ESCC | 1.11e-03 | 4.59e-01 | 0.082 |
| 79621 | RNASEH2B | LZE4T | Human | Esophagus | ESCC | 1.13e-07 | 2.06e-01 | 0.0811 |
| 79621 | RNASEH2B | LZE7T | Human | Esophagus | ESCC | 2.88e-05 | 2.15e-01 | 0.0667 |
| 79621 | RNASEH2B | LZE8T | Human | Esophagus | ESCC | 1.64e-03 | 1.31e-01 | 0.067 |
| 79621 | RNASEH2B | LZE22T | Human | Esophagus | ESCC | 1.90e-03 | 3.38e-01 | 0.068 |
| 79621 | RNASEH2B | LZE24T | Human | Esophagus | ESCC | 4.26e-20 | 5.21e-01 | 0.0596 |
| 79621 | RNASEH2B | P1T-E | Human | Esophagus | ESCC | 1.96e-03 | 2.62e-01 | 0.0875 |
| 79621 | RNASEH2B | P2T-E | Human | Esophagus | ESCC | 1.49e-30 | 7.40e-01 | 0.1177 |
| 79621 | RNASEH2B | P4T-E | Human | Esophagus | ESCC | 1.42e-15 | 3.73e-01 | 0.1323 |
| 79621 | RNASEH2B | P5T-E | Human | Esophagus | ESCC | 3.15e-11 | 2.93e-01 | 0.1327 |
| 79621 | RNASEH2B | P8T-E | Human | Esophagus | ESCC | 1.72e-23 | 4.76e-01 | 0.0889 |
| 79621 | RNASEH2B | P9T-E | Human | Esophagus | ESCC | 4.63e-24 | 4.85e-01 | 0.1131 |
| 79621 | RNASEH2B | P10T-E | Human | Esophagus | ESCC | 2.08e-32 | 7.04e-01 | 0.116 |
| 79621 | RNASEH2B | P11T-E | Human | Esophagus | ESCC | 2.34e-13 | 5.82e-01 | 0.1426 |
| 79621 | RNASEH2B | P12T-E | Human | Esophagus | ESCC | 5.30e-35 | 7.56e-01 | 0.1122 |
| 79621 | RNASEH2B | P15T-E | Human | Esophagus | ESCC | 1.22e-29 | 5.91e-01 | 0.1149 |
| 79621 | RNASEH2B | P16T-E | Human | Esophagus | ESCC | 9.32e-12 | 3.62e-01 | 0.1153 |
| 79621 | RNASEH2B | P17T-E | Human | Esophagus | ESCC | 8.34e-07 | 4.19e-01 | 0.1278 |
| 79621 | RNASEH2B | P19T-E | Human | Esophagus | ESCC | 1.04e-14 | 6.19e-01 | 0.1662 |
| 79621 | RNASEH2B | P20T-E | Human | Esophagus | ESCC | 9.27e-17 | 3.91e-01 | 0.1124 |
| Page: 1 2 3 4 5 6 |
| Tissue | Expression Dynamics | Abbreviation |
| Esophagus |  | ESCC: Esophageal squamous cell carcinoma |
| HGIN: High-grade intraepithelial neoplasias | ||
| LGIN: Low-grade intraepithelial neoplasias | ||
| Liver | 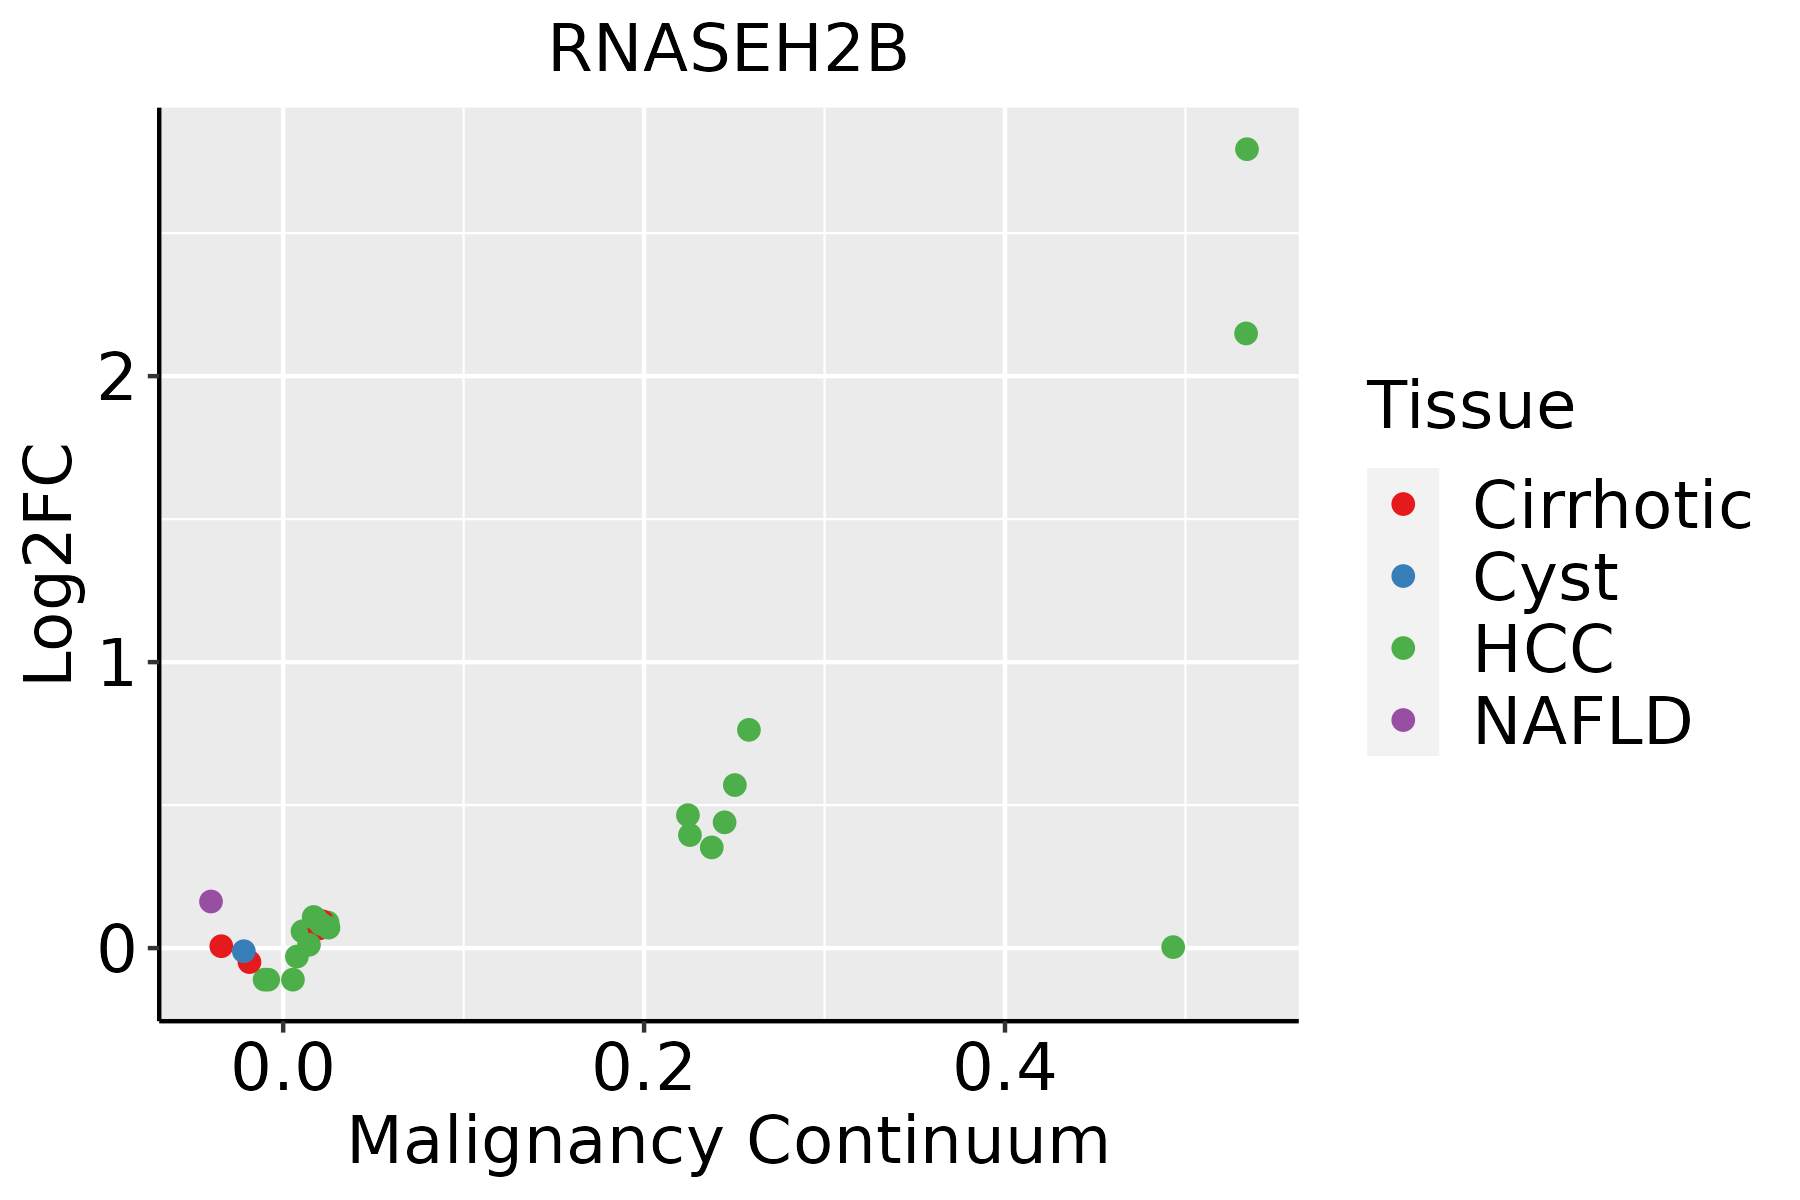 | HCC: Hepatocellular carcinoma |
| NAFLD: Non-alcoholic fatty liver disease | ||
| Oral Cavity | 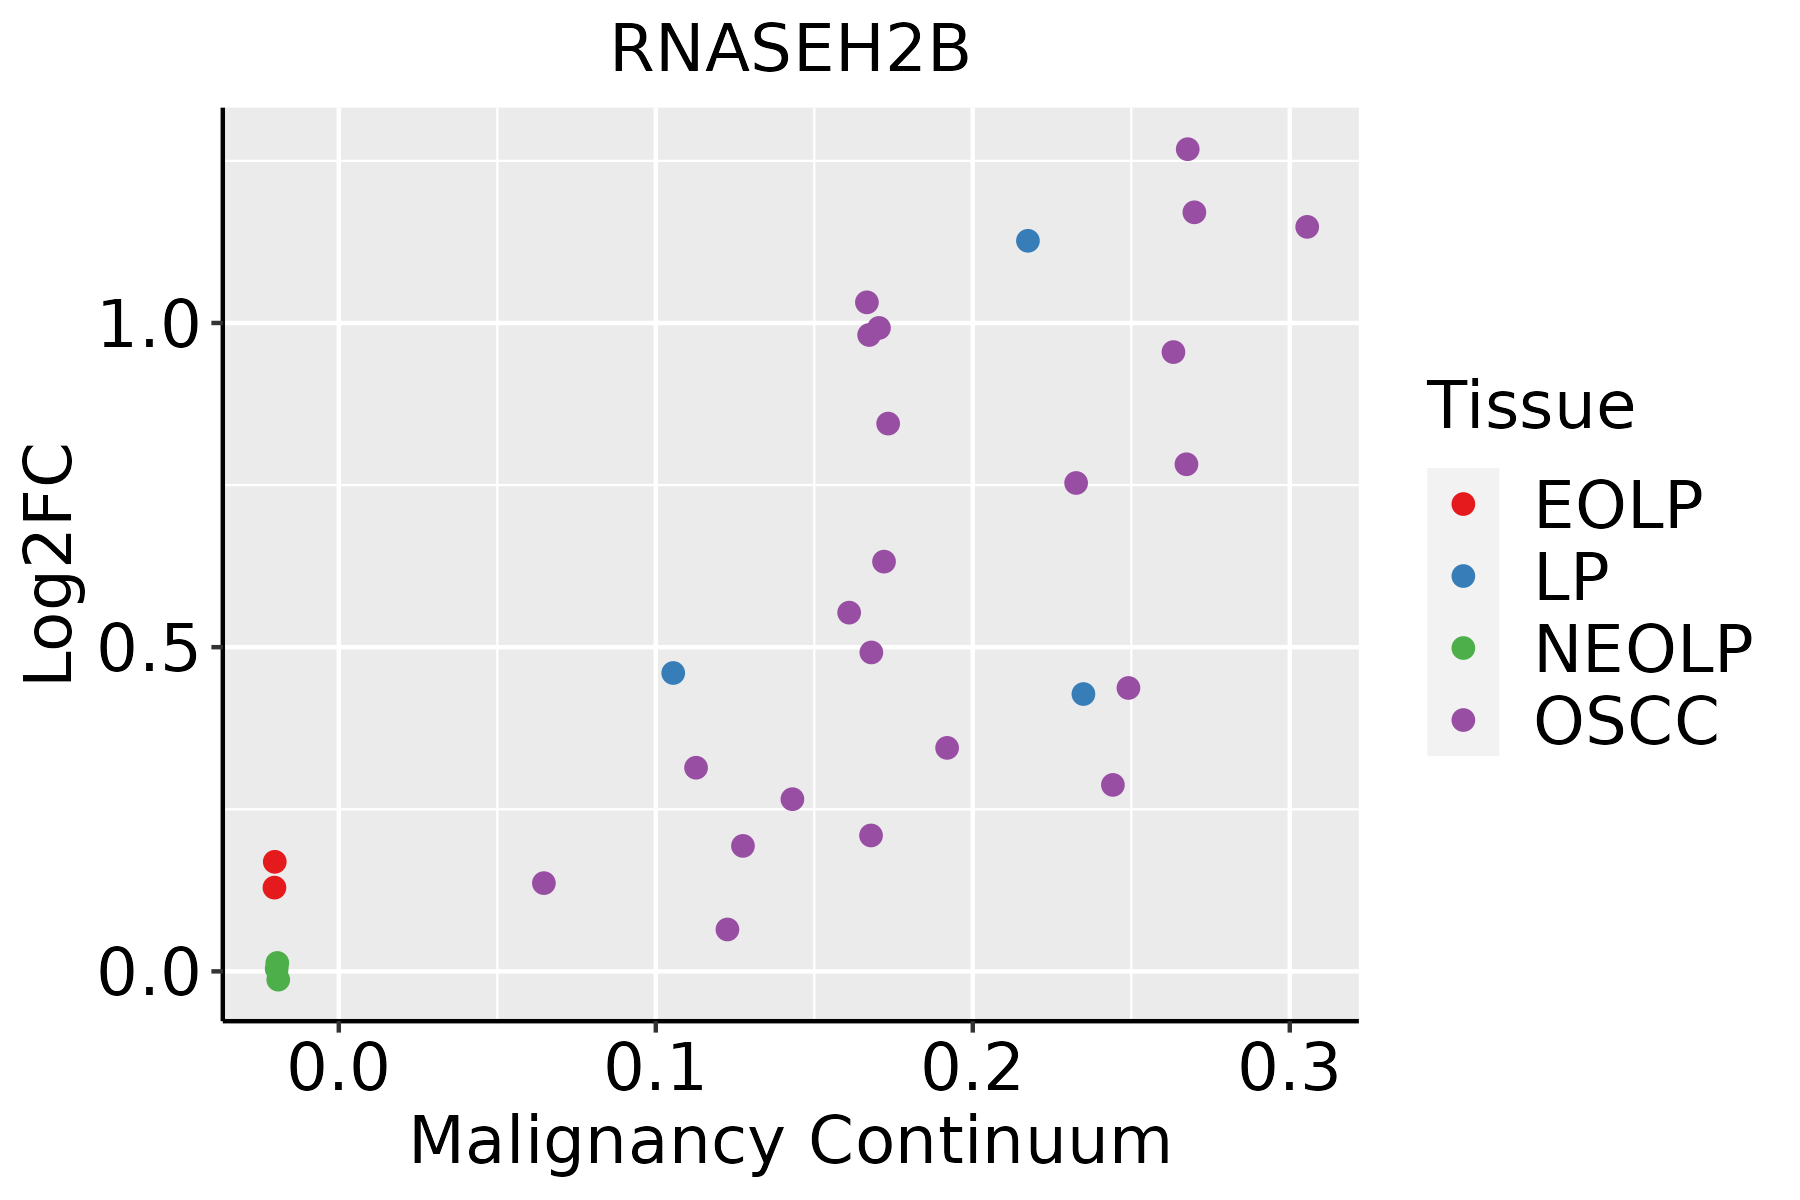 | EOLP: Erosive Oral lichen planus |
| LP: leukoplakia | ||
| NEOLP: Non-erosive oral lichen planus | ||
| OSCC: Oral squamous cell carcinoma | ||
| Skin | 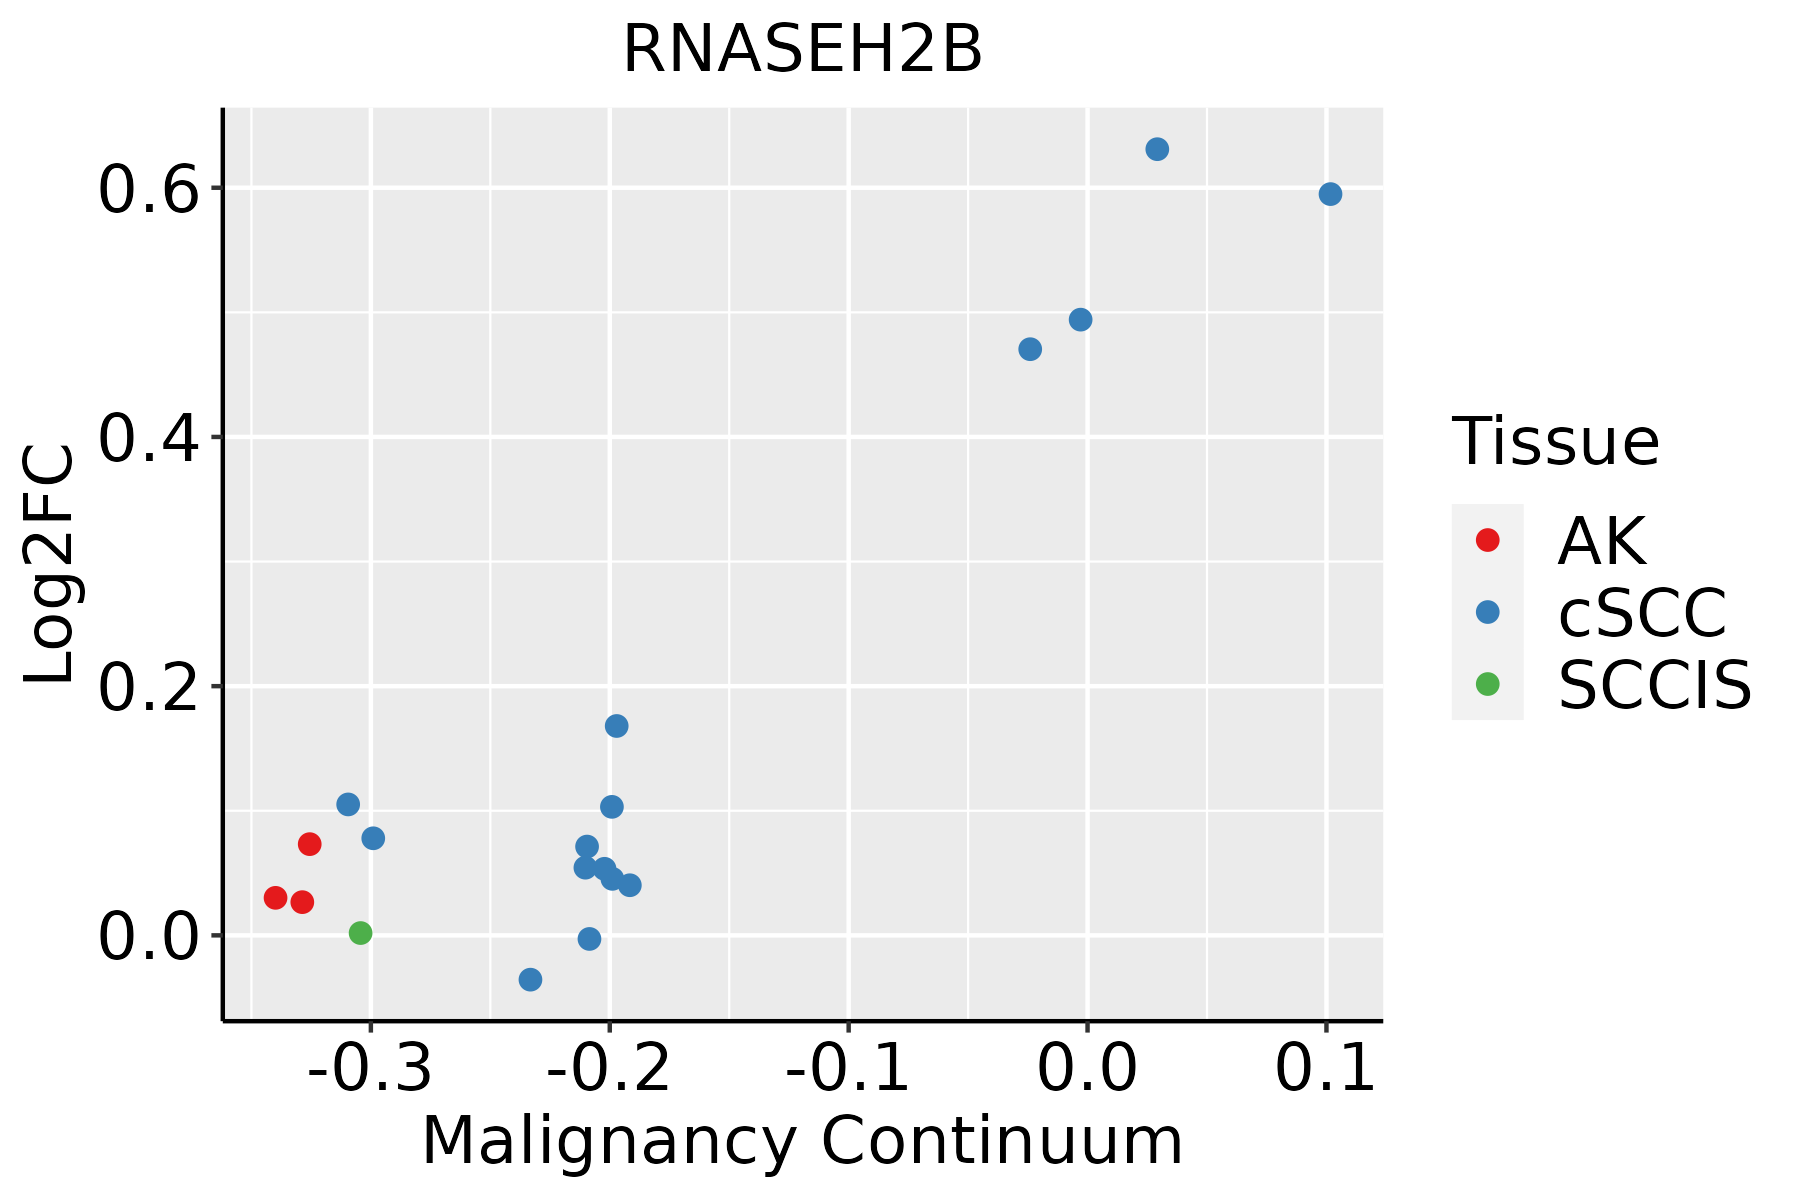 | AK: Actinic keratosis |
| cSCC: Cutaneous squamous cell carcinoma | ||
| SCCIS:squamous cell carcinoma in situ | ||
| Thyroid | 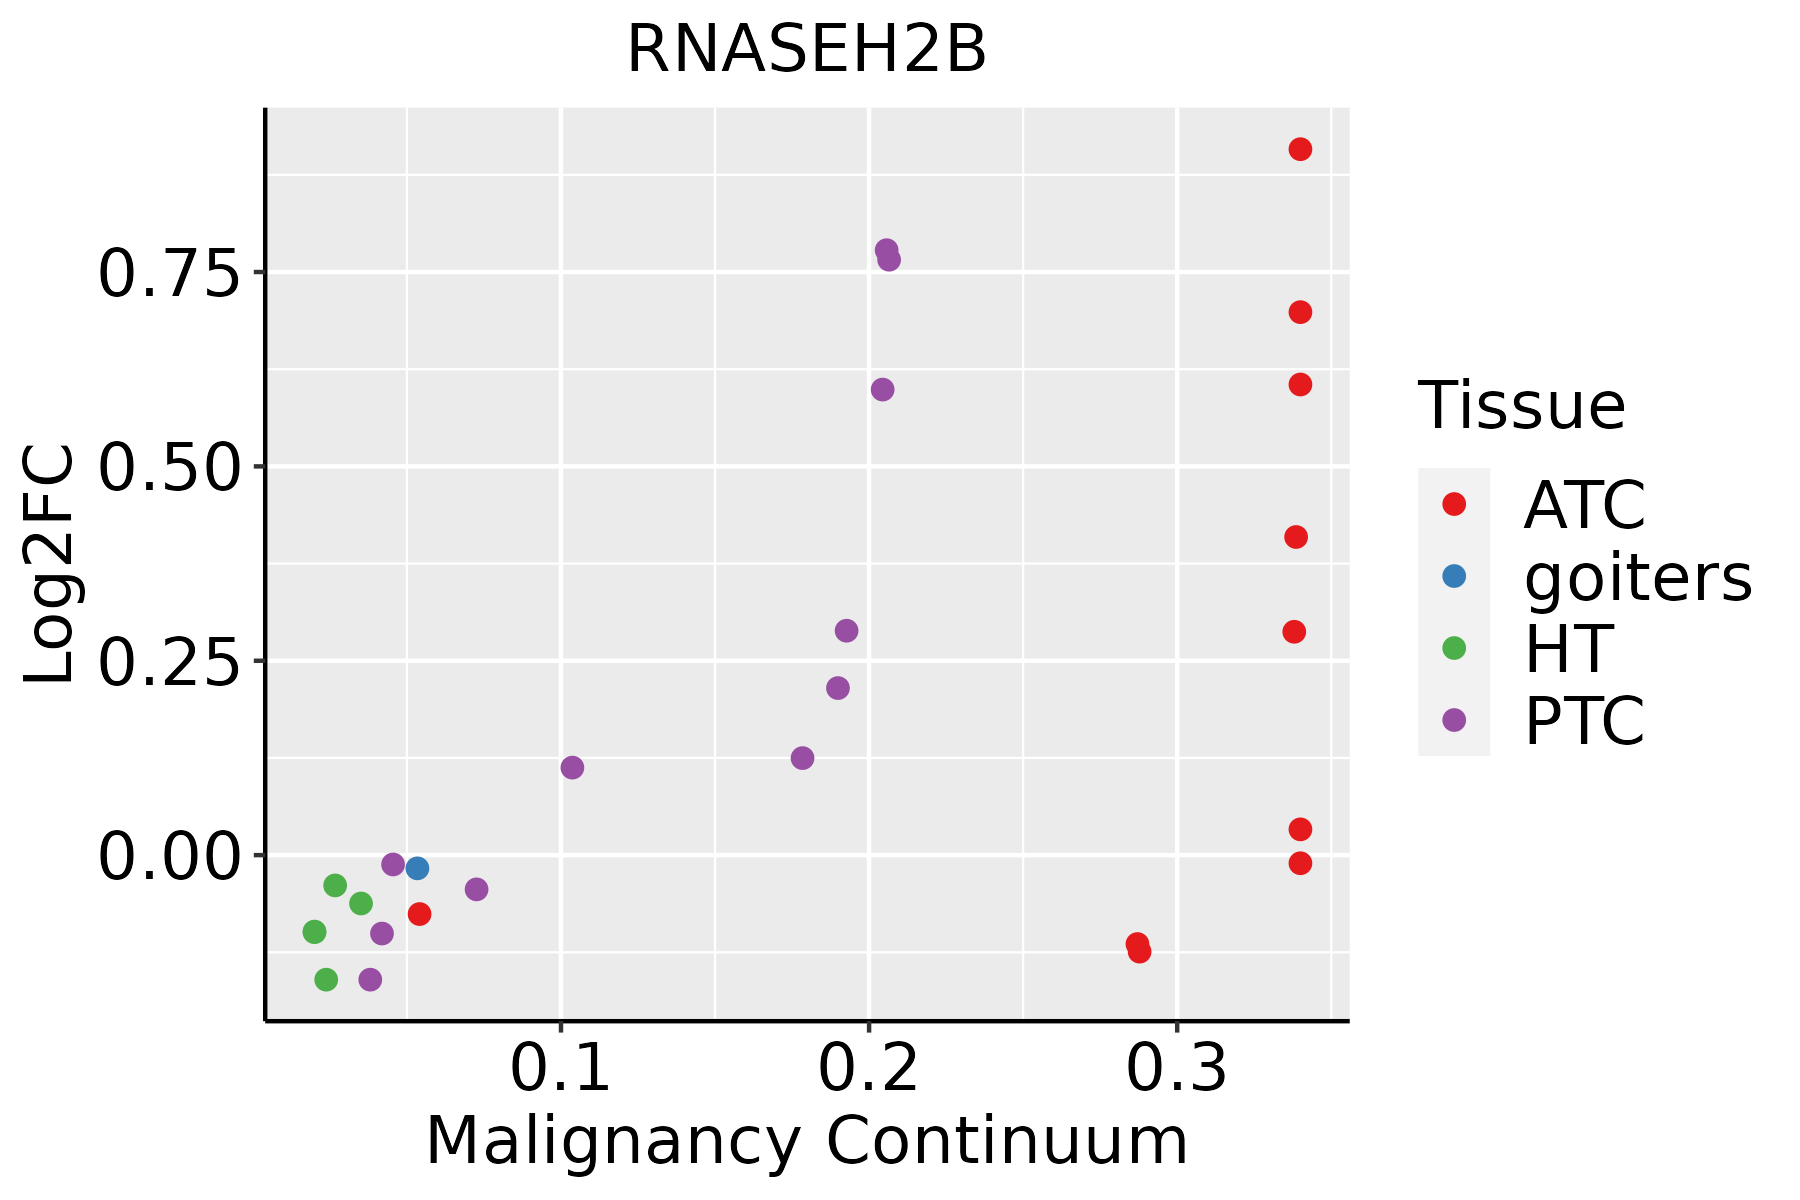 | ATC: Anaplastic thyroid cancer |
| HT: Hashimoto's thyroiditis | ||
| PTC: Papillary thyroid cancer |
| ∗log2FC in expression of this searched gene in stem-like cells from each diseased tissue sample relative to stem-like cells in normal samples in each tissue plotted against the malignancy continuum. Samples are colored based on if they are from different disease stage. |
Top |
Malignant transformation related pathway analysis |
| Find out the enriched GO biological processes and KEGG pathways involved in transition from healthy to precancer to cancer |
| Tissue | Disease Stage | Enriched GO biological Processes |
| Colorectum | AD |  |
| Colorectum | SER |  |
| Colorectum | MSS |  |
| Colorectum | MSI-H |  |
| Colorectum | FAP |  |
| ∗Top 15 enriched GO BP terms are showed in the bar plot of each disease state in each tissue. Each row represents a significant GO biological process which is colored according to the -log10(p.adjust). |
| Page: 1 2 3 4 5 6 7 8 9 |
| GO ID | Tissue | Disease Stage | Description | Gene Ratio | Bg Ratio | pvalue | p.adjust | Count |
| GO:0006401110 | Esophagus | ESCC | RNA catabolic process | 204/8552 | 278/18723 | 3.39e-21 | 5.66e-19 | 204 |
| GO:0034655110 | Esophagus | ESCC | nucleobase-containing compound catabolic process | 272/8552 | 407/18723 | 2.92e-18 | 2.90e-16 | 272 |
| GO:004477216 | Esophagus | ESCC | mitotic cell cycle phase transition | 281/8552 | 424/18723 | 4.63e-18 | 4.45e-16 | 281 |
| GO:000734615 | Esophagus | ESCC | regulation of mitotic cell cycle | 293/8552 | 457/18723 | 8.00e-16 | 5.64e-14 | 293 |
| GO:000170119 | Esophagus | ESCC | in utero embryonic development | 243/8552 | 367/18723 | 1.00e-15 | 6.86e-14 | 243 |
| GO:004670018 | Esophagus | ESCC | heterocycle catabolic process | 286/8552 | 445/18723 | 1.12e-15 | 7.47e-14 | 286 |
| GO:004427019 | Esophagus | ESCC | cellular nitrogen compound catabolic process | 288/8552 | 451/18723 | 3.03e-15 | 1.79e-13 | 288 |
| GO:001943918 | Esophagus | ESCC | aromatic compound catabolic process | 295/8552 | 467/18723 | 1.09e-14 | 5.98e-13 | 295 |
| GO:190136118 | Esophagus | ESCC | organic cyclic compound catabolic process | 307/8552 | 495/18723 | 9.99e-14 | 4.80e-12 | 307 |
| GO:190198713 | Esophagus | ESCC | regulation of cell cycle phase transition | 242/8552 | 390/18723 | 3.86e-11 | 1.26e-09 | 242 |
| GO:190199013 | Esophagus | ESCC | regulation of mitotic cell cycle phase transition | 191/8552 | 299/18723 | 1.35e-10 | 3.94e-09 | 191 |
| GO:00457865 | Esophagus | ESCC | negative regulation of cell cycle | 236/8552 | 385/18723 | 3.62e-10 | 9.93e-09 | 236 |
| GO:00000754 | Esophagus | ESCC | cell cycle checkpoint | 117/8552 | 169/18723 | 4.47e-10 | 1.17e-08 | 117 |
| GO:2001020110 | Esophagus | ESCC | regulation of response to DNA damage stimulus | 145/8552 | 219/18723 | 5.97e-10 | 1.50e-08 | 145 |
| GO:004277014 | Esophagus | ESCC | signal transduction in response to DNA damage | 117/8552 | 172/18723 | 2.38e-09 | 5.32e-08 | 117 |
| GO:00448394 | Esophagus | ESCC | cell cycle G2/M phase transition | 103/8552 | 148/18723 | 3.09e-09 | 6.67e-08 | 103 |
| GO:00000864 | Esophagus | ESCC | G2/M transition of mitotic cell cycle | 96/8552 | 137/18723 | 6.00e-09 | 1.23e-07 | 96 |
| GO:0006753110 | Esophagus | ESCC | nucleoside phosphate metabolic process | 288/8552 | 497/18723 | 1.80e-08 | 3.50e-07 | 288 |
| GO:0019693111 | Esophagus | ESCC | ribose phosphate metabolic process | 234/8552 | 396/18723 | 4.24e-08 | 7.76e-07 | 234 |
| GO:0009117111 | Esophagus | ESCC | nucleotide metabolic process | 282/8552 | 489/18723 | 4.70e-08 | 8.50e-07 | 282 |
| Page: 1 2 3 4 5 6 7 8 9 10 11 |
| Pathway ID | Tissue | Disease Stage | Description | Gene Ratio | Bg Ratio | pvalue | p.adjust | qvalue | Count |
| hsa030304 | Esophagus | ESCC | DNA replication | 32/4205 | 36/8465 | 7.71e-07 | 5.06e-06 | 2.59e-06 | 32 |
| hsa0303011 | Esophagus | ESCC | DNA replication | 32/4205 | 36/8465 | 7.71e-07 | 5.06e-06 | 2.59e-06 | 32 |
| hsa03030 | Oral cavity | OSCC | DNA replication | 31/3704 | 36/8465 | 1.70e-07 | 1.19e-06 | 6.03e-07 | 31 |
| hsa030301 | Oral cavity | OSCC | DNA replication | 31/3704 | 36/8465 | 1.70e-07 | 1.19e-06 | 6.03e-07 | 31 |
| hsa030302 | Oral cavity | LP | DNA replication | 23/2418 | 36/8465 | 1.08e-05 | 7.79e-05 | 5.02e-05 | 23 |
| hsa030303 | Oral cavity | LP | DNA replication | 23/2418 | 36/8465 | 1.08e-05 | 7.79e-05 | 5.02e-05 | 23 |
| Page: 1 |
Top |
Cell-cell communication analysis |
| Identification of potential cell-cell interactions between two cell types and their ligand-receptor pairs for different disease states |
| Ligand | Receptor | LRpair | Pathway | Tissue | Disease Stage |
| Page: 1 |
Top |
Single-cell gene regulatory network inference analysis |
| Find out the significant the regulons (TFs) and the target genes of each regulon across cell types for different disease states |
| TF | Cell Type | Tissue | Disease Stage | Target Gene | RSS | Regulon Activity |
| ∗The dot plots of a searched regulon are shown for all cell subpopulations in each disease state of each tissue based on the regulon specific score inferred using pySCENIC and by calculating the average expression. |
| Page: 1 |
Top |
Somatic mutation of malignant transformation related genes |
| Annotation of somatic variants for genes involved in malignant transformation |
| Hugo Symbol | Variant Class | Variant Classification | dbSNP RS | HGVSc | HGVSp | HGVSp Short | SWISSPROT | BIOTYPE | SIFT | PolyPhen | Tumor Sample Barcode | Tissue | Histology | Sex | Age | Stage | Therapy Types | Drugs | Outcome |
| RNASEH2B | SNV | Missense_Mutation | novel | c.737N>T | p.Ser246Leu | p.S246L | Q5TBB1 | protein_coding | tolerated(0.29) | benign(0.034) | TCGA-A7-A6VX-01 | Breast | breast invasive carcinoma | Female | >=65 | I/II | Chemotherapy | docetaxel | CR |
| RNASEH2B | SNV | Missense_Mutation | novel | c.681N>A | p.Asp227Glu | p.D227E | Q5TBB1 | protein_coding | tolerated(0.65) | benign(0.06) | TCGA-AN-A046-01 | Breast | breast invasive carcinoma | Female | >=65 | I/II | Unknown | Unknown | SD |
| RNASEH2B | SNV | Missense_Mutation | novel | c.458A>C | p.Lys153Thr | p.K153T | Q5TBB1 | protein_coding | tolerated(0.08) | possibly_damaging(0.659) | TCGA-2W-A8YY-01 | Cervix | cervical & endocervical cancer | Female | <65 | I/II | Chemotherapy | cisplatin | CR |
| RNASEH2B | SNV | Missense_Mutation | c.923A>C | p.Lys308Thr | p.K308T | Q5TBB1 | protein_coding | tolerated_low_confidence(0.09) | benign(0.001) | TCGA-A6-4107-01 | Colorectum | colon adenocarcinoma | Female | <65 | III/IV | Chemotherapy | 5 | SD | |
| RNASEH2B | SNV | Missense_Mutation | c.557G>A | p.Ser186Asn | p.S186N | Q5TBB1 | protein_coding | tolerated(0.06) | benign(0.067) | TCGA-AA-A02R-01 | Colorectum | colon adenocarcinoma | Female | >=65 | I/II | Unknown | Unknown | PD | |
| RNASEH2B | SNV | Missense_Mutation | c.141N>C | p.Glu47Asp | p.E47D | Q5TBB1 | protein_coding | tolerated(0.14) | benign(0.001) | TCGA-CM-6171-01 | Colorectum | colon adenocarcinoma | Female | >=65 | I/II | Unknown | Unknown | SD | |
| RNASEH2B | SNV | Missense_Mutation | c.544N>G | p.Asn182Asp | p.N182D | Q5TBB1 | protein_coding | tolerated(0.3) | benign(0.003) | TCGA-AF-A56N-01 | Colorectum | rectum adenocarcinoma | Female | <65 | I/II | Chemotherapy | xeloda | CR | |
| RNASEH2B | SNV | Missense_Mutation | c.238N>A | p.Gln80Lys | p.Q80K | Q5TBB1 | protein_coding | tolerated(0.12) | probably_damaging(0.976) | TCGA-A5-A0GP-01 | Endometrium | uterine corpus endometrioid carcinoma | Female | <65 | I/II | Unknown | Unknown | SD | |
| RNASEH2B | SNV | Missense_Mutation | novel | c.781N>T | p.Asp261Tyr | p.D261Y | Q5TBB1 | protein_coding | deleterious(0) | probably_damaging(1) | TCGA-AJ-A3EL-01 | Endometrium | uterine corpus endometrioid carcinoma | Female | <65 | I/II | Unknown | Unknown | SD |
| RNASEH2B | SNV | Missense_Mutation | c.374N>A | p.Cys125Tyr | p.C125Y | Q5TBB1 | protein_coding | deleterious(0) | probably_damaging(0.928) | TCGA-AP-A059-01 | Endometrium | uterine corpus endometrioid carcinoma | Female | >=65 | I/II | Unknown | Unknown | SD |
| Page: 1 2 3 4 |
Top |
Related drugs of malignant transformation related genes |
| Identification of chemicals and drugs interact with genes involved in malignant transfromation |
| (DGIdb 4.0) |
| Entrez ID | Symbol | Category | Interaction Types | Drug Claim Name | Drug Name | PMIDs |
| Page: 1 |

Copyright 2023-Present -The University of Texas Health Science Center at Houston |