
|
|||||
|
 | |
| |
| |
| |
| |
| |
|
Gene: RNASEH2A |
Gene summary for RNASEH2A |
| Gene information | Species | Human | Gene symbol | RNASEH2A | Gene ID | 10535 |
| Gene name | ribonuclease H2 subunit A | |
| Gene Alias | AGS4 | |
| Cytomap | 19p13.13 | |
| Gene Type | protein-coding | GO ID | GO:0006139 | UniProtAcc | O75792 |
Top |
Malignant transformation analysis |
| Identification of the aberrant gene expression in precancerous and cancerous lesions by comparing the gene expression of stem-like cells in diseased tissues with normal stem cells |
| Entrez ID | Symbol | Replicates | Species | Organ | Tissue | Adj P-value | Log2FC | Malignancy |
| 10535 | RNASEH2A | LZE4T | Human | Esophagus | ESCC | 4.31e-07 | 1.88e-01 | 0.0811 |
| 10535 | RNASEH2A | LZE7T | Human | Esophagus | ESCC | 3.59e-07 | 4.92e-01 | 0.0667 |
| 10535 | RNASEH2A | LZE22D1 | Human | Esophagus | HGIN | 1.29e-03 | 2.05e-01 | 0.0595 |
| 10535 | RNASEH2A | LZE22T | Human | Esophagus | ESCC | 1.07e-04 | 4.76e-01 | 0.068 |
| 10535 | RNASEH2A | LZE24T | Human | Esophagus | ESCC | 2.67e-14 | 3.65e-01 | 0.0596 |
| 10535 | RNASEH2A | LZE21T | Human | Esophagus | ESCC | 2.23e-03 | 2.85e-01 | 0.0655 |
| 10535 | RNASEH2A | LZE6T | Human | Esophagus | ESCC | 8.65e-08 | 4.89e-01 | 0.0845 |
| 10535 | RNASEH2A | P1T-E | Human | Esophagus | ESCC | 2.49e-08 | 5.56e-01 | 0.0875 |
| 10535 | RNASEH2A | P2T-E | Human | Esophagus | ESCC | 3.16e-36 | 7.73e-01 | 0.1177 |
| 10535 | RNASEH2A | P4T-E | Human | Esophagus | ESCC | 2.58e-39 | 9.36e-01 | 0.1323 |
| 10535 | RNASEH2A | P5T-E | Human | Esophagus | ESCC | 1.60e-43 | 9.78e-01 | 0.1327 |
| 10535 | RNASEH2A | P8T-E | Human | Esophagus | ESCC | 1.64e-27 | 7.31e-01 | 0.0889 |
| 10535 | RNASEH2A | P9T-E | Human | Esophagus | ESCC | 1.85e-19 | 4.70e-01 | 0.1131 |
| 10535 | RNASEH2A | P10T-E | Human | Esophagus | ESCC | 2.26e-28 | 6.25e-01 | 0.116 |
| 10535 | RNASEH2A | P11T-E | Human | Esophagus | ESCC | 2.33e-08 | 3.35e-01 | 0.1426 |
| 10535 | RNASEH2A | P12T-E | Human | Esophagus | ESCC | 3.98e-20 | 4.67e-01 | 0.1122 |
| 10535 | RNASEH2A | P15T-E | Human | Esophagus | ESCC | 5.74e-19 | 4.85e-01 | 0.1149 |
| 10535 | RNASEH2A | P16T-E | Human | Esophagus | ESCC | 2.81e-09 | 4.11e-01 | 0.1153 |
| 10535 | RNASEH2A | P17T-E | Human | Esophagus | ESCC | 1.80e-17 | 7.34e-01 | 0.1278 |
| 10535 | RNASEH2A | P19T-E | Human | Esophagus | ESCC | 3.18e-15 | 1.48e+00 | 0.1662 |
| Page: 1 2 3 4 5 |
| Tissue | Expression Dynamics | Abbreviation |
| Esophagus |  | ESCC: Esophageal squamous cell carcinoma |
| HGIN: High-grade intraepithelial neoplasias | ||
| LGIN: Low-grade intraepithelial neoplasias | ||
| Oral Cavity | 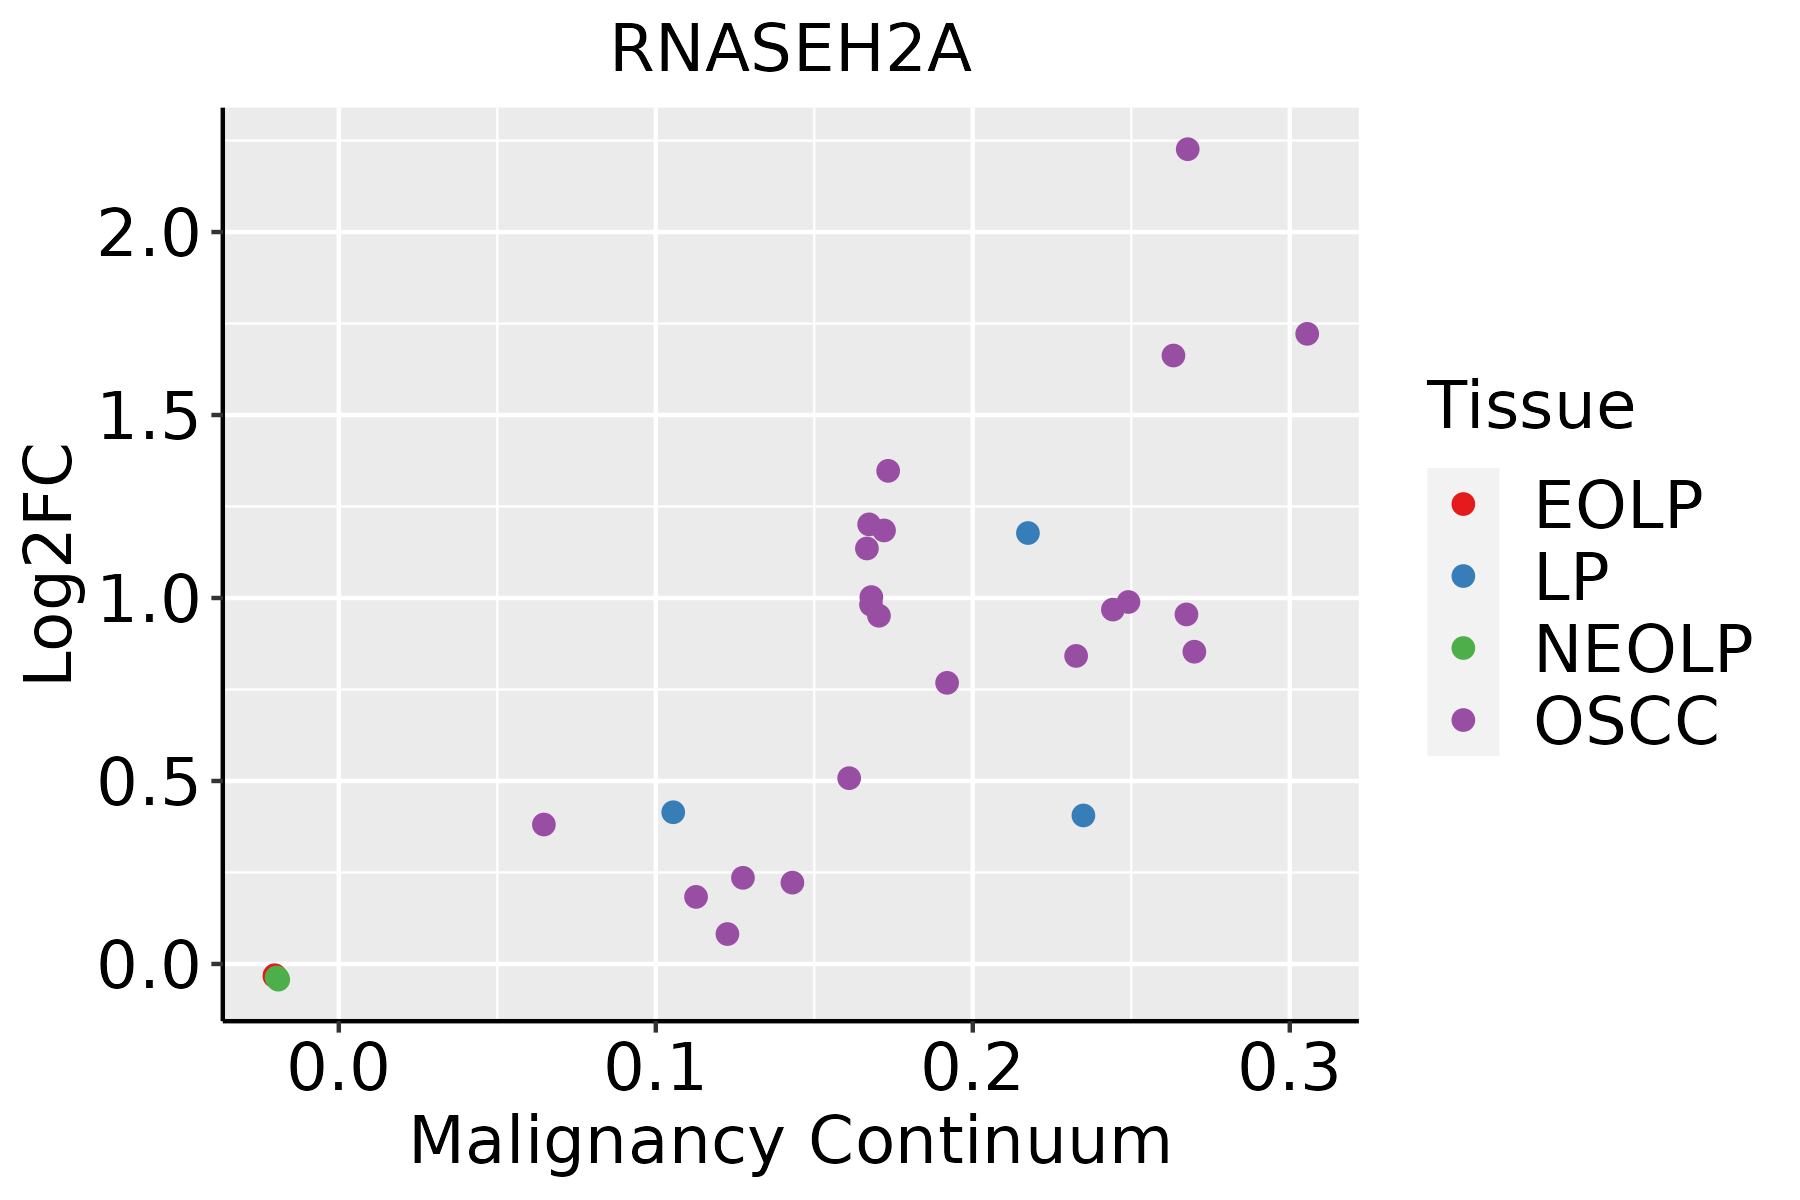 | EOLP: Erosive Oral lichen planus |
| LP: leukoplakia | ||
| NEOLP: Non-erosive oral lichen planus | ||
| OSCC: Oral squamous cell carcinoma | ||
| Skin | 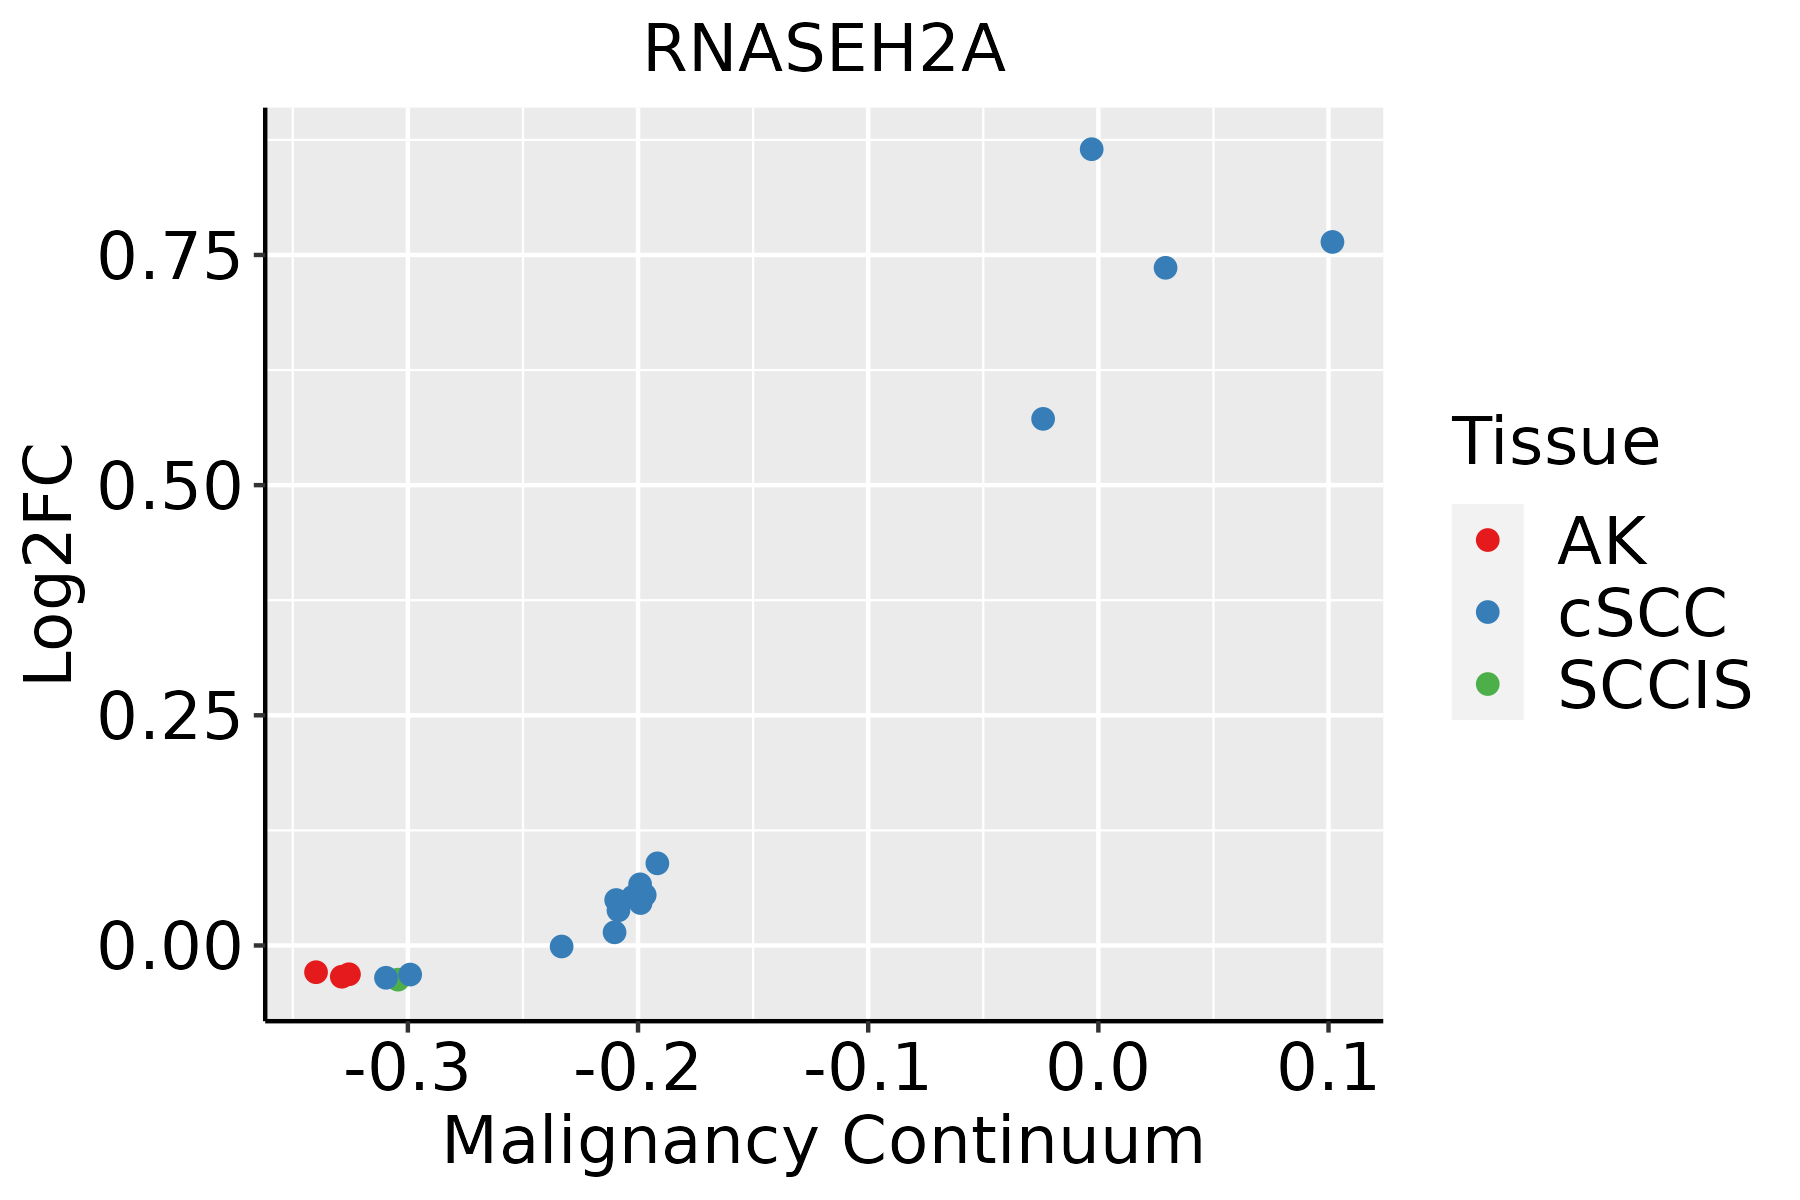 | AK: Actinic keratosis |
| cSCC: Cutaneous squamous cell carcinoma | ||
| SCCIS:squamous cell carcinoma in situ |
| ∗log2FC in expression of this searched gene in stem-like cells from each diseased tissue sample relative to stem-like cells in normal samples in each tissue plotted against the malignancy continuum. Samples are colored based on if they are from different disease stage. |
Top |
Malignant transformation related pathway analysis |
| Find out the enriched GO biological processes and KEGG pathways involved in transition from healthy to precancer to cancer |
| Tissue | Disease Stage | Enriched GO biological Processes |
| Colorectum | AD |  |
| Colorectum | SER |  |
| Colorectum | MSS |  |
| Colorectum | MSI-H |  |
| Colorectum | FAP |  |
| ∗Top 15 enriched GO BP terms are showed in the bar plot of each disease state in each tissue. Each row represents a significant GO biological process which is colored according to the -log10(p.adjust). |
| Page: 1 2 3 4 5 6 7 8 9 |
| GO ID | Tissue | Disease Stage | Description | Gene Ratio | Bg Ratio | pvalue | p.adjust | Count |
| GO:000640120 | Esophagus | HGIN | RNA catabolic process | 77/2587 | 278/18723 | 7.63e-10 | 6.36e-08 | 77 |
| GO:003465519 | Esophagus | HGIN | nucleobase-containing compound catabolic process | 98/2587 | 407/18723 | 1.44e-08 | 8.94e-07 | 98 |
| GO:004670017 | Esophagus | HGIN | heterocycle catabolic process | 103/2587 | 445/18723 | 5.44e-08 | 2.99e-06 | 103 |
| GO:004427018 | Esophagus | HGIN | cellular nitrogen compound catabolic process | 103/2587 | 451/18723 | 1.10e-07 | 5.56e-06 | 103 |
| GO:001943917 | Esophagus | HGIN | aromatic compound catabolic process | 105/2587 | 467/18723 | 1.89e-07 | 9.31e-06 | 105 |
| GO:190136117 | Esophagus | HGIN | organic cyclic compound catabolic process | 106/2587 | 495/18723 | 1.94e-06 | 7.13e-05 | 106 |
| GO:0006401110 | Esophagus | ESCC | RNA catabolic process | 204/8552 | 278/18723 | 3.39e-21 | 5.66e-19 | 204 |
| GO:0034655110 | Esophagus | ESCC | nucleobase-containing compound catabolic process | 272/8552 | 407/18723 | 2.92e-18 | 2.90e-16 | 272 |
| GO:004670018 | Esophagus | ESCC | heterocycle catabolic process | 286/8552 | 445/18723 | 1.12e-15 | 7.47e-14 | 286 |
| GO:004427019 | Esophagus | ESCC | cellular nitrogen compound catabolic process | 288/8552 | 451/18723 | 3.03e-15 | 1.79e-13 | 288 |
| GO:00062604 | Esophagus | ESCC | DNA replication | 181/8552 | 260/18723 | 3.55e-15 | 2.05e-13 | 181 |
| GO:001943918 | Esophagus | ESCC | aromatic compound catabolic process | 295/8552 | 467/18723 | 1.09e-14 | 5.98e-13 | 295 |
| GO:190136118 | Esophagus | ESCC | organic cyclic compound catabolic process | 307/8552 | 495/18723 | 9.99e-14 | 4.80e-12 | 307 |
| GO:00905013 | Esophagus | ESCC | RNA phosphodiester bond hydrolysis | 110/8552 | 152/18723 | 1.95e-11 | 6.81e-10 | 110 |
| GO:00903053 | Esophagus | ESCC | nucleic acid phosphodiester bond hydrolysis | 163/8552 | 261/18723 | 3.07e-08 | 5.73e-07 | 163 |
| GO:00905023 | Esophagus | ESCC | RNA phosphodiester bond hydrolysis, endonucleolytic | 55/8552 | 82/18723 | 7.34e-05 | 5.51e-04 | 55 |
| GO:000640118 | Oral cavity | OSCC | RNA catabolic process | 184/7305 | 278/18723 | 2.71e-20 | 4.19e-18 | 184 |
| GO:003465517 | Oral cavity | OSCC | nucleobase-containing compound catabolic process | 244/7305 | 407/18723 | 5.38e-18 | 5.49e-16 | 244 |
| GO:004670015 | Oral cavity | OSCC | heterocycle catabolic process | 254/7305 | 445/18723 | 5.07e-15 | 3.31e-13 | 254 |
| GO:004427016 | Oral cavity | OSCC | cellular nitrogen compound catabolic process | 256/7305 | 451/18723 | 9.67e-15 | 5.88e-13 | 256 |
| Page: 1 2 3 |
| Pathway ID | Tissue | Disease Stage | Description | Gene Ratio | Bg Ratio | pvalue | p.adjust | qvalue | Count |
| hsa030304 | Esophagus | ESCC | DNA replication | 32/4205 | 36/8465 | 7.71e-07 | 5.06e-06 | 2.59e-06 | 32 |
| hsa0303011 | Esophagus | ESCC | DNA replication | 32/4205 | 36/8465 | 7.71e-07 | 5.06e-06 | 2.59e-06 | 32 |
| hsa03030 | Oral cavity | OSCC | DNA replication | 31/3704 | 36/8465 | 1.70e-07 | 1.19e-06 | 6.03e-07 | 31 |
| hsa030301 | Oral cavity | OSCC | DNA replication | 31/3704 | 36/8465 | 1.70e-07 | 1.19e-06 | 6.03e-07 | 31 |
| hsa030302 | Oral cavity | LP | DNA replication | 23/2418 | 36/8465 | 1.08e-05 | 7.79e-05 | 5.02e-05 | 23 |
| hsa030303 | Oral cavity | LP | DNA replication | 23/2418 | 36/8465 | 1.08e-05 | 7.79e-05 | 5.02e-05 | 23 |
| Page: 1 |
Top |
Cell-cell communication analysis |
| Identification of potential cell-cell interactions between two cell types and their ligand-receptor pairs for different disease states |
| Ligand | Receptor | LRpair | Pathway | Tissue | Disease Stage |
| Page: 1 |
Top |
Single-cell gene regulatory network inference analysis |
| Find out the significant the regulons (TFs) and the target genes of each regulon across cell types for different disease states |
| TF | Cell Type | Tissue | Disease Stage | Target Gene | RSS | Regulon Activity |
| ∗The dot plots of a searched regulon are shown for all cell subpopulations in each disease state of each tissue based on the regulon specific score inferred using pySCENIC and by calculating the average expression. |
| Page: 1 |
Top |
Somatic mutation of malignant transformation related genes |
| Annotation of somatic variants for genes involved in malignant transformation |
| Hugo Symbol | Variant Class | Variant Classification | dbSNP RS | HGVSc | HGVSp | HGVSp Short | SWISSPROT | BIOTYPE | SIFT | PolyPhen | Tumor Sample Barcode | Tissue | Histology | Sex | Age | Stage | Therapy Types | Drugs | Outcome |
| RNASEH2A | SNV | Missense_Mutation | rs79767407 | c.690N>A | p.Phe230Leu | p.F230L | O75792 | protein_coding | deleterious(0) | possibly_damaging(0.868) | TCGA-AC-A23H-01 | Breast | breast invasive carcinoma | Female | >=65 | I/II | Unknown | Unknown | PD |
| RNASEH2A | SNV | Missense_Mutation | c.851N>T | p.Ser284Phe | p.S284F | O75792 | protein_coding | deleterious(0.04) | benign(0.106) | TCGA-AC-A23H-01 | Breast | breast invasive carcinoma | Female | >=65 | I/II | Unknown | Unknown | PD | |
| RNASEH2A | SNV | Missense_Mutation | c.736N>A | p.Glu246Lys | p.E246K | O75792 | protein_coding | tolerated(0.09) | benign(0.015) | TCGA-B6-A0I2-01 | Breast | breast invasive carcinoma | Female | <65 | I/II | Unknown | Unknown | SD | |
| RNASEH2A | insertion | Frame_Shift_Ins | novel | c.501_502insAGCGGGAAAGGCTGTTTGCGAAAATGGAGGACACGGACTTTGTC | p.Ala168SerfsTer38 | p.A168Sfs*38 | O75792 | protein_coding | TCGA-A8-A06P-01 | Breast | breast invasive carcinoma | Female | <65 | III/IV | Unspecific | SD | |||
| RNASEH2A | SNV | Missense_Mutation | c.397N>A | p.Val133Met | p.V133M | O75792 | protein_coding | deleterious(0) | possibly_damaging(0.849) | TCGA-AZ-6598-01 | Colorectum | colon adenocarcinoma | Female | >=65 | I/II | Unknown | Unknown | SD | |
| RNASEH2A | SNV | Missense_Mutation | novel | c.316C>T | p.Leu106Phe | p.L106F | O75792 | protein_coding | tolerated(0.11) | possibly_damaging(0.518) | TCGA-CM-6171-01 | Colorectum | colon adenocarcinoma | Female | >=65 | I/II | Unknown | Unknown | SD |
| RNASEH2A | SNV | Missense_Mutation | c.397N>A | p.Val133Met | p.V133M | O75792 | protein_coding | deleterious(0) | possibly_damaging(0.849) | TCGA-AG-A02N-01 | Colorectum | rectum adenocarcinoma | Male | >=65 | I/II | Chemotherapy | folinic | CR | |
| RNASEH2A | SNV | Missense_Mutation | c.274N>A | p.Ala92Thr | p.A92T | O75792 | protein_coding | deleterious(0.04) | possibly_damaging(0.547) | TCGA-A5-A0VQ-01 | Endometrium | uterine corpus endometrioid carcinoma | Female | <65 | I/II | Chemotherapy | carboplatin | SD | |
| RNASEH2A | SNV | Missense_Mutation | rs766343269 | c.175N>C | p.Asp59His | p.D59H | O75792 | protein_coding | tolerated(0.14) | benign(0.151) | TCGA-AX-A06D-01 | Endometrium | uterine corpus endometrioid carcinoma | Female | >=65 | III/IV | Chemotherapy | carboplatin | PD |
| RNASEH2A | SNV | Missense_Mutation | rs369325444 | c.452N>T | p.Ala151Val | p.A151V | O75792 | protein_coding | tolerated(0.25) | benign(0.023) | TCGA-AX-A0J1-01 | Endometrium | uterine corpus endometrioid carcinoma | Female | >=65 | I/II | Unknown | Unknown | SD |
| Page: 1 2 3 |
Top |
Related drugs of malignant transformation related genes |
| Identification of chemicals and drugs interact with genes involved in malignant transfromation |
| (DGIdb 4.0) |
| Entrez ID | Symbol | Category | Interaction Types | Drug Claim Name | Drug Name | PMIDs |
| 10535 | RNASEH2A | ENZYME | PROGESTERONE | PROGESTERONE | 12080023 | |
| 10535 | RNASEH2A | ENZYME | TGFBETA1 | 15084595 | ||
| 10535 | RNASEH2A | ENZYME | CAPSAICIN | CAPSAICIN | 10087087 | |
| 10535 | RNASEH2A | ENZYME | TRANSFORMING GROWTH FACTOR | 7547241 |
| Page: 1 |

Copyright 2023-Present -The University of Texas Health Science Center at Houston |