
|
|||||
|
 | |
| |
| |
| |
| |
| |
|
Gene: RNASE7 |
Gene summary for RNASE7 |
| Gene information | Species | Human | Gene symbol | RNASE7 | Gene ID | 84659 |
| Gene name | ribonuclease A family member 7 | |
| Gene Alias | RAE1 | |
| Cytomap | 14q11.2 | |
| Gene Type | protein-coding | GO ID | GO:0002376 | UniProtAcc | Q9H1E1 |
Top |
Malignant transformation analysis |
| Identification of the aberrant gene expression in precancerous and cancerous lesions by comparing the gene expression of stem-like cells in diseased tissues with normal stem cells |
| Entrez ID | Symbol | Replicates | Species | Organ | Tissue | Adj P-value | Log2FC | Malignancy |
| 84659 | RNASE7 | P11T-E | Human | Esophagus | ESCC | 9.07e-04 | 1.75e-01 | 0.1426 |
| 84659 | RNASE7 | P17T-E | Human | Esophagus | ESCC | 8.50e-05 | 3.12e-01 | 0.1278 |
| 84659 | RNASE7 | P26T-E | Human | Esophagus | ESCC | 3.50e-02 | 7.01e-02 | 0.1276 |
| 84659 | RNASE7 | P37T-E | Human | Esophagus | ESCC | 4.28e-02 | 1.05e-01 | 0.1371 |
| 84659 | RNASE7 | P38T-E | Human | Esophagus | ESCC | 4.54e-11 | 7.48e-01 | 0.127 |
| 84659 | RNASE7 | P47T-E | Human | Esophagus | ESCC | 3.50e-02 | 1.04e-01 | 0.1067 |
| 84659 | RNASE7 | P49T-E | Human | Esophagus | ESCC | 5.57e-05 | 8.32e-01 | 0.1768 |
| 84659 | RNASE7 | P61T-E | Human | Esophagus | ESCC | 6.45e-07 | 1.92e-01 | 0.099 |
| 84659 | RNASE7 | P89T-E | Human | Esophagus | ESCC | 4.36e-04 | 1.06e+00 | 0.1752 |
| 84659 | RNASE7 | P126T-E | Human | Esophagus | ESCC | 5.94e-06 | 9.97e-01 | 0.1125 |
| 84659 | RNASE7 | P130T-E | Human | Esophagus | ESCC | 1.97e-10 | 3.11e-01 | 0.1676 |
| 84659 | RNASE7 | C04 | Human | Oral cavity | OSCC | 1.85e-02 | 3.18e-01 | 0.2633 |
| 84659 | RNASE7 | C21 | Human | Oral cavity | OSCC | 1.24e-21 | 7.31e-01 | 0.2678 |
| 84659 | RNASE7 | C57 | Human | Oral cavity | OSCC | 2.40e-08 | 5.13e-01 | 0.1679 |
| 84659 | RNASE7 | C06 | Human | Oral cavity | OSCC | 3.55e-04 | 4.87e-01 | 0.2699 |
| 84659 | RNASE7 | SYSMH3 | Human | Oral cavity | OSCC | 5.17e-06 | 2.18e-01 | 0.2442 |
| 84659 | RNASE7 | SYSMH5 | Human | Oral cavity | OSCC | 2.04e-02 | 1.52e-01 | 0.0647 |
| Page: 1 |
| Tissue | Expression Dynamics | Abbreviation |
| Esophagus | 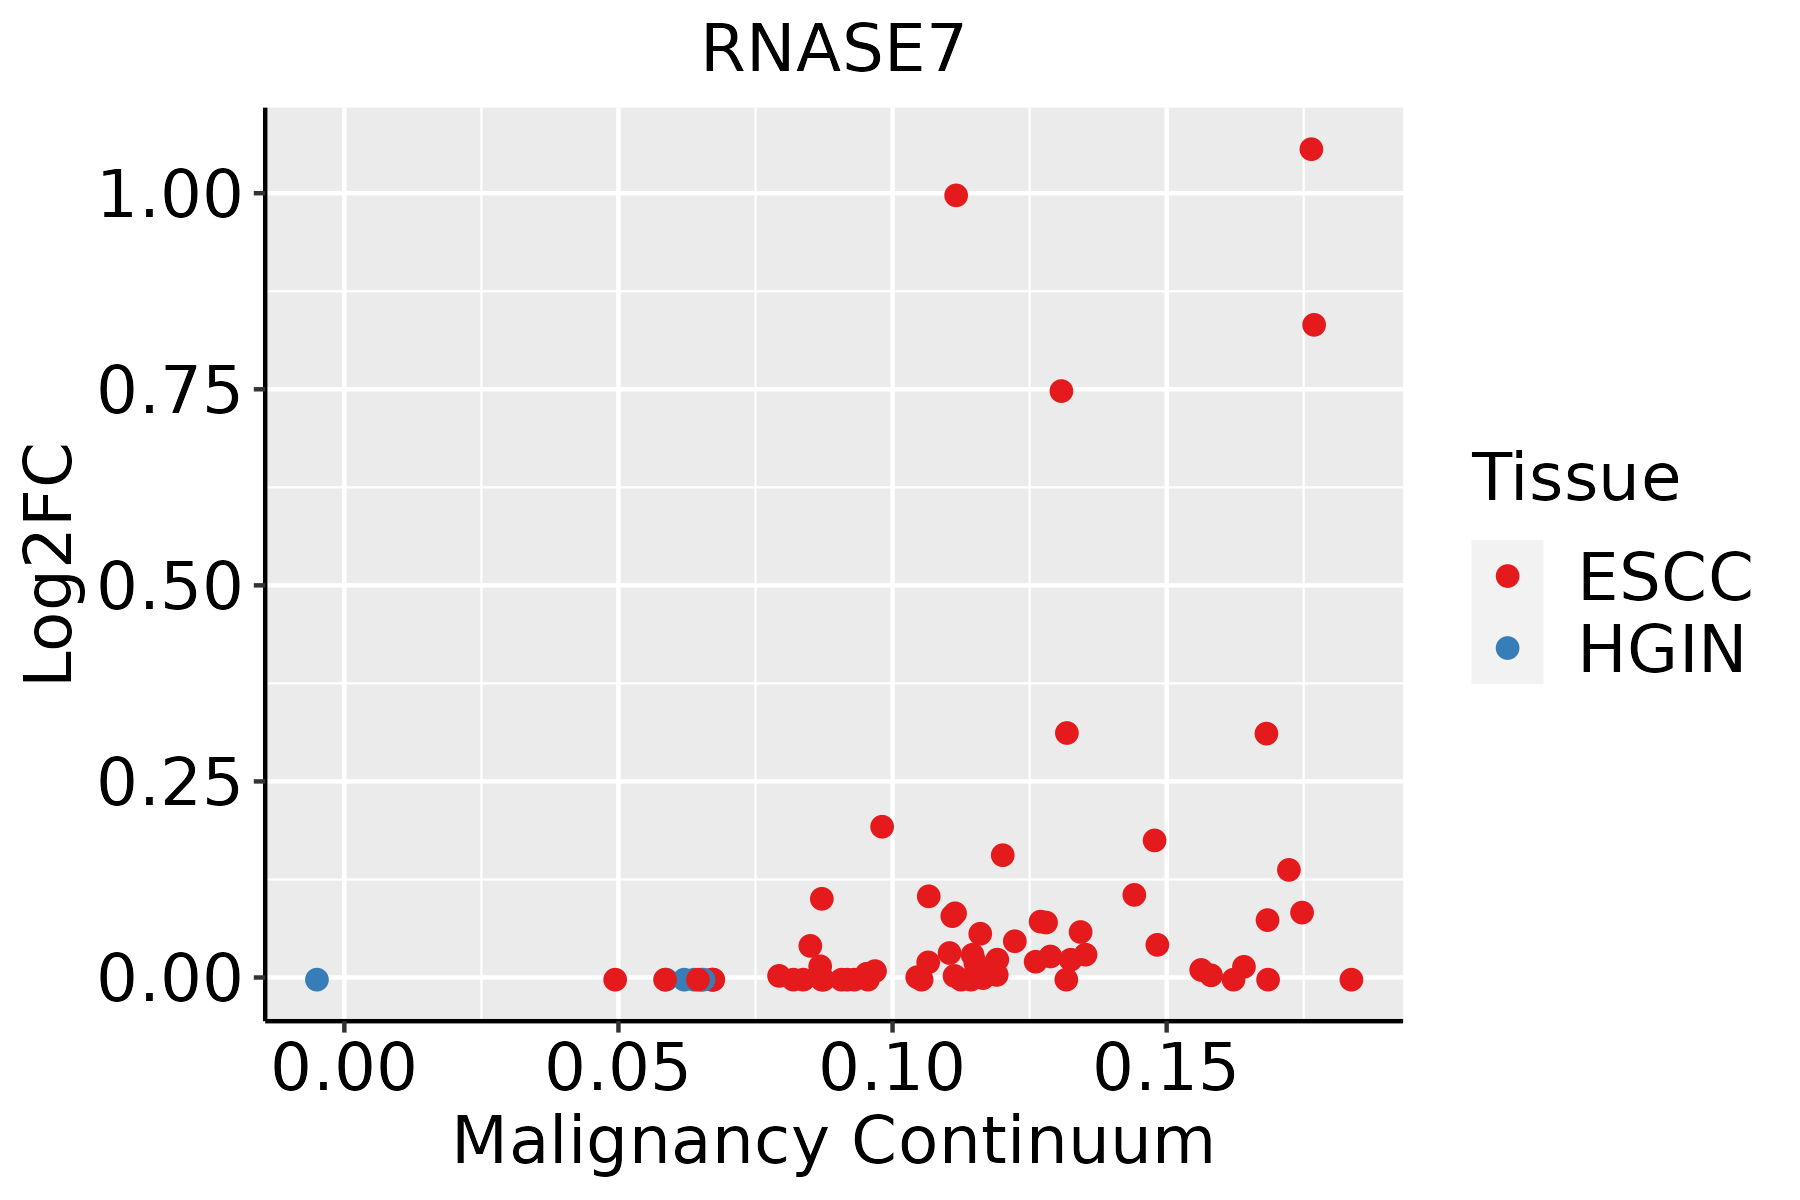 | ESCC: Esophageal squamous cell carcinoma |
| HGIN: High-grade intraepithelial neoplasias | ||
| LGIN: Low-grade intraepithelial neoplasias | ||
| Oral Cavity | 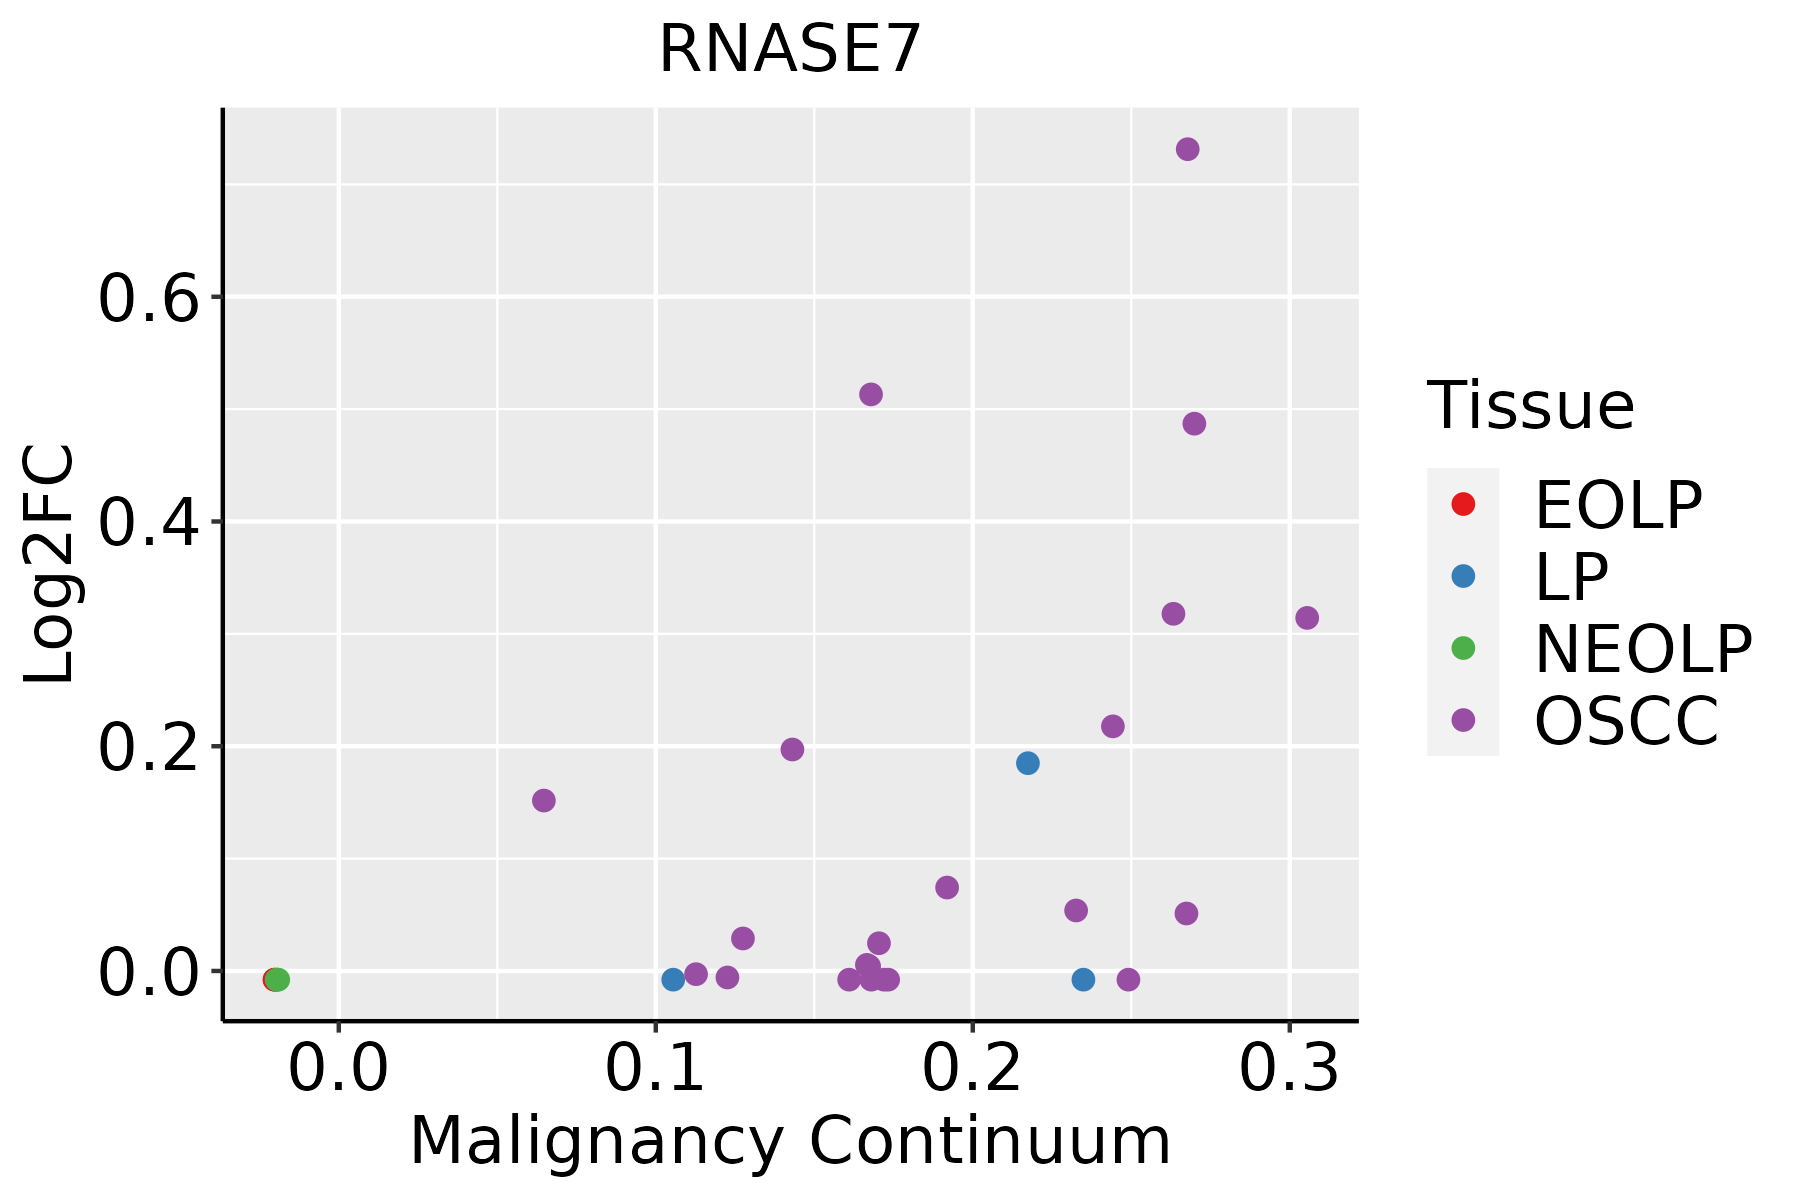 | EOLP: Erosive Oral lichen planus |
| LP: leukoplakia | ||
| NEOLP: Non-erosive oral lichen planus | ||
| OSCC: Oral squamous cell carcinoma |
| ∗log2FC in expression of this searched gene in stem-like cells from each diseased tissue sample relative to stem-like cells in normal samples in each tissue plotted against the malignancy continuum. Samples are colored based on if they are from different disease stage. |
Top |
Malignant transformation related pathway analysis |
| Find out the enriched GO biological processes and KEGG pathways involved in transition from healthy to precancer to cancer |
| Tissue | Disease Stage | Enriched GO biological Processes |
| Colorectum | AD |  |
| Colorectum | SER |  |
| Colorectum | MSS |  |
| Colorectum | MSI-H |  |
| Colorectum | FAP |  |
| ∗Top 15 enriched GO BP terms are showed in the bar plot of each disease state in each tissue. Each row represents a significant GO biological process which is colored according to the -log10(p.adjust). |
| Page: 1 2 3 4 5 6 7 8 9 |
| GO ID | Tissue | Disease Stage | Description | Gene Ratio | Bg Ratio | pvalue | p.adjust | Count |
| GO:00905013 | Esophagus | ESCC | RNA phosphodiester bond hydrolysis | 110/8552 | 152/18723 | 1.95e-11 | 6.81e-10 | 110 |
| GO:00903053 | Esophagus | ESCC | nucleic acid phosphodiester bond hydrolysis | 163/8552 | 261/18723 | 3.07e-08 | 5.73e-07 | 163 |
| GO:003582114 | Esophagus | ESCC | modulation of process of other organism | 64/8552 | 106/18723 | 1.61e-03 | 7.50e-03 | 64 |
| GO:00905012 | Oral cavity | OSCC | RNA phosphodiester bond hydrolysis | 95/7305 | 152/18723 | 3.65e-09 | 8.22e-08 | 95 |
| GO:00903052 | Oral cavity | OSCC | nucleic acid phosphodiester bond hydrolysis | 142/7305 | 261/18723 | 2.90e-07 | 4.43e-06 | 142 |
| GO:00358218 | Oral cavity | OSCC | modulation of process of other organism | 64/7305 | 106/18723 | 6.70e-06 | 7.36e-05 | 64 |
| Page: 1 |
| Pathway ID | Tissue | Disease Stage | Description | Gene Ratio | Bg Ratio | pvalue | p.adjust | qvalue | Count |
| Page: 1 |
Top |
Cell-cell communication analysis |
| Identification of potential cell-cell interactions between two cell types and their ligand-receptor pairs for different disease states |
| Ligand | Receptor | LRpair | Pathway | Tissue | Disease Stage |
| Page: 1 |
Top |
Single-cell gene regulatory network inference analysis |
| Find out the significant the regulons (TFs) and the target genes of each regulon across cell types for different disease states |
| TF | Cell Type | Tissue | Disease Stage | Target Gene | RSS | Regulon Activity |
| ∗The dot plots of a searched regulon are shown for all cell subpopulations in each disease state of each tissue based on the regulon specific score inferred using pySCENIC and by calculating the average expression. |
| Page: 1 |
Top |
Somatic mutation of malignant transformation related genes |
| Annotation of somatic variants for genes involved in malignant transformation |
| Hugo Symbol | Variant Class | Variant Classification | dbSNP RS | HGVSc | HGVSp | HGVSp Short | SWISSPROT | BIOTYPE | SIFT | PolyPhen | Tumor Sample Barcode | Tissue | Histology | Sex | Age | Stage | Therapy Types | Drugs | Outcome |
| RNASE7 | SNV | Missense_Mutation | novel | c.273N>T | p.Lys91Asn | p.K91N | Q9H1E1 | protein_coding | deleterious(0.03) | probably_damaging(0.999) | TCGA-AN-A046-01 | Breast | breast invasive carcinoma | Female | >=65 | I/II | Unknown | Unknown | SD |
| RNASE7 | SNV | Missense_Mutation | c.371N>T | p.Lys124Met | p.K124M | Q9H1E1 | protein_coding | tolerated(0.07) | possibly_damaging(0.646) | TCGA-D8-A1XQ-01 | Breast | breast invasive carcinoma | Female | >=65 | I/II | Unknown | Unknown | SD | |
| RNASE7 | SNV | Missense_Mutation | rs371662364 | c.391G>A | p.Val131Ile | p.V131I | Q9H1E1 | protein_coding | tolerated(1) | benign(0) | TCGA-AA-3947-01 | Colorectum | colon adenocarcinoma | Female | <65 | I/II | Unknown | Unknown | SD |
| RNASE7 | SNV | Missense_Mutation | c.413A>G | p.Gln138Arg | p.Q138R | Q9H1E1 | protein_coding | deleterious(0.04) | benign(0.322) | TCGA-AA-A022-01 | Colorectum | colon adenocarcinoma | Female | >=65 | I/II | Unknown | Unknown | SD | |
| RNASE7 | insertion | Frame_Shift_Ins | novel | c.170dupA | p.Asn57LysfsTer3 | p.N57Kfs*3 | Q9H1E1 | protein_coding | TCGA-QG-A5Z2-01 | Colorectum | colon adenocarcinoma | Male | <65 | I/II | Unknown | Unknown | SD | ||
| RNASE7 | SNV | Missense_Mutation | novel | c.389A>G | p.Tyr130Cys | p.Y130C | Q9H1E1 | protein_coding | deleterious(0) | probably_damaging(0.989) | TCGA-A5-A0G1-01 | Endometrium | uterine corpus endometrioid carcinoma | Female | >=65 | I/II | Unknown | Unknown | SD |
| RNASE7 | SNV | Missense_Mutation | novel | c.161C>T | p.Ala54Val | p.A54V | Q9H1E1 | protein_coding | deleterious(0.04) | possibly_damaging(0.809) | TCGA-A5-A0G2-01 | Endometrium | uterine corpus endometrioid carcinoma | Female | <65 | III/IV | Unknown | Unknown | SD |
| RNASE7 | SNV | Missense_Mutation | c.337N>C | p.Ser113Pro | p.S113P | Q9H1E1 | protein_coding | deleterious(0.04) | probably_damaging(0.998) | TCGA-A5-A0GB-01 | Endometrium | uterine corpus endometrioid carcinoma | Female | >=65 | I/II | Unknown | Unknown | SD | |
| RNASE7 | SNV | Missense_Mutation | rs371662364 | c.391N>A | p.Val131Ile | p.V131I | Q9H1E1 | protein_coding | tolerated(1) | benign(0) | TCGA-AP-A1DV-01 | Endometrium | uterine corpus endometrioid carcinoma | Female | <65 | I/II | Unknown | Unknown | SD |
| RNASE7 | SNV | Missense_Mutation | c.421G>T | p.Asp141Tyr | p.D141Y | Q9H1E1 | protein_coding | deleterious(0.02) | benign(0.399) | TCGA-AX-A05U-01 | Endometrium | uterine corpus endometrioid carcinoma | Female | <65 | I/II | Unknown | Unknown | SD |
| Page: 1 2 |
Top |
Related drugs of malignant transformation related genes |
| Identification of chemicals and drugs interact with genes involved in malignant transfromation |
| (DGIdb 4.0) |
| Entrez ID | Symbol | Category | Interaction Types | Drug Claim Name | Drug Name | PMIDs |
| Page: 1 |

Copyright 2023-Present -The University of Texas Health Science Center at Houston |