
|
|||||
|
 | |
| |
| |
| |
| |
| |
|
Gene: RMND5B |
Gene summary for RMND5B |
| Gene information | Species | Human | Gene symbol | RMND5B | Gene ID | 64777 |
| Gene name | required for meiotic nuclear division 5 homolog B | |
| Gene Alias | GID2 | |
| Cytomap | 5q35.3 | |
| Gene Type | protein-coding | GO ID | GO:0006464 | UniProtAcc | B3KSG5 |
Top |
Malignant transformation analysis |
| Identification of the aberrant gene expression in precancerous and cancerous lesions by comparing the gene expression of stem-like cells in diseased tissues with normal stem cells |
| Entrez ID | Symbol | Replicates | Species | Organ | Tissue | Adj P-value | Log2FC | Malignancy |
| 64777 | RMND5B | LZE20T | Human | Esophagus | ESCC | 4.07e-02 | 1.09e-01 | 0.0662 |
| 64777 | RMND5B | LZE24T | Human | Esophagus | ESCC | 2.91e-12 | 4.00e-01 | 0.0596 |
| 64777 | RMND5B | LZE21T | Human | Esophagus | ESCC | 1.05e-02 | 1.97e-01 | 0.0655 |
| 64777 | RMND5B | P2T-E | Human | Esophagus | ESCC | 2.29e-18 | 3.21e-01 | 0.1177 |
| 64777 | RMND5B | P4T-E | Human | Esophagus | ESCC | 1.15e-15 | 3.48e-01 | 0.1323 |
| 64777 | RMND5B | P5T-E | Human | Esophagus | ESCC | 6.43e-07 | 1.55e-01 | 0.1327 |
| 64777 | RMND5B | P8T-E | Human | Esophagus | ESCC | 1.57e-16 | 2.32e-01 | 0.0889 |
| 64777 | RMND5B | P10T-E | Human | Esophagus | ESCC | 5.02e-06 | 7.48e-02 | 0.116 |
| 64777 | RMND5B | P11T-E | Human | Esophagus | ESCC | 2.71e-05 | 1.89e-01 | 0.1426 |
| 64777 | RMND5B | P12T-E | Human | Esophagus | ESCC | 8.84e-16 | 2.60e-01 | 0.1122 |
| 64777 | RMND5B | P15T-E | Human | Esophagus | ESCC | 3.44e-13 | 2.93e-01 | 0.1149 |
| 64777 | RMND5B | P16T-E | Human | Esophagus | ESCC | 3.11e-15 | 1.95e-01 | 0.1153 |
| 64777 | RMND5B | P17T-E | Human | Esophagus | ESCC | 5.99e-07 | 2.67e-01 | 0.1278 |
| 64777 | RMND5B | P20T-E | Human | Esophagus | ESCC | 9.15e-04 | 1.26e-01 | 0.1124 |
| 64777 | RMND5B | P21T-E | Human | Esophagus | ESCC | 4.93e-12 | 1.93e-01 | 0.1617 |
| 64777 | RMND5B | P22T-E | Human | Esophagus | ESCC | 3.30e-22 | 3.57e-01 | 0.1236 |
| 64777 | RMND5B | P23T-E | Human | Esophagus | ESCC | 3.94e-09 | 2.37e-01 | 0.108 |
| 64777 | RMND5B | P24T-E | Human | Esophagus | ESCC | 1.32e-06 | 9.99e-02 | 0.1287 |
| 64777 | RMND5B | P26T-E | Human | Esophagus | ESCC | 2.09e-11 | 2.02e-01 | 0.1276 |
| 64777 | RMND5B | P27T-E | Human | Esophagus | ESCC | 1.31e-15 | 2.37e-01 | 0.1055 |
| Page: 1 2 3 4 |
| Tissue | Expression Dynamics | Abbreviation |
| Esophagus | 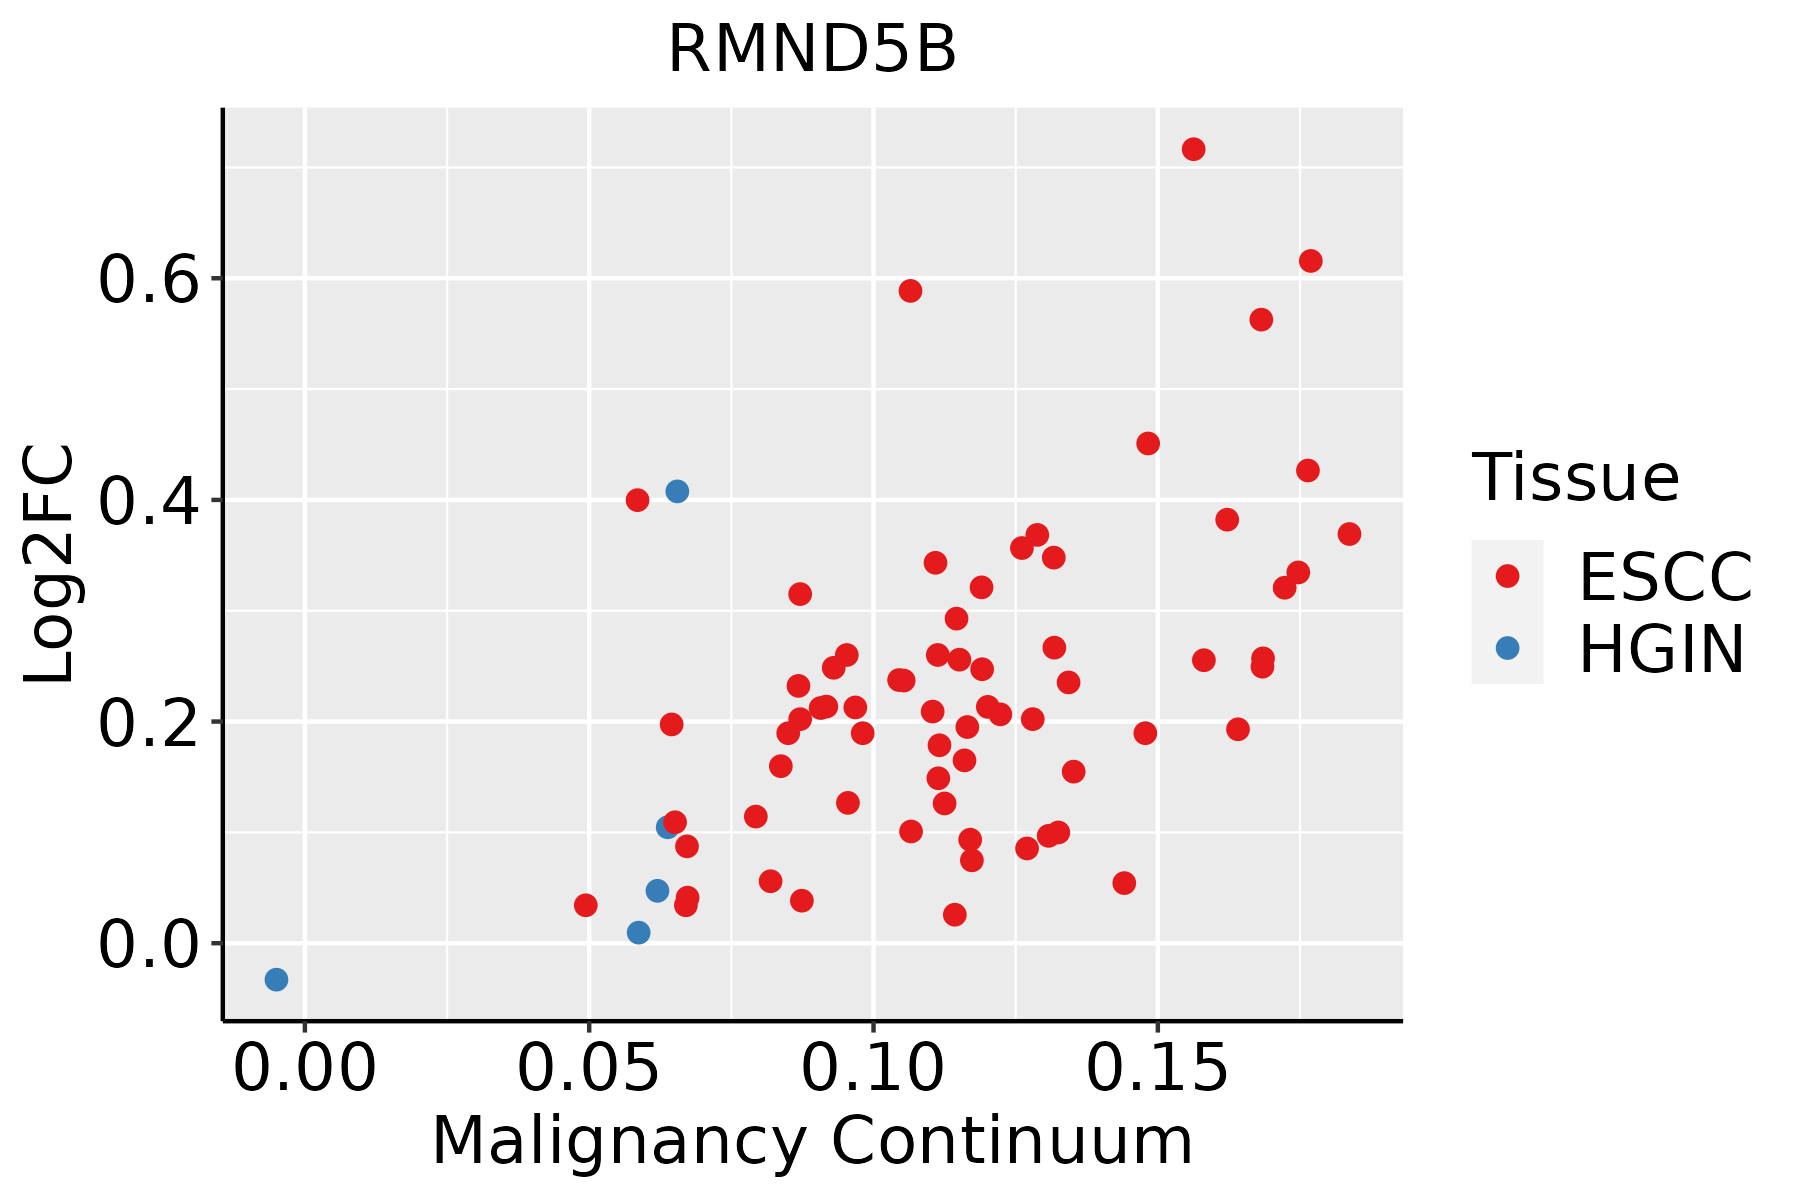 | ESCC: Esophageal squamous cell carcinoma |
| HGIN: High-grade intraepithelial neoplasias | ||
| LGIN: Low-grade intraepithelial neoplasias | ||
| Oral Cavity | 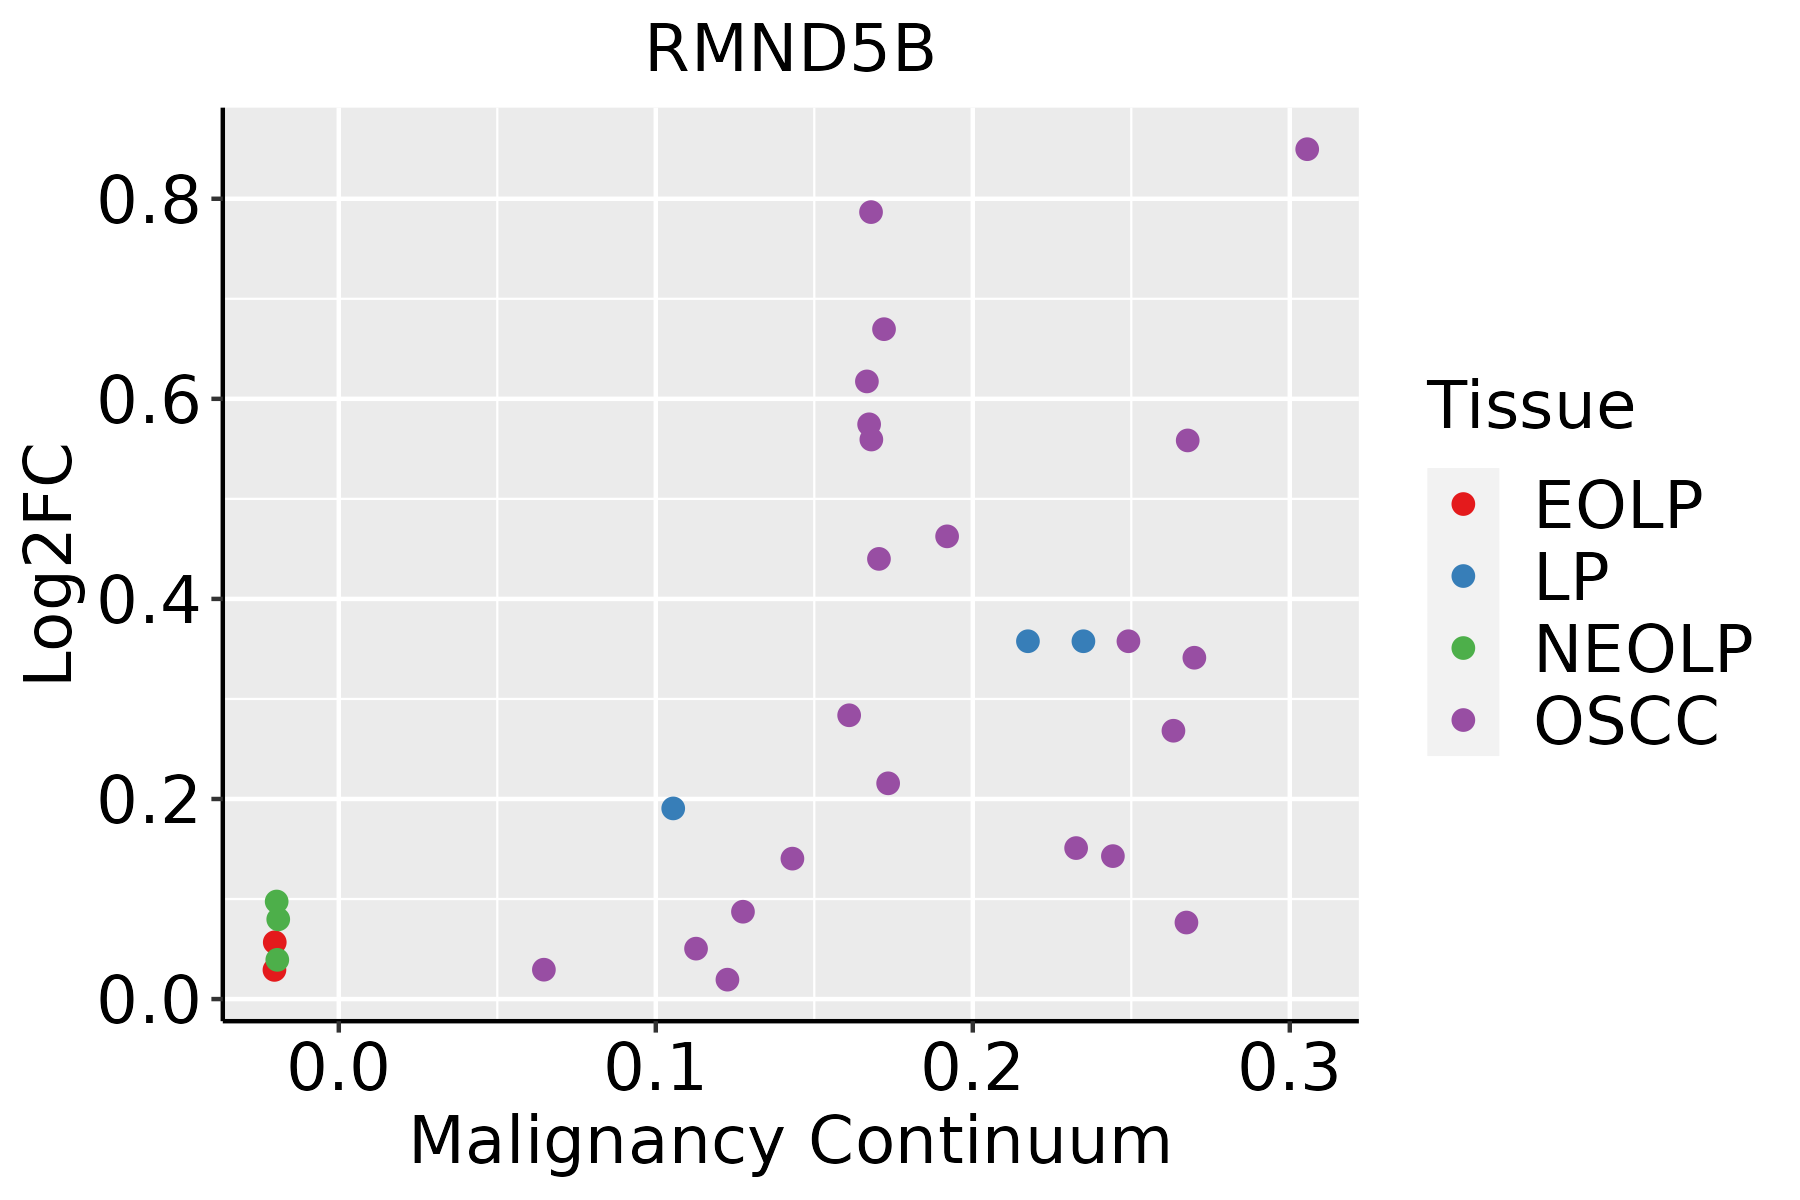 | EOLP: Erosive Oral lichen planus |
| LP: leukoplakia | ||
| NEOLP: Non-erosive oral lichen planus | ||
| OSCC: Oral squamous cell carcinoma | ||
| Thyroid | 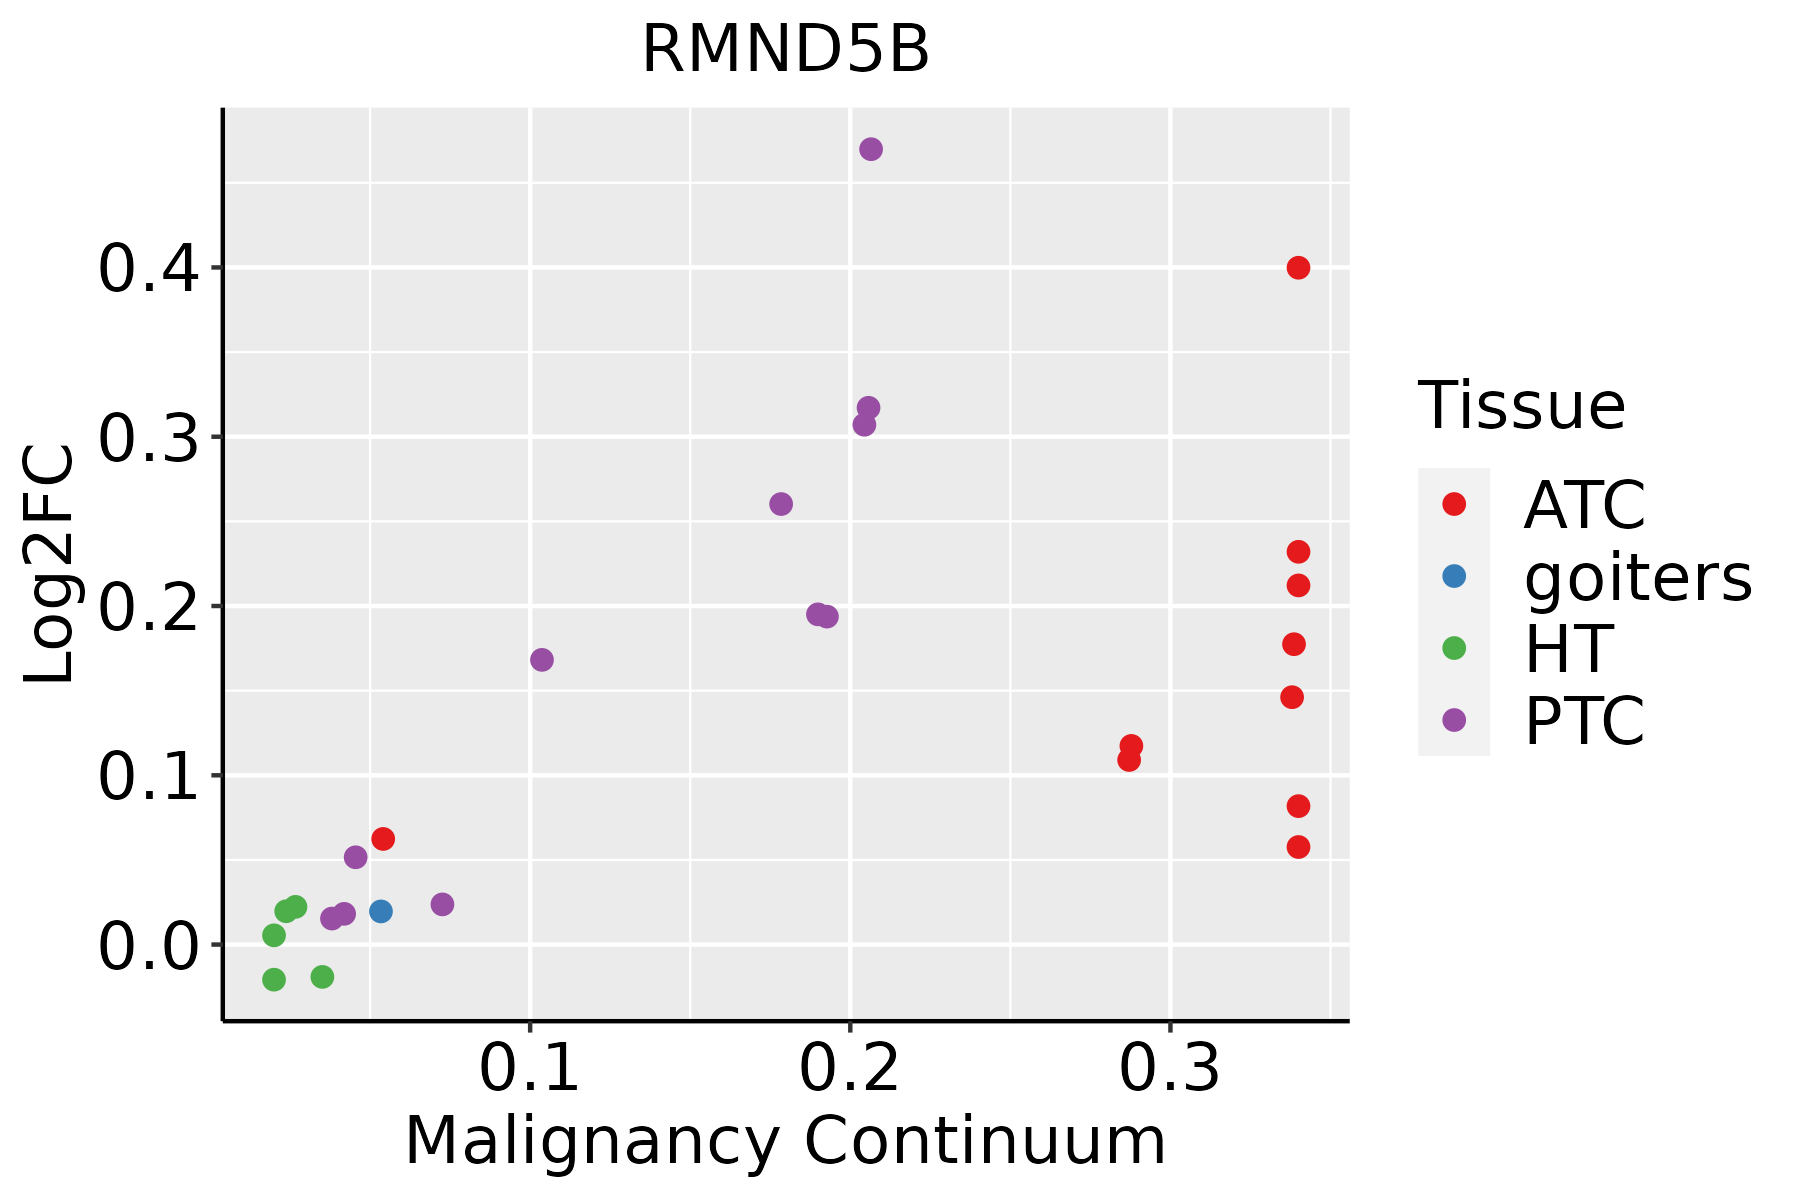 | ATC: Anaplastic thyroid cancer |
| HT: Hashimoto's thyroiditis | ||
| PTC: Papillary thyroid cancer |
| ∗log2FC in expression of this searched gene in stem-like cells from each diseased tissue sample relative to stem-like cells in normal samples in each tissue plotted against the malignancy continuum. Samples are colored based on if they are from different disease stage. |
Top |
Malignant transformation related pathway analysis |
| Find out the enriched GO biological processes and KEGG pathways involved in transition from healthy to precancer to cancer |
| Tissue | Disease Stage | Enriched GO biological Processes |
| Colorectum | AD |  |
| Colorectum | SER |  |
| Colorectum | MSS |  |
| Colorectum | MSI-H |  |
| Colorectum | FAP |  |
| ∗Top 15 enriched GO BP terms are showed in the bar plot of each disease state in each tissue. Each row represents a significant GO biological process which is colored according to the -log10(p.adjust). |
| Page: 1 2 3 4 5 6 7 8 9 |
| GO ID | Tissue | Disease Stage | Description | Gene Ratio | Bg Ratio | pvalue | p.adjust | Count |
| GO:0010498111 | Esophagus | ESCC | proteasomal protein catabolic process | 369/8552 | 490/18723 | 1.13e-41 | 1.80e-38 | 369 |
| GO:0043161111 | Esophagus | ESCC | proteasome-mediated ubiquitin-dependent protein catabolic process | 312/8552 | 412/18723 | 3.53e-36 | 4.48e-33 | 312 |
| GO:001049820 | Oral cavity | OSCC | proteasomal protein catabolic process | 336/7305 | 490/18723 | 5.45e-41 | 8.63e-38 | 336 |
| GO:004316120 | Oral cavity | OSCC | proteasome-mediated ubiquitin-dependent protein catabolic process | 285/7305 | 412/18723 | 5.68e-36 | 5.99e-33 | 285 |
| GO:0010498110 | Oral cavity | LP | proteasomal protein catabolic process | 224/4623 | 490/18723 | 9.57e-25 | 4.00e-22 | 224 |
| GO:0043161110 | Oral cavity | LP | proteasome-mediated ubiquitin-dependent protein catabolic process | 190/4623 | 412/18723 | 1.08e-21 | 2.93e-19 | 190 |
| GO:0010498113 | Thyroid | PTC | proteasomal protein catabolic process | 297/5968 | 490/18723 | 4.58e-40 | 9.63e-37 | 297 |
| GO:0043161113 | Thyroid | PTC | proteasome-mediated ubiquitin-dependent protein catabolic process | 254/5968 | 412/18723 | 3.91e-36 | 4.54e-33 | 254 |
| GO:001049832 | Thyroid | ATC | proteasomal protein catabolic process | 309/6293 | 490/18723 | 1.78e-41 | 1.13e-37 | 309 |
| GO:0043161210 | Thyroid | ATC | proteasome-mediated ubiquitin-dependent protein catabolic process | 265/6293 | 412/18723 | 7.09e-38 | 1.49e-34 | 265 |
| Page: 1 |
| Pathway ID | Tissue | Disease Stage | Description | Gene Ratio | Bg Ratio | pvalue | p.adjust | qvalue | Count |
| Page: 1 |
Top |
Cell-cell communication analysis |
| Identification of potential cell-cell interactions between two cell types and their ligand-receptor pairs for different disease states |
| Ligand | Receptor | LRpair | Pathway | Tissue | Disease Stage |
| Page: 1 |
Top |
Single-cell gene regulatory network inference analysis |
| Find out the significant the regulons (TFs) and the target genes of each regulon across cell types for different disease states |
| TF | Cell Type | Tissue | Disease Stage | Target Gene | RSS | Regulon Activity |
| ∗The dot plots of a searched regulon are shown for all cell subpopulations in each disease state of each tissue based on the regulon specific score inferred using pySCENIC and by calculating the average expression. |
| Page: 1 |
Top |
Somatic mutation of malignant transformation related genes |
| Annotation of somatic variants for genes involved in malignant transformation |
| Hugo Symbol | Variant Class | Variant Classification | dbSNP RS | HGVSc | HGVSp | HGVSp Short | SWISSPROT | BIOTYPE | SIFT | PolyPhen | Tumor Sample Barcode | Tissue | Histology | Sex | Age | Stage | Therapy Types | Drugs | Outcome |
| RMND5B | SNV | Missense_Mutation | c.841N>A | p.Glu281Lys | p.E281K | Q96G75 | protein_coding | deleterious(0.04) | possibly_damaging(0.824) | TCGA-A8-A09M-01 | Breast | breast invasive carcinoma | Female | >=65 | III/IV | Chemotherapy | paclitaxel | CR | |
| RMND5B | SNV | Missense_Mutation | c.994T>C | p.Tyr332His | p.Y332H | Q96G75 | protein_coding | deleterious(0) | probably_damaging(0.996) | TCGA-D8-A1XK-01 | Breast | breast invasive carcinoma | Female | <65 | I/II | Chemotherapy | doxorubicine+cyclophosphamide | SD | |
| RMND5B | deletion | Frame_Shift_Del | novel | c.735delN | p.Gly246AlafsTer53 | p.G246Afs*53 | Q96G75 | protein_coding | TCGA-EW-A2FV-01 | Breast | breast invasive carcinoma | Female | <65 | III/IV | Chemotherapy | docetaxel | SD | ||
| RMND5B | SNV | Missense_Mutation | rs763429428 | c.88G>C | p.Glu30Gln | p.E30Q | Q96G75 | protein_coding | tolerated(0.41) | benign(0.02) | TCGA-C5-A8XK-01 | Cervix | cervical & endocervical cancer | Female | <65 | I/II | Chemotherapy | cisplatin | SD |
| RMND5B | SNV | Missense_Mutation | c.658C>T | p.Arg220Trp | p.R220W | Q96G75 | protein_coding | deleterious(0) | probably_damaging(0.999) | TCGA-EK-A2R8-01 | Cervix | cervical & endocervical cancer | Female | <65 | I/II | Unknown | Unknown | SD | |
| RMND5B | SNV | Missense_Mutation | c.472N>C | p.Glu158Gln | p.E158Q | Q96G75 | protein_coding | deleterious(0.01) | probably_damaging(0.979) | TCGA-IR-A3LK-01 | Cervix | cervical & endocervical cancer | Female | >=65 | I/II | Chemotherapy | cisplatin | PD | |
| RMND5B | SNV | Missense_Mutation | rs200559247 | c.1169N>A | p.Arg390His | p.R390H | Q96G75 | protein_coding | tolerated(0.35) | benign(0.023) | TCGA-AA-3672-01 | Colorectum | colon adenocarcinoma | Female | >=65 | III/IV | Unknown | Unknown | SD |
| RMND5B | insertion | Frame_Shift_Ins | novel | c.385dupT | p.Tyr129LeufsTer138 | p.Y129Lfs*138 | Q96G75 | protein_coding | TCGA-AA-3837-01 | Colorectum | colon adenocarcinoma | Male | >=65 | I/II | Unknown | Unknown | SD | ||
| RMND5B | deletion | Frame_Shift_Del | rs776244882 | c.283_284delNN | p.Arg95GlufsTer5 | p.R95Efs*5 | Q96G75 | protein_coding | TCGA-AA-3949-01 | Colorectum | colon adenocarcinoma | Female | >=65 | III/IV | Unknown | Unknown | SD | ||
| RMND5B | SNV | Missense_Mutation | rs200559247 | c.1169N>A | p.Arg390His | p.R390H | Q96G75 | protein_coding | tolerated(0.35) | benign(0.023) | TCGA-AX-A0J1-01 | Endometrium | uterine corpus endometrioid carcinoma | Female | >=65 | I/II | Unknown | Unknown | SD |
| Page: 1 2 3 4 |
Top |
Related drugs of malignant transformation related genes |
| Identification of chemicals and drugs interact with genes involved in malignant transfromation |
| (DGIdb 4.0) |
| Entrez ID | Symbol | Category | Interaction Types | Drug Claim Name | Drug Name | PMIDs |
| Page: 1 |

Copyright 2023-Present -The University of Texas Health Science Center at Houston |