
|
|||||
|
 | |
| |
| |
| |
| |
| |
|
Gene: RMND5A |
Gene summary for RMND5A |
| Gene information | Species | Human | Gene symbol | RMND5A | Gene ID | 64795 |
| Gene name | required for meiotic nuclear division 5 homolog A | |
| Gene Alias | CTLH | |
| Cytomap | 2p11.2 | |
| Gene Type | protein-coding | GO ID | GO:0000209 | UniProtAcc | Q9H871 |
Top |
Malignant transformation analysis |
| Identification of the aberrant gene expression in precancerous and cancerous lesions by comparing the gene expression of stem-like cells in diseased tissues with normal stem cells |
| Entrez ID | Symbol | Replicates | Species | Organ | Tissue | Adj P-value | Log2FC | Malignancy |
| 64795 | RMND5A | LZE4T | Human | Esophagus | ESCC | 1.38e-02 | -2.94e-02 | 0.0811 |
| 64795 | RMND5A | LZE22T | Human | Esophagus | ESCC | 2.09e-02 | 2.28e-01 | 0.068 |
| 64795 | RMND5A | LZE24T | Human | Esophagus | ESCC | 5.06e-07 | 1.88e-01 | 0.0596 |
| 64795 | RMND5A | P1T-E | Human | Esophagus | ESCC | 8.08e-04 | 2.71e-01 | 0.0875 |
| 64795 | RMND5A | P2T-E | Human | Esophagus | ESCC | 4.10e-36 | 7.35e-01 | 0.1177 |
| 64795 | RMND5A | P4T-E | Human | Esophagus | ESCC | 1.31e-28 | 6.81e-01 | 0.1323 |
| 64795 | RMND5A | P5T-E | Human | Esophagus | ESCC | 7.71e-18 | 3.29e-01 | 0.1327 |
| 64795 | RMND5A | P8T-E | Human | Esophagus | ESCC | 1.98e-14 | 9.22e-02 | 0.0889 |
| 64795 | RMND5A | P9T-E | Human | Esophagus | ESCC | 9.25e-07 | 1.05e-01 | 0.1131 |
| 64795 | RMND5A | P10T-E | Human | Esophagus | ESCC | 2.12e-26 | 5.98e-01 | 0.116 |
| 64795 | RMND5A | P11T-E | Human | Esophagus | ESCC | 6.29e-04 | 3.20e-02 | 0.1426 |
| 64795 | RMND5A | P12T-E | Human | Esophagus | ESCC | 1.82e-11 | 2.66e-01 | 0.1122 |
| 64795 | RMND5A | P15T-E | Human | Esophagus | ESCC | 1.67e-15 | 3.56e-01 | 0.1149 |
| 64795 | RMND5A | P16T-E | Human | Esophagus | ESCC | 1.10e-14 | 2.16e-01 | 0.1153 |
| 64795 | RMND5A | P20T-E | Human | Esophagus | ESCC | 4.24e-10 | 2.08e-01 | 0.1124 |
| 64795 | RMND5A | P21T-E | Human | Esophagus | ESCC | 1.21e-08 | 3.44e-02 | 0.1617 |
| 64795 | RMND5A | P22T-E | Human | Esophagus | ESCC | 6.95e-19 | 1.49e-01 | 0.1236 |
| 64795 | RMND5A | P23T-E | Human | Esophagus | ESCC | 8.31e-13 | 4.11e-01 | 0.108 |
| 64795 | RMND5A | P24T-E | Human | Esophagus | ESCC | 1.38e-10 | 1.82e-02 | 0.1287 |
| 64795 | RMND5A | P26T-E | Human | Esophagus | ESCC | 2.72e-22 | 4.33e-01 | 0.1276 |
| Page: 1 2 3 4 |
| Tissue | Expression Dynamics | Abbreviation |
| Esophagus | 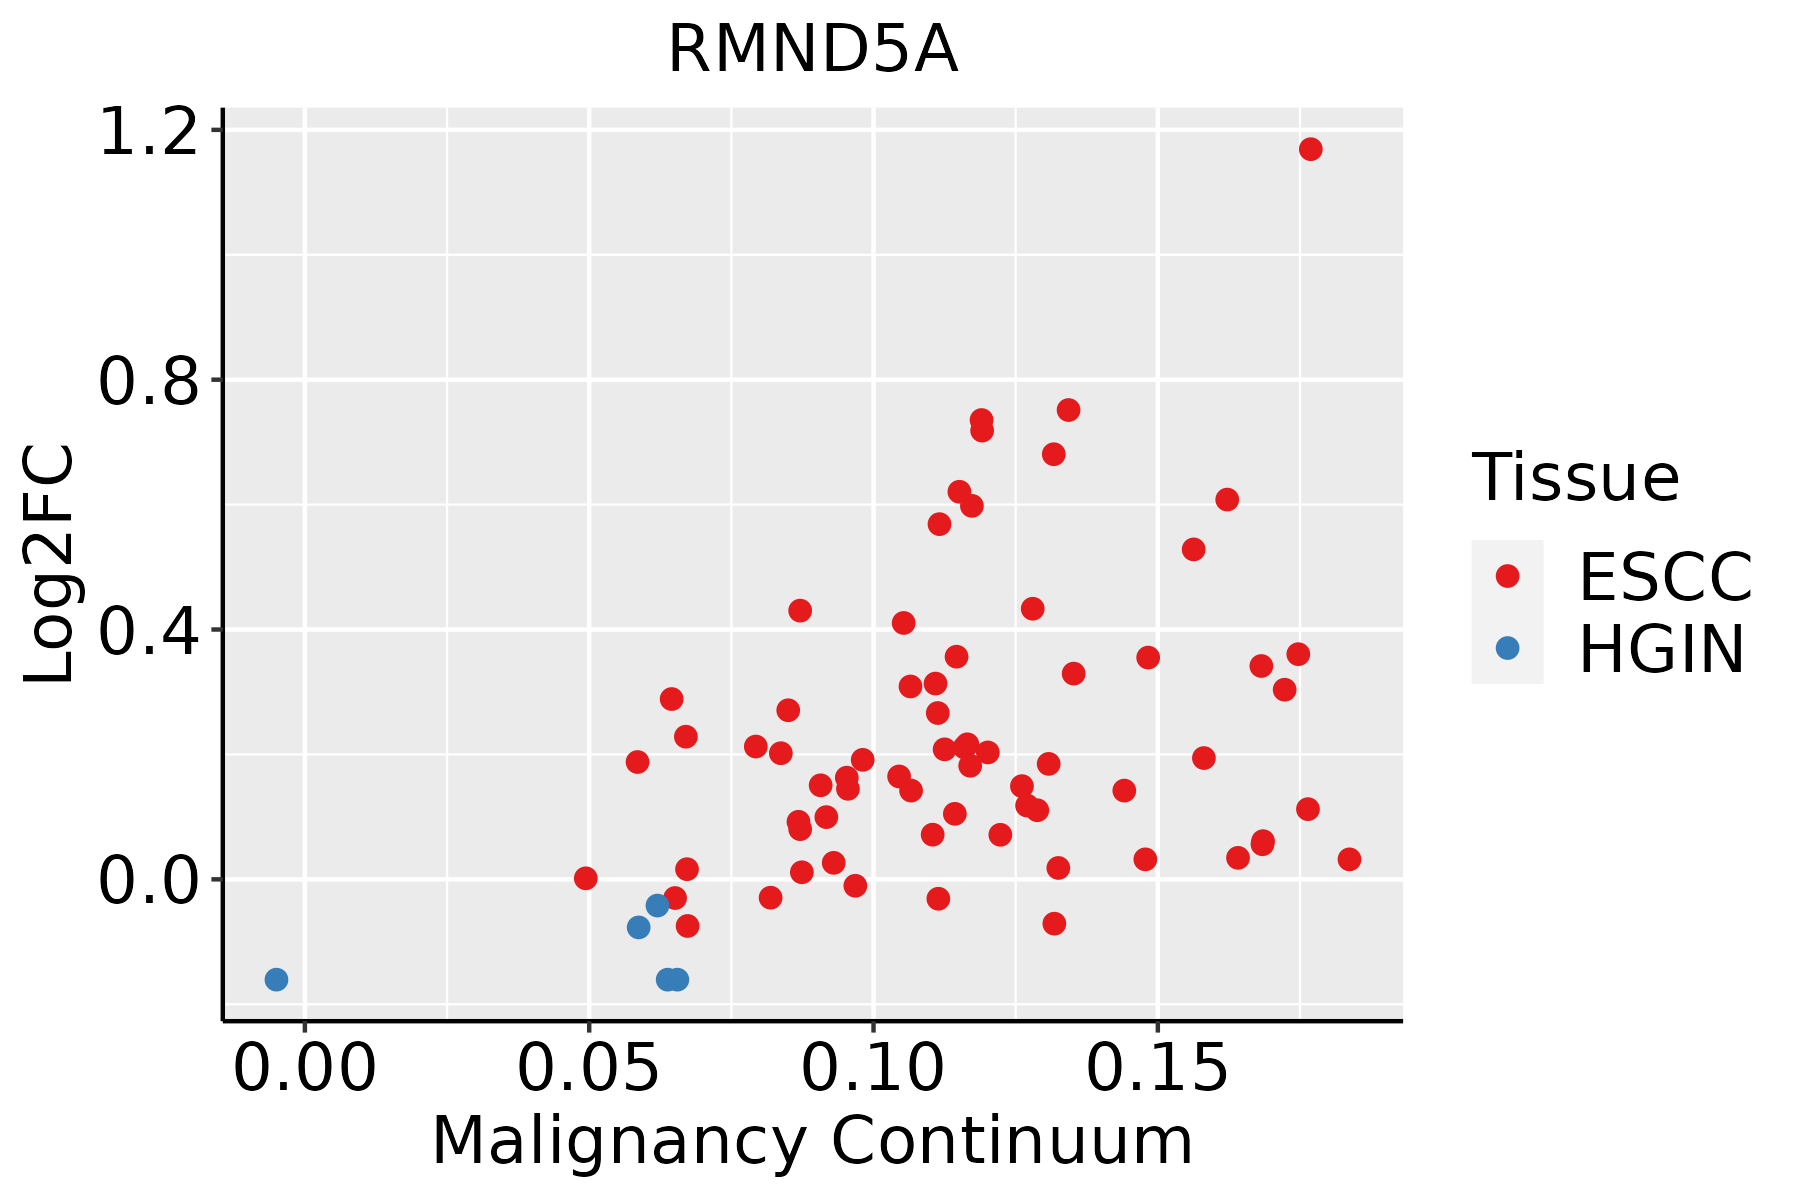 | ESCC: Esophageal squamous cell carcinoma |
| HGIN: High-grade intraepithelial neoplasias | ||
| LGIN: Low-grade intraepithelial neoplasias | ||
| Liver | 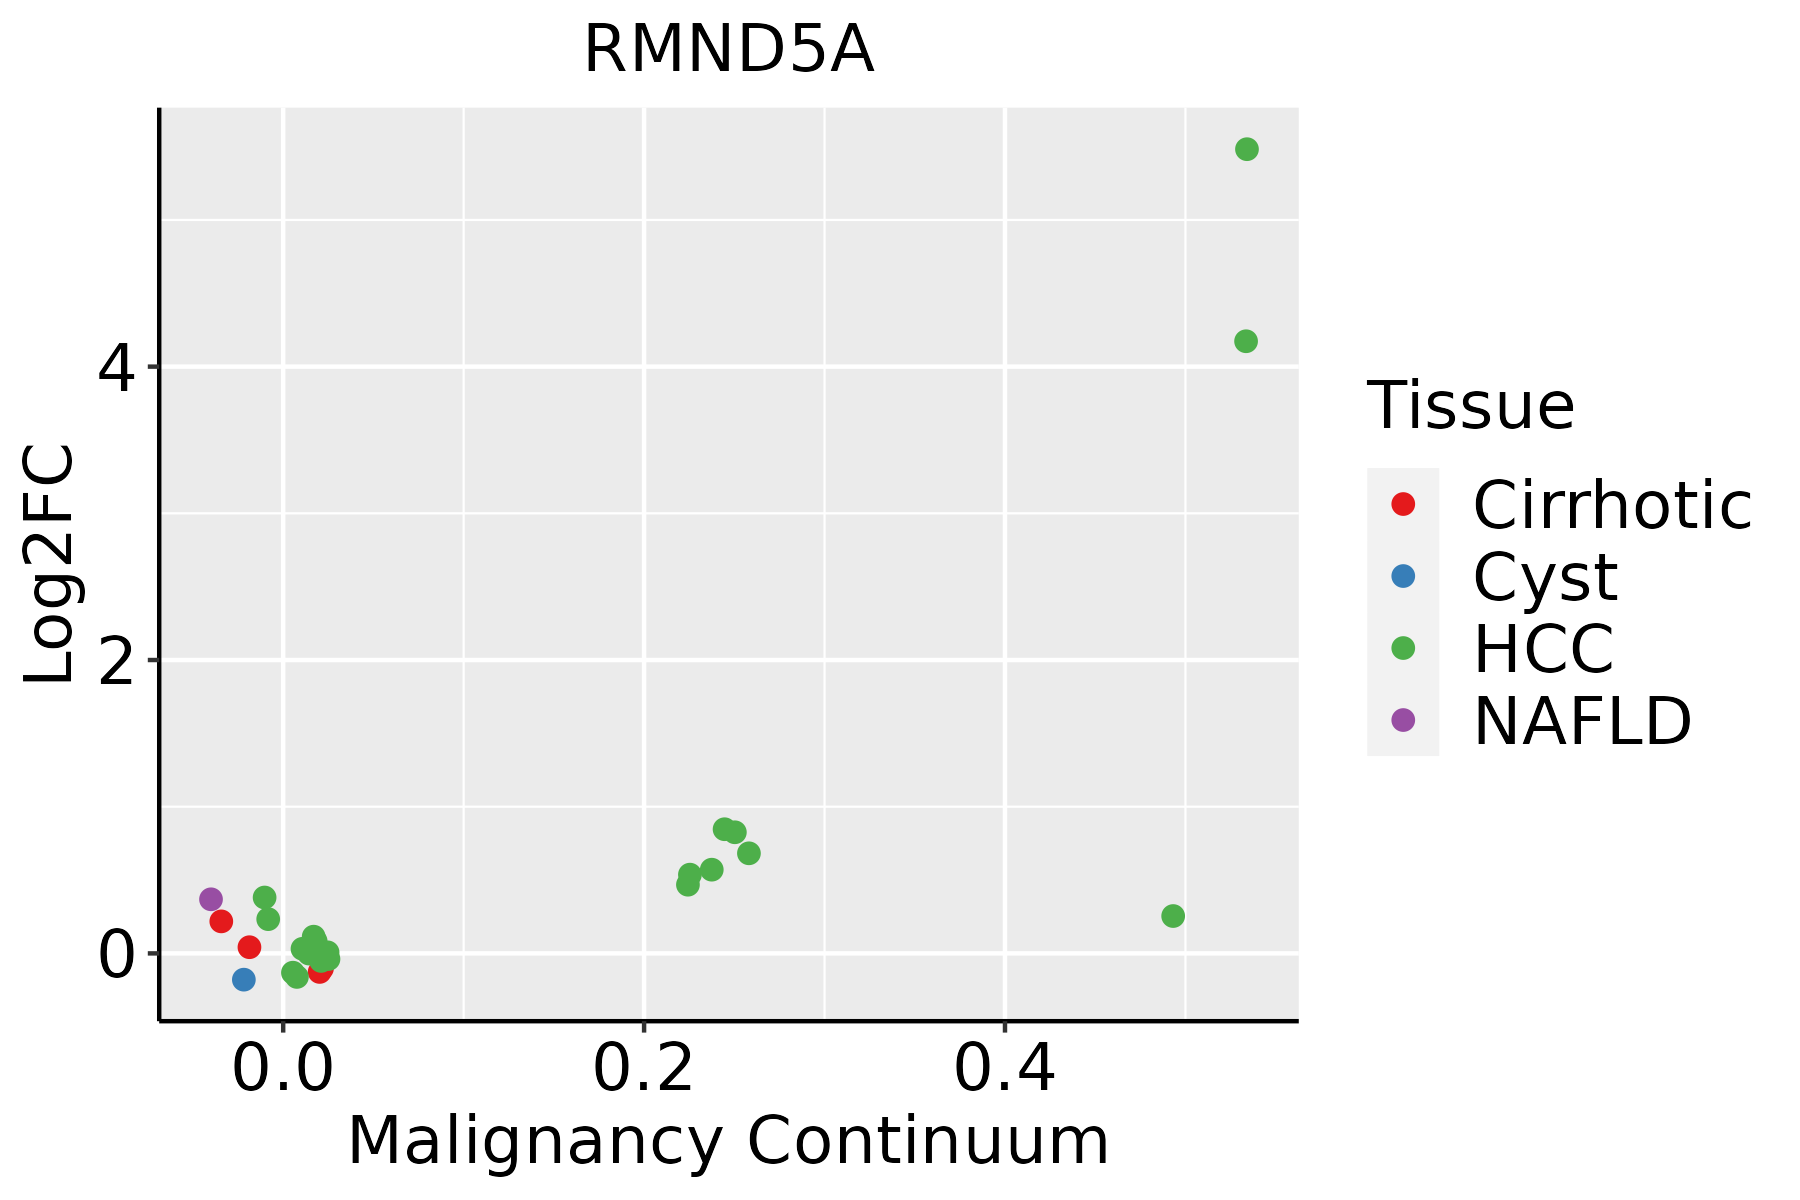 | HCC: Hepatocellular carcinoma |
| NAFLD: Non-alcoholic fatty liver disease | ||
| Oral Cavity | 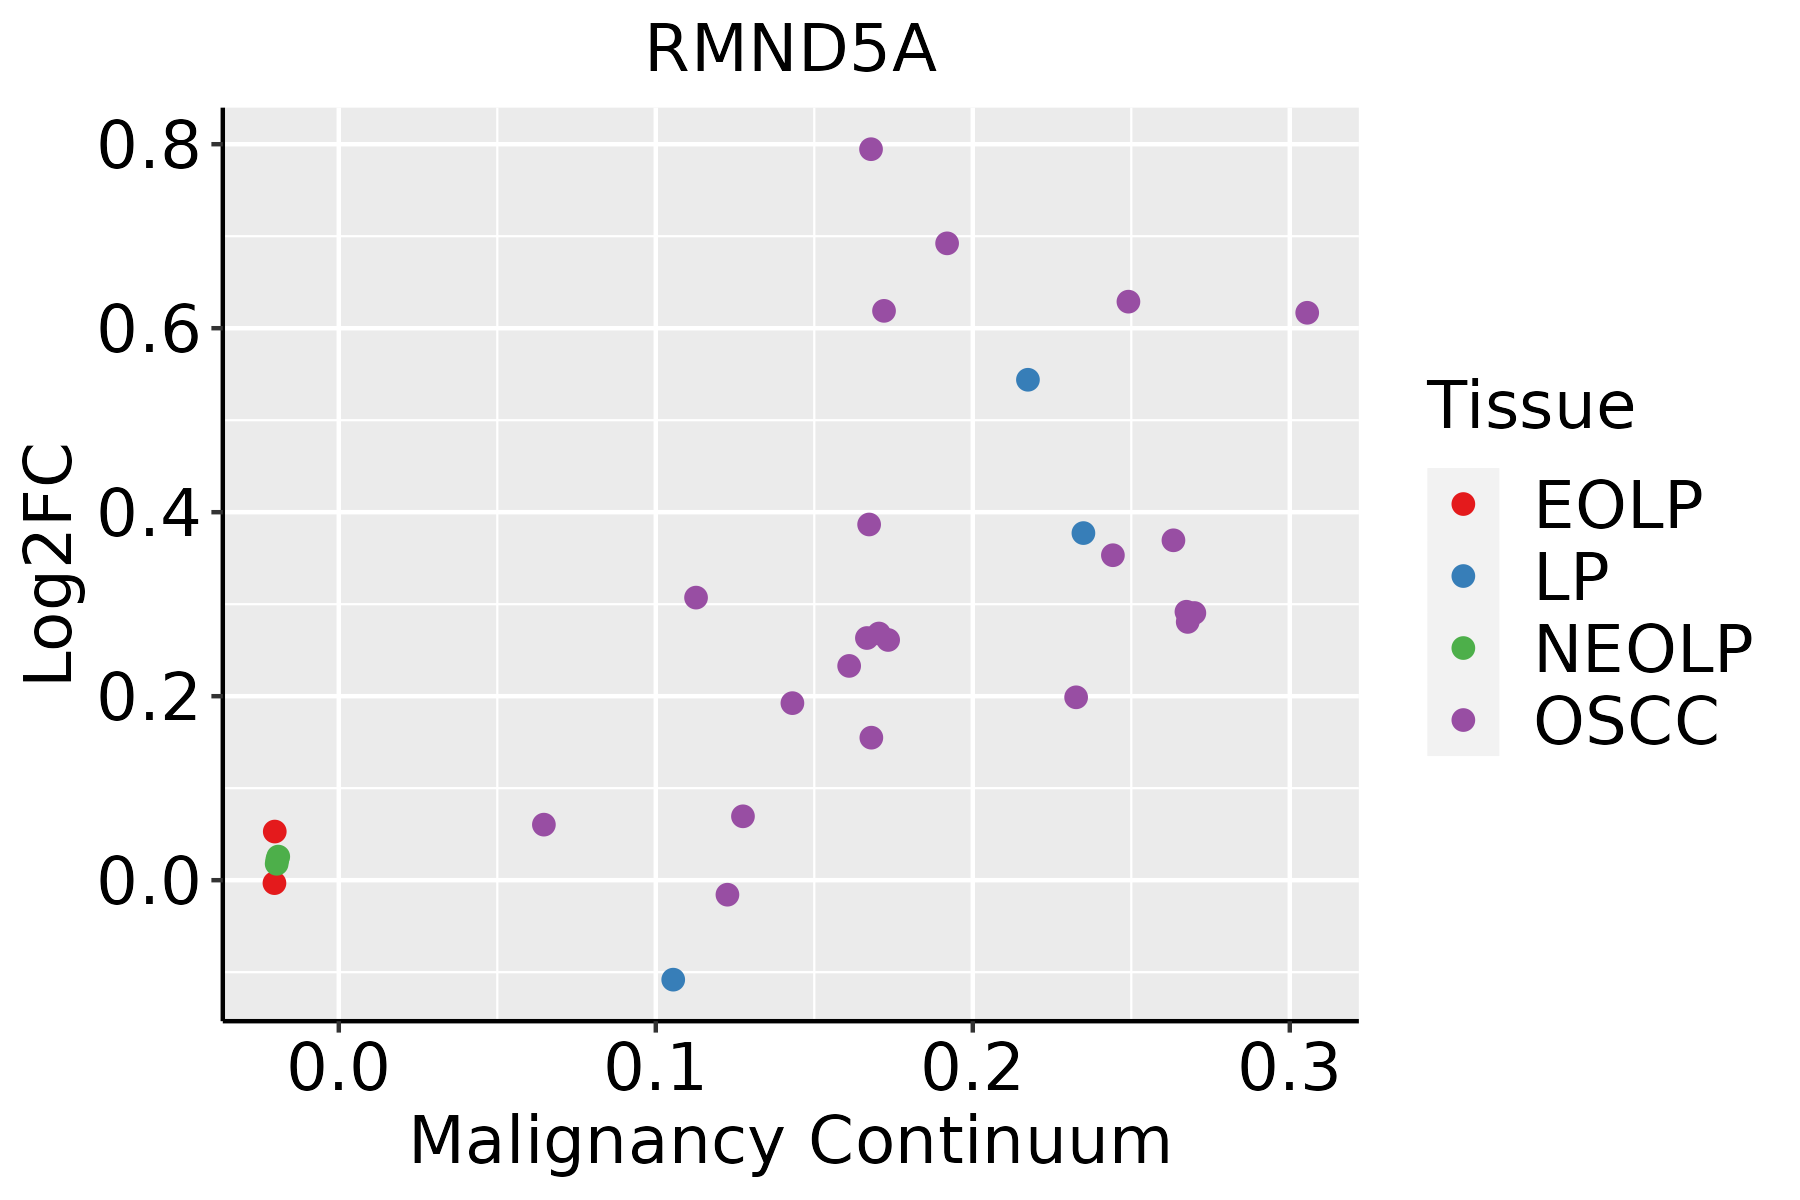 | EOLP: Erosive Oral lichen planus |
| LP: leukoplakia | ||
| NEOLP: Non-erosive oral lichen planus | ||
| OSCC: Oral squamous cell carcinoma |
| ∗log2FC in expression of this searched gene in stem-like cells from each diseased tissue sample relative to stem-like cells in normal samples in each tissue plotted against the malignancy continuum. Samples are colored based on if they are from different disease stage. |
Top |
Malignant transformation related pathway analysis |
| Find out the enriched GO biological processes and KEGG pathways involved in transition from healthy to precancer to cancer |
| Tissue | Disease Stage | Enriched GO biological Processes |
| Colorectum | AD |  |
| Colorectum | SER |  |
| Colorectum | MSS |  |
| Colorectum | MSI-H |  |
| Colorectum | FAP |  |
| ∗Top 15 enriched GO BP terms are showed in the bar plot of each disease state in each tissue. Each row represents a significant GO biological process which is colored according to the -log10(p.adjust). |
| Page: 1 2 3 4 5 6 7 8 9 |
| GO ID | Tissue | Disease Stage | Description | Gene Ratio | Bg Ratio | pvalue | p.adjust | Count |
| GO:0010498111 | Esophagus | ESCC | proteasomal protein catabolic process | 369/8552 | 490/18723 | 1.13e-41 | 1.80e-38 | 369 |
| GO:0043161111 | Esophagus | ESCC | proteasome-mediated ubiquitin-dependent protein catabolic process | 312/8552 | 412/18723 | 3.53e-36 | 4.48e-33 | 312 |
| GO:000020917 | Esophagus | ESCC | protein polyubiquitination | 170/8552 | 236/18723 | 1.40e-16 | 1.09e-14 | 170 |
| GO:001049812 | Liver | Cirrhotic | proteasomal protein catabolic process | 216/4634 | 490/18723 | 2.52e-21 | 9.29e-19 | 216 |
| GO:004316112 | Liver | Cirrhotic | proteasome-mediated ubiquitin-dependent protein catabolic process | 184/4634 | 412/18723 | 4.52e-19 | 8.85e-17 | 184 |
| GO:000020911 | Liver | Cirrhotic | protein polyubiquitination | 89/4634 | 236/18723 | 6.09e-06 | 9.80e-05 | 89 |
| GO:001049822 | Liver | HCC | proteasomal protein catabolic process | 351/7958 | 490/18723 | 6.92e-40 | 1.46e-36 | 351 |
| GO:004316122 | Liver | HCC | proteasome-mediated ubiquitin-dependent protein catabolic process | 299/7958 | 412/18723 | 7.82e-36 | 8.27e-33 | 299 |
| GO:000020921 | Liver | HCC | protein polyubiquitination | 151/7958 | 236/18723 | 1.90e-11 | 7.59e-10 | 151 |
| GO:001049820 | Oral cavity | OSCC | proteasomal protein catabolic process | 336/7305 | 490/18723 | 5.45e-41 | 8.63e-38 | 336 |
| GO:004316120 | Oral cavity | OSCC | proteasome-mediated ubiquitin-dependent protein catabolic process | 285/7305 | 412/18723 | 5.68e-36 | 5.99e-33 | 285 |
| GO:000020910 | Oral cavity | OSCC | protein polyubiquitination | 150/7305 | 236/18723 | 1.59e-14 | 9.27e-13 | 150 |
| GO:0010498110 | Oral cavity | LP | proteasomal protein catabolic process | 224/4623 | 490/18723 | 9.57e-25 | 4.00e-22 | 224 |
| GO:0043161110 | Oral cavity | LP | proteasome-mediated ubiquitin-dependent protein catabolic process | 190/4623 | 412/18723 | 1.08e-21 | 2.93e-19 | 190 |
| GO:000020915 | Oral cavity | LP | protein polyubiquitination | 82/4623 | 236/18723 | 3.23e-04 | 3.26e-03 | 82 |
| Page: 1 |
| Pathway ID | Tissue | Disease Stage | Description | Gene Ratio | Bg Ratio | pvalue | p.adjust | qvalue | Count |
| Page: 1 |
Top |
Cell-cell communication analysis |
| Identification of potential cell-cell interactions between two cell types and their ligand-receptor pairs for different disease states |
| Ligand | Receptor | LRpair | Pathway | Tissue | Disease Stage |
| Page: 1 |
Top |
Single-cell gene regulatory network inference analysis |
| Find out the significant the regulons (TFs) and the target genes of each regulon across cell types for different disease states |
| TF | Cell Type | Tissue | Disease Stage | Target Gene | RSS | Regulon Activity |
| ∗The dot plots of a searched regulon are shown for all cell subpopulations in each disease state of each tissue based on the regulon specific score inferred using pySCENIC and by calculating the average expression. |
| Page: 1 |
Top |
Somatic mutation of malignant transformation related genes |
| Annotation of somatic variants for genes involved in malignant transformation |
| Hugo Symbol | Variant Class | Variant Classification | dbSNP RS | HGVSc | HGVSp | HGVSp Short | SWISSPROT | BIOTYPE | SIFT | PolyPhen | Tumor Sample Barcode | Tissue | Histology | Sex | Age | Stage | Therapy Types | Drugs | Outcome |
| RMND5A | SNV | Missense_Mutation | novel | c.826N>G | p.Leu276Val | p.L276V | Q9H871 | protein_coding | tolerated(0.2) | benign(0.21) | TCGA-A2-A0EY-01 | Breast | breast invasive carcinoma | Female | <65 | I/II | Chemotherapy | adriamycin | SD |
| RMND5A | SNV | Missense_Mutation | novel | c.743N>T | p.Ser248Leu | p.S248L | Q9H871 | protein_coding | deleterious(0.03) | probably_damaging(0.977) | TCGA-BH-A0B6-01 | Breast | breast invasive carcinoma | Female | <65 | I/II | Unknown | Unknown | SD |
| RMND5A | SNV | Missense_Mutation | c.756N>A | p.His252Gln | p.H252Q | Q9H871 | protein_coding | tolerated(0.05) | benign(0.309) | TCGA-D8-A1JC-01 | Breast | breast invasive carcinoma | Female | <65 | III/IV | Chemotherapy | adriamycin | SD | |
| RMND5A | insertion | Nonsense_Mutation | novel | c.824_825insCAAGTGTAGTTATTGGTGGTTACTTTCCTGACAAA | p.Leu276LysfsTer10 | p.L276Kfs*10 | Q9H871 | protein_coding | TCGA-A2-A0EY-01 | Breast | breast invasive carcinoma | Female | <65 | I/II | Chemotherapy | adriamycin | SD | ||
| RMND5A | insertion | Nonsense_Mutation | novel | c.654_655insTATGATTGAAGGGGTGTATAAACTTTTGAAAGTGATCT | p.Asn219TyrfsTer3 | p.N219Yfs*3 | Q9H871 | protein_coding | TCGA-AN-A0FW-01 | Breast | breast invasive carcinoma | Female | >=65 | III/IV | Unknown | Unknown | SD | ||
| RMND5A | SNV | Missense_Mutation | novel | c.76N>C | p.Glu26Gln | p.E26Q | Q9H871 | protein_coding | tolerated(0.41) | benign(0.05) | TCGA-VS-A94X-01 | Cervix | cervical & endocervical cancer | Female | <65 | I/II | Chemotherapy | cisplatin | PD |
| RMND5A | SNV | Missense_Mutation | novel | c.248N>G | p.His83Arg | p.H83R | Q9H871 | protein_coding | deleterious(0) | probably_damaging(0.998) | TCGA-CA-6717-01 | Colorectum | colon adenocarcinoma | Male | <65 | I/II | Chemotherapy | oxaliplatin | CR |
| RMND5A | SNV | Missense_Mutation | novel | c.718N>C | p.Tyr240His | p.Y240H | Q9H871 | protein_coding | deleterious(0) | possibly_damaging(0.89) | TCGA-CA-6717-01 | Colorectum | colon adenocarcinoma | Male | <65 | I/II | Chemotherapy | oxaliplatin | CR |
| RMND5A | SNV | Missense_Mutation | c.148N>A | p.Asp50Asn | p.D50N | Q9H871 | protein_coding | tolerated(0.1) | benign(0.125) | TCGA-CA-6718-01 | Colorectum | colon adenocarcinoma | Male | <65 | I/II | Unknown | Unknown | PD | |
| RMND5A | SNV | Missense_Mutation | c.632N>A | p.Arg211Gln | p.R211Q | Q9H871 | protein_coding | tolerated(0.6) | benign(0.003) | TCGA-CA-6718-01 | Colorectum | colon adenocarcinoma | Male | <65 | I/II | Unknown | Unknown | PD |
| Page: 1 2 3 4 5 |
Top |
Related drugs of malignant transformation related genes |
| Identification of chemicals and drugs interact with genes involved in malignant transfromation |
| (DGIdb 4.0) |
| Entrez ID | Symbol | Category | Interaction Types | Drug Claim Name | Drug Name | PMIDs |
| Page: 1 |

Copyright 2023-Present -The University of Texas Health Science Center at Houston |