
|
|||||
|
 | |
| |
| |
| |
| |
| |
|
Gene: RMI2 |
Gene summary for RMI2 |
| Gene information | Species | Human | Gene symbol | RMI2 | Gene ID | 116028 |
| Gene name | RecQ mediated genome instability 2 | |
| Gene Alias | BLAP18 | |
| Cytomap | 16p13.13 | |
| Gene Type | protein-coding | GO ID | GO:0000018 | UniProtAcc | Q96E14 |
Top |
Malignant transformation analysis |
| Identification of the aberrant gene expression in precancerous and cancerous lesions by comparing the gene expression of stem-like cells in diseased tissues with normal stem cells |
| Entrez ID | Symbol | Replicates | Species | Organ | Tissue | Adj P-value | Log2FC | Malignancy |
| 116028 | RMI2 | LZE2T | Human | Esophagus | ESCC | 3.83e-02 | 3.60e-01 | 0.082 |
| 116028 | RMI2 | LZE24T | Human | Esophagus | ESCC | 6.11e-03 | 7.40e-02 | 0.0596 |
| 116028 | RMI2 | P1T-E | Human | Esophagus | ESCC | 1.32e-04 | 2.20e-01 | 0.0875 |
| 116028 | RMI2 | P2T-E | Human | Esophagus | ESCC | 2.07e-74 | 1.49e+00 | 0.1177 |
| 116028 | RMI2 | P4T-E | Human | Esophagus | ESCC | 5.53e-24 | 6.74e-01 | 0.1323 |
| 116028 | RMI2 | P5T-E | Human | Esophagus | ESCC | 1.75e-11 | 2.58e-01 | 0.1327 |
| 116028 | RMI2 | P8T-E | Human | Esophagus | ESCC | 1.47e-14 | 2.92e-01 | 0.0889 |
| 116028 | RMI2 | P9T-E | Human | Esophagus | ESCC | 4.32e-05 | 1.60e-01 | 0.1131 |
| 116028 | RMI2 | P10T-E | Human | Esophagus | ESCC | 1.66e-02 | 9.99e-02 | 0.116 |
| 116028 | RMI2 | P12T-E | Human | Esophagus | ESCC | 3.19e-23 | 4.17e-01 | 0.1122 |
| 116028 | RMI2 | P15T-E | Human | Esophagus | ESCC | 4.23e-13 | 1.43e-01 | 0.1149 |
| 116028 | RMI2 | P16T-E | Human | Esophagus | ESCC | 7.52e-23 | 4.24e-01 | 0.1153 |
| 116028 | RMI2 | P20T-E | Human | Esophagus | ESCC | 4.42e-07 | 2.36e-01 | 0.1124 |
| 116028 | RMI2 | P21T-E | Human | Esophagus | ESCC | 3.75e-03 | 9.54e-02 | 0.1617 |
| 116028 | RMI2 | P22T-E | Human | Esophagus | ESCC | 9.02e-11 | 2.35e-01 | 0.1236 |
| 116028 | RMI2 | P23T-E | Human | Esophagus | ESCC | 1.77e-07 | 1.97e-01 | 0.108 |
| 116028 | RMI2 | P24T-E | Human | Esophagus | ESCC | 1.88e-04 | 1.63e-01 | 0.1287 |
| 116028 | RMI2 | P26T-E | Human | Esophagus | ESCC | 9.53e-09 | 2.22e-01 | 0.1276 |
| 116028 | RMI2 | P27T-E | Human | Esophagus | ESCC | 9.35e-10 | 2.21e-01 | 0.1055 |
| 116028 | RMI2 | P28T-E | Human | Esophagus | ESCC | 9.74e-22 | 3.75e-01 | 0.1149 |
| Page: 1 2 3 |
| Tissue | Expression Dynamics | Abbreviation |
| Esophagus | 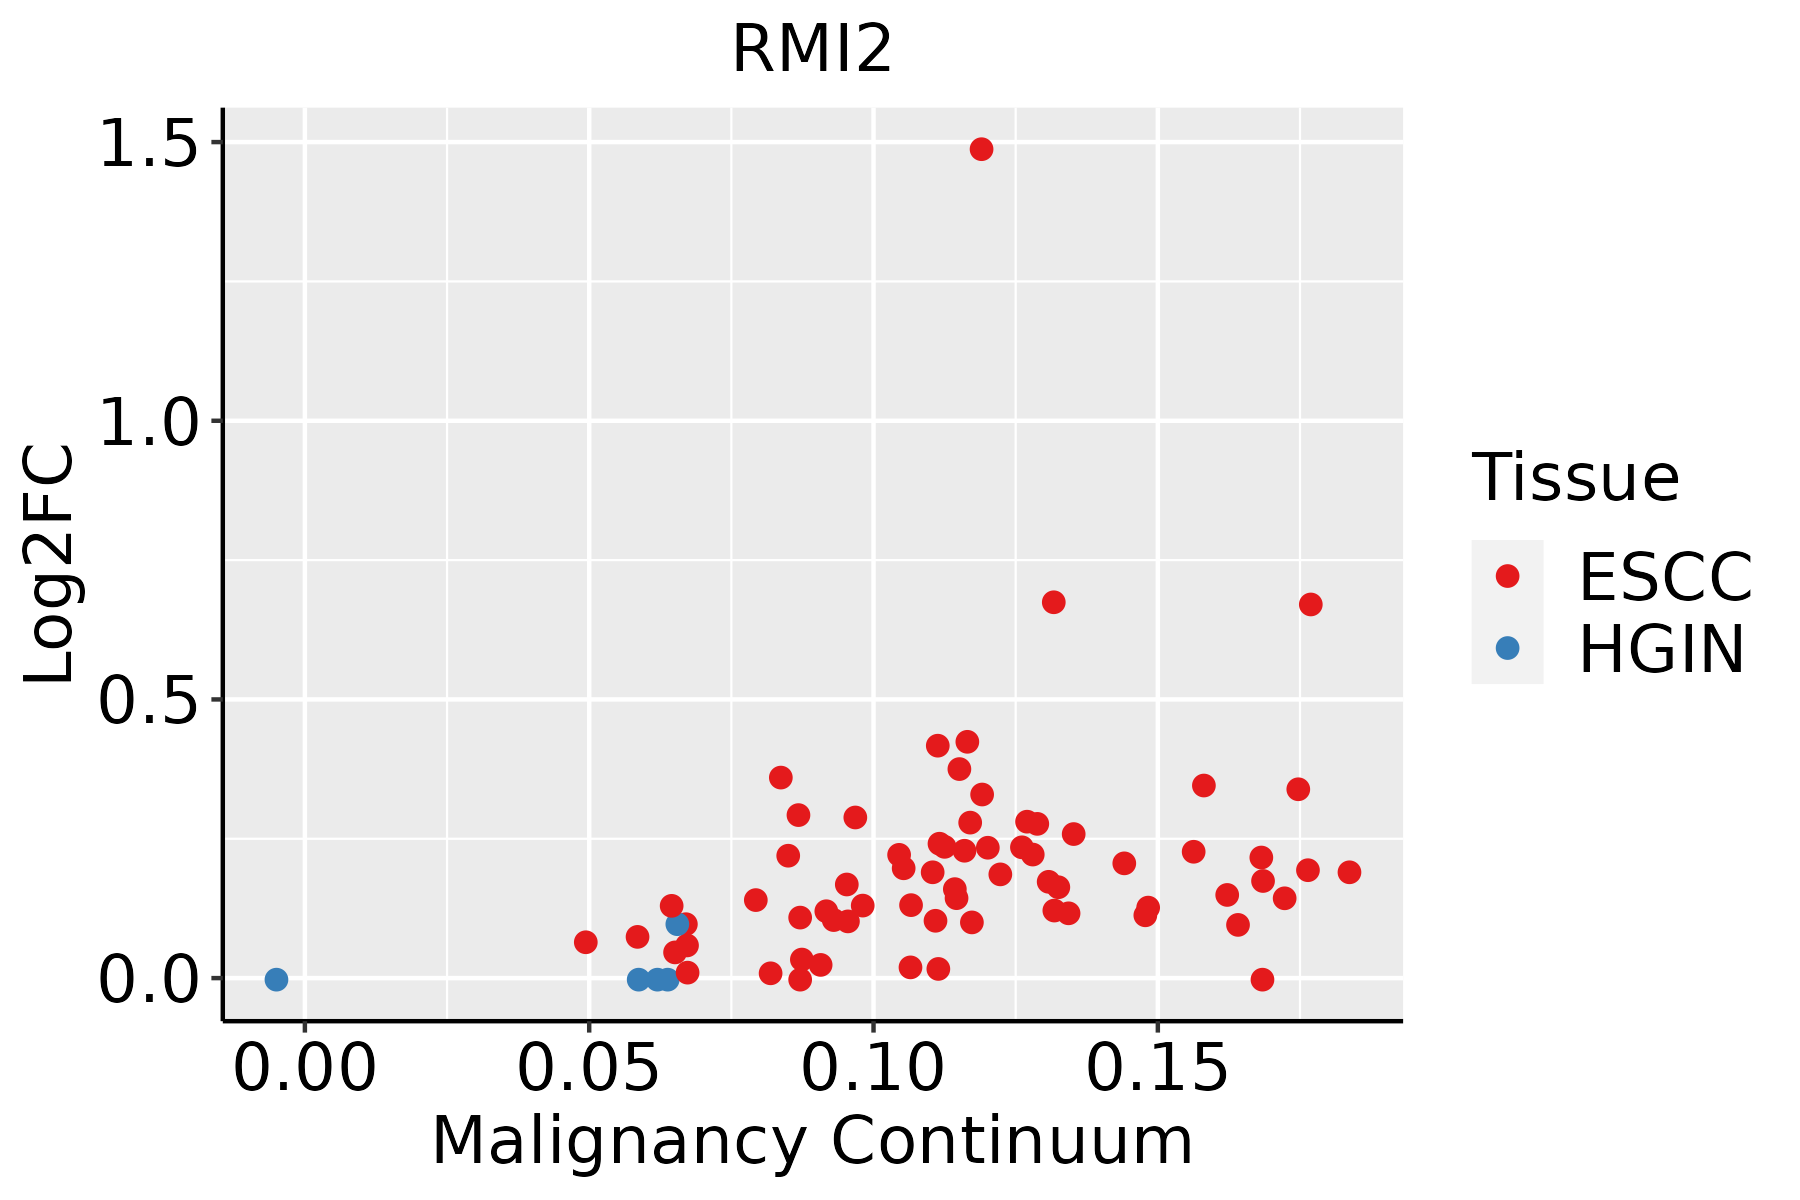 | ESCC: Esophageal squamous cell carcinoma |
| HGIN: High-grade intraepithelial neoplasias | ||
| LGIN: Low-grade intraepithelial neoplasias | ||
| Oral Cavity | 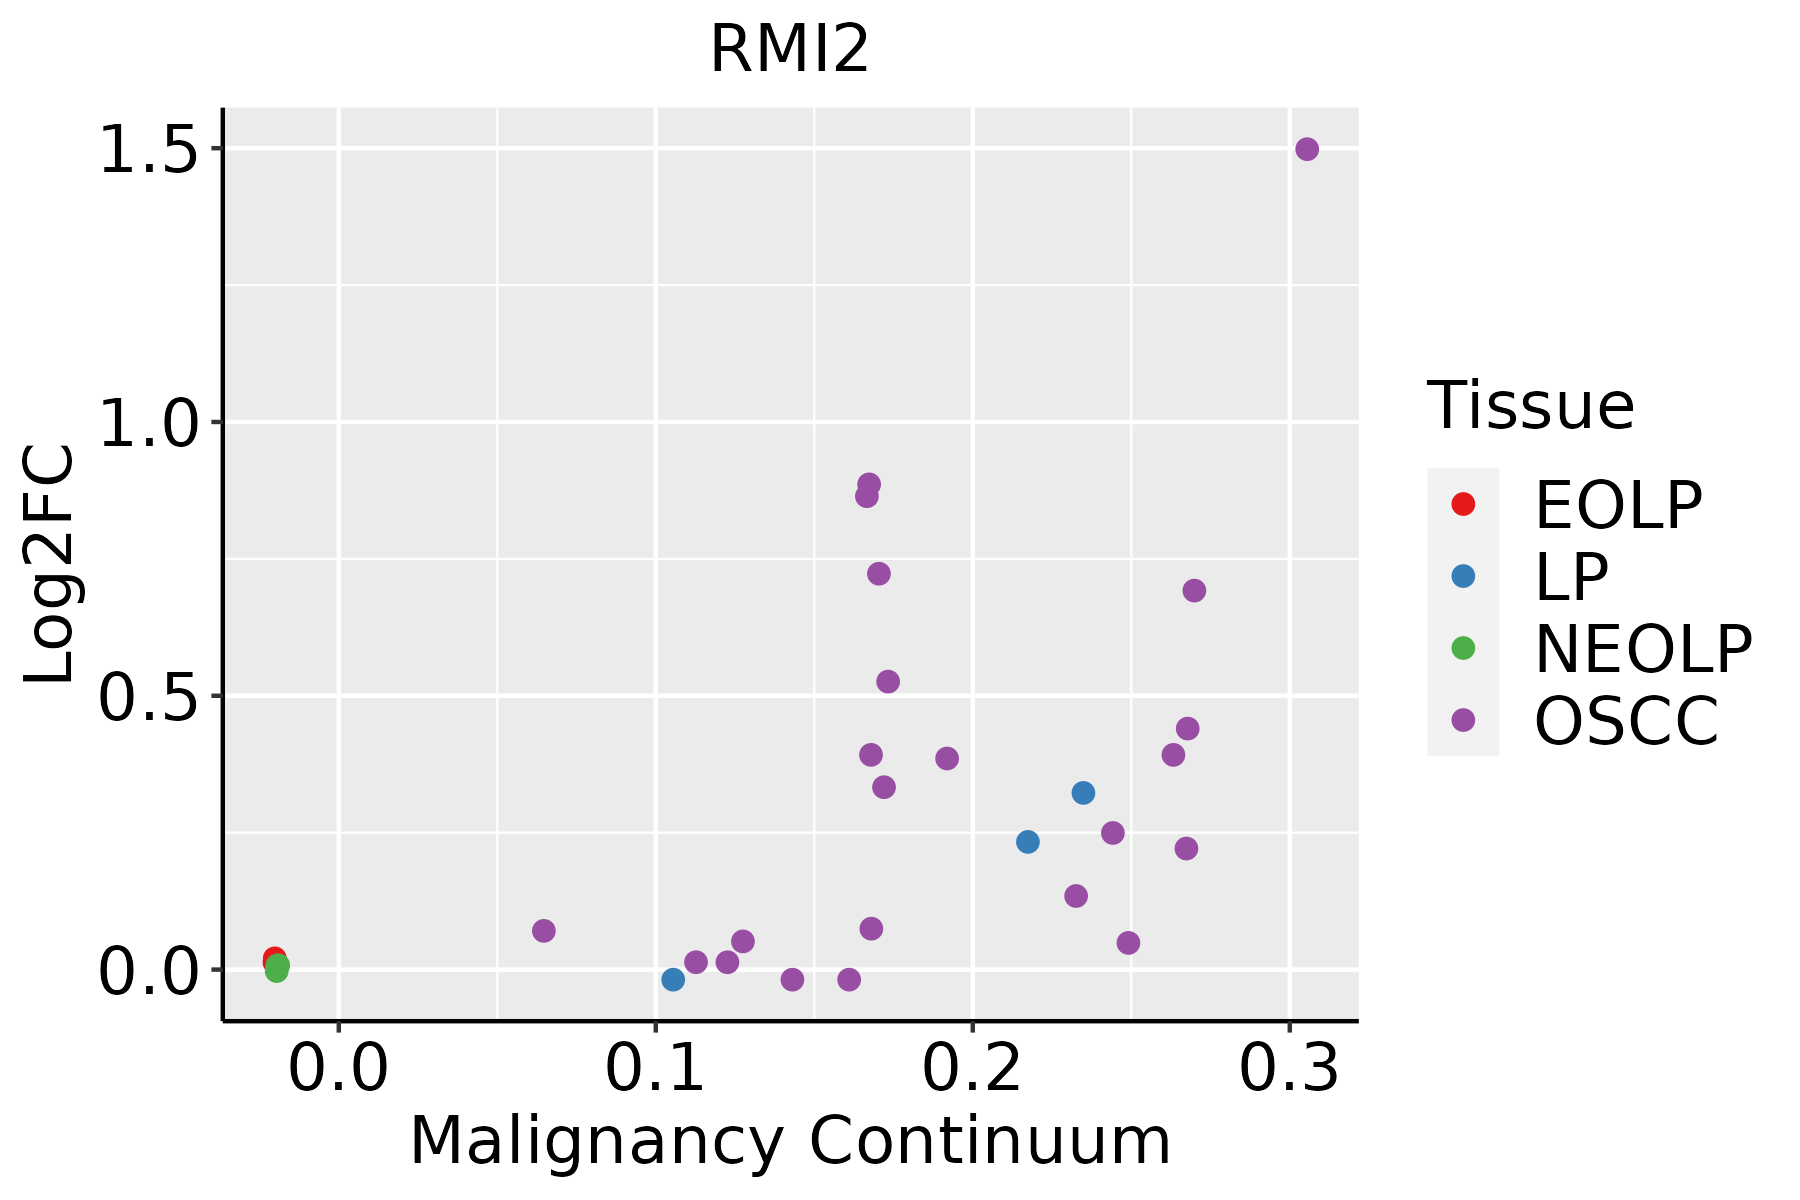 | EOLP: Erosive Oral lichen planus |
| LP: leukoplakia | ||
| NEOLP: Non-erosive oral lichen planus | ||
| OSCC: Oral squamous cell carcinoma |
| ∗log2FC in expression of this searched gene in stem-like cells from each diseased tissue sample relative to stem-like cells in normal samples in each tissue plotted against the malignancy continuum. Samples are colored based on if they are from different disease stage. |
Top |
Malignant transformation related pathway analysis |
| Find out the enriched GO biological processes and KEGG pathways involved in transition from healthy to precancer to cancer |
| Tissue | Disease Stage | Enriched GO biological Processes |
| Colorectum | AD |  |
| Colorectum | SER |  |
| Colorectum | MSS |  |
| Colorectum | MSI-H |  |
| Colorectum | FAP |  |
| ∗Top 15 enriched GO BP terms are showed in the bar plot of each disease state in each tissue. Each row represents a significant GO biological process which is colored according to the -log10(p.adjust). |
| Page: 1 2 3 4 5 6 7 8 9 |
| GO ID | Tissue | Disease Stage | Description | Gene Ratio | Bg Ratio | pvalue | p.adjust | Count |
| GO:00008194 | Esophagus | ESCC | sister chromatid segregation | 157/8552 | 202/18723 | 8.41e-21 | 1.33e-18 | 157 |
| GO:003304416 | Esophagus | ESCC | regulation of chromosome organization | 145/8552 | 187/18723 | 3.80e-19 | 4.31e-17 | 145 |
| GO:000705911 | Esophagus | ESCC | chromosome segregation | 238/8552 | 346/18723 | 1.72e-18 | 1.82e-16 | 238 |
| GO:00062604 | Esophagus | ESCC | DNA replication | 181/8552 | 260/18723 | 3.55e-15 | 2.05e-13 | 181 |
| GO:005105215 | Esophagus | ESCC | regulation of DNA metabolic process | 232/8552 | 359/18723 | 2.40e-13 | 1.13e-11 | 232 |
| GO:00988133 | Esophagus | ESCC | nuclear chromosome segregation | 187/8552 | 281/18723 | 1.00e-12 | 4.36e-11 | 187 |
| GO:2001020110 | Esophagus | ESCC | regulation of response to DNA damage stimulus | 145/8552 | 219/18723 | 5.97e-10 | 1.50e-08 | 145 |
| GO:00519833 | Esophagus | ESCC | regulation of chromosome segregation | 67/8552 | 91/18723 | 5.42e-08 | 9.66e-07 | 67 |
| GO:00330452 | Esophagus | ESCC | regulation of sister chromatid segregation | 55/8552 | 72/18723 | 1.03e-07 | 1.69e-06 | 55 |
| GO:00063024 | Esophagus | ESCC | double-strand break repair | 152/8552 | 251/18723 | 1.33e-06 | 1.62e-05 | 152 |
| GO:00062826 | Esophagus | ESCC | regulation of DNA repair | 82/8552 | 130/18723 | 4.65e-05 | 3.66e-04 | 82 |
| GO:200102112 | Esophagus | ESCC | negative regulation of response to DNA damage stimulus | 54/8552 | 81/18723 | 1.09e-04 | 7.64e-04 | 54 |
| GO:00063101 | Esophagus | ESCC | DNA recombination | 168/8552 | 305/18723 | 5.58e-04 | 3.05e-03 | 168 |
| GO:20007793 | Esophagus | ESCC | regulation of double-strand break repair | 52/8552 | 85/18723 | 2.86e-03 | 1.21e-02 | 52 |
| GO:00007241 | Esophagus | ESCC | double-strand break repair via homologous recombination | 79/8552 | 138/18723 | 4.05e-03 | 1.62e-02 | 79 |
| GO:00007251 | Esophagus | ESCC | recombinational repair | 80/8552 | 140/18723 | 4.10e-03 | 1.63e-02 | 80 |
| GO:00008193 | Oral cavity | OSCC | sister chromatid segregation | 135/7305 | 202/18723 | 8.88e-16 | 6.52e-14 | 135 |
| GO:00070592 | Oral cavity | OSCC | chromosome segregation | 206/7305 | 346/18723 | 5.82e-15 | 3.76e-13 | 206 |
| GO:00330448 | Oral cavity | OSCC | regulation of chromosome organization | 123/7305 | 187/18723 | 9.87e-14 | 5.17e-12 | 123 |
| GO:00062603 | Oral cavity | OSCC | DNA replication | 159/7305 | 260/18723 | 3.25e-13 | 1.59e-11 | 159 |
| Page: 1 2 |
| Pathway ID | Tissue | Disease Stage | Description | Gene Ratio | Bg Ratio | pvalue | p.adjust | qvalue | Count |
| Page: 1 |
Top |
Cell-cell communication analysis |
| Identification of potential cell-cell interactions between two cell types and their ligand-receptor pairs for different disease states |
| Ligand | Receptor | LRpair | Pathway | Tissue | Disease Stage |
| Page: 1 |
Top |
Single-cell gene regulatory network inference analysis |
| Find out the significant the regulons (TFs) and the target genes of each regulon across cell types for different disease states |
| TF | Cell Type | Tissue | Disease Stage | Target Gene | RSS | Regulon Activity |
| ∗The dot plots of a searched regulon are shown for all cell subpopulations in each disease state of each tissue based on the regulon specific score inferred using pySCENIC and by calculating the average expression. |
| Page: 1 |
Top |
Somatic mutation of malignant transformation related genes |
| Annotation of somatic variants for genes involved in malignant transformation |
| Hugo Symbol | Variant Class | Variant Classification | dbSNP RS | HGVSc | HGVSp | HGVSp Short | SWISSPROT | BIOTYPE | SIFT | PolyPhen | Tumor Sample Barcode | Tissue | Histology | Sex | Age | Stage | Therapy Types | Drugs | Outcome |
| RMI2 | SNV | Missense_Mutation | c.431G>T | p.Arg144Met | p.R144M | Q96E14 | protein_coding | deleterious(0) | probably_damaging(0.985) | TCGA-AD-6895-01 | Colorectum | colon adenocarcinoma | Male | >=65 | III/IV | Unknown | Unknown | SD | |
| RMI2 | SNV | Missense_Mutation | novel | c.300N>T | p.Lys100Asn | p.K100N | Q96E14 | protein_coding | tolerated(0.12) | probably_damaging(0.971) | TCGA-AP-A056-01 | Endometrium | uterine corpus endometrioid carcinoma | Female | <65 | I/II | Unknown | Unknown | SD |
| RMI2 | SNV | Missense_Mutation | novel | c.371N>C | p.Asp124Ala | p.D124A | Q96E14 | protein_coding | deleterious(0) | probably_damaging(0.979) | TCGA-AX-A06F-01 | Endometrium | uterine corpus endometrioid carcinoma | Female | <65 | III/IV | Chemotherapy | carboplatin | SD |
| RMI2 | SNV | Missense_Mutation | novel | c.208N>T | p.Gly70Cys | p.G70C | Q96E14 | protein_coding | deleterious(0.02) | probably_damaging(1) | TCGA-56-8305-01 | Lung | lung squamous cell carcinoma | Male | >=65 | I/II | Unknown | Unknown | SD |
| Page: 1 |
Top |
Related drugs of malignant transformation related genes |
| Identification of chemicals and drugs interact with genes involved in malignant transfromation |
| (DGIdb 4.0) |
| Entrez ID | Symbol | Category | Interaction Types | Drug Claim Name | Drug Name | PMIDs |
| Page: 1 |

Copyright 2023-Present -The University of Texas Health Science Center at Houston |