
|
|||||
|
 | |
| |
| |
| |
| |
| |
|
Gene: RMDN1 |
Gene summary for RMDN1 |
| Gene information | Species | Human | Gene symbol | RMDN1 | Gene ID | 51115 |
| Gene name | regulator of microtubule dynamics 1 | |
| Gene Alias | CGI-90 | |
| Cytomap | 8q21.3 | |
| Gene Type | protein-coding | GO ID | GO:0000070 | UniProtAcc | Q6N086 |
Top |
Malignant transformation analysis |
| Identification of the aberrant gene expression in precancerous and cancerous lesions by comparing the gene expression of stem-like cells in diseased tissues with normal stem cells |
| Entrez ID | Symbol | Replicates | Species | Organ | Tissue | Adj P-value | Log2FC | Malignancy |
| 51115 | RMDN1 | LZE3D | Human | Esophagus | HGIN | 6.67e-03 | 5.16e-01 | 0.0668 |
| 51115 | RMDN1 | LZE4T | Human | Esophagus | ESCC | 8.04e-08 | 2.84e-01 | 0.0811 |
| 51115 | RMDN1 | LZE5T | Human | Esophagus | ESCC | 7.56e-03 | 2.39e-01 | 0.0514 |
| 51115 | RMDN1 | LZE8T | Human | Esophagus | ESCC | 1.06e-04 | 2.78e-01 | 0.067 |
| 51115 | RMDN1 | LZE20T | Human | Esophagus | ESCC | 3.32e-09 | 3.77e-01 | 0.0662 |
| 51115 | RMDN1 | LZE24T | Human | Esophagus | ESCC | 2.84e-15 | 3.69e-01 | 0.0596 |
| 51115 | RMDN1 | LZE6T | Human | Esophagus | ESCC | 1.87e-03 | 1.97e-01 | 0.0845 |
| 51115 | RMDN1 | P1T-E | Human | Esophagus | ESCC | 4.37e-03 | 2.61e-01 | 0.0875 |
| 51115 | RMDN1 | P2T-E | Human | Esophagus | ESCC | 1.07e-18 | 3.05e-01 | 0.1177 |
| 51115 | RMDN1 | P4T-E | Human | Esophagus | ESCC | 1.32e-26 | 6.90e-01 | 0.1323 |
| 51115 | RMDN1 | P5T-E | Human | Esophagus | ESCC | 1.15e-33 | 5.84e-01 | 0.1327 |
| 51115 | RMDN1 | P8T-E | Human | Esophagus | ESCC | 5.66e-16 | 1.79e-01 | 0.0889 |
| 51115 | RMDN1 | P9T-E | Human | Esophagus | ESCC | 8.21e-16 | 3.72e-01 | 0.1131 |
| 51115 | RMDN1 | P10T-E | Human | Esophagus | ESCC | 7.41e-24 | 3.80e-01 | 0.116 |
| 51115 | RMDN1 | P11T-E | Human | Esophagus | ESCC | 6.24e-08 | 3.20e-01 | 0.1426 |
| 51115 | RMDN1 | P12T-E | Human | Esophagus | ESCC | 1.28e-32 | 5.41e-01 | 0.1122 |
| 51115 | RMDN1 | P15T-E | Human | Esophagus | ESCC | 4.68e-16 | 3.74e-01 | 0.1149 |
| 51115 | RMDN1 | P16T-E | Human | Esophagus | ESCC | 2.26e-42 | 7.39e-01 | 0.1153 |
| 51115 | RMDN1 | P17T-E | Human | Esophagus | ESCC | 2.75e-14 | 6.68e-01 | 0.1278 |
| 51115 | RMDN1 | P19T-E | Human | Esophagus | ESCC | 8.05e-08 | 6.04e-01 | 0.1662 |
| Page: 1 2 3 4 5 6 |
| Tissue | Expression Dynamics | Abbreviation |
| Esophagus | 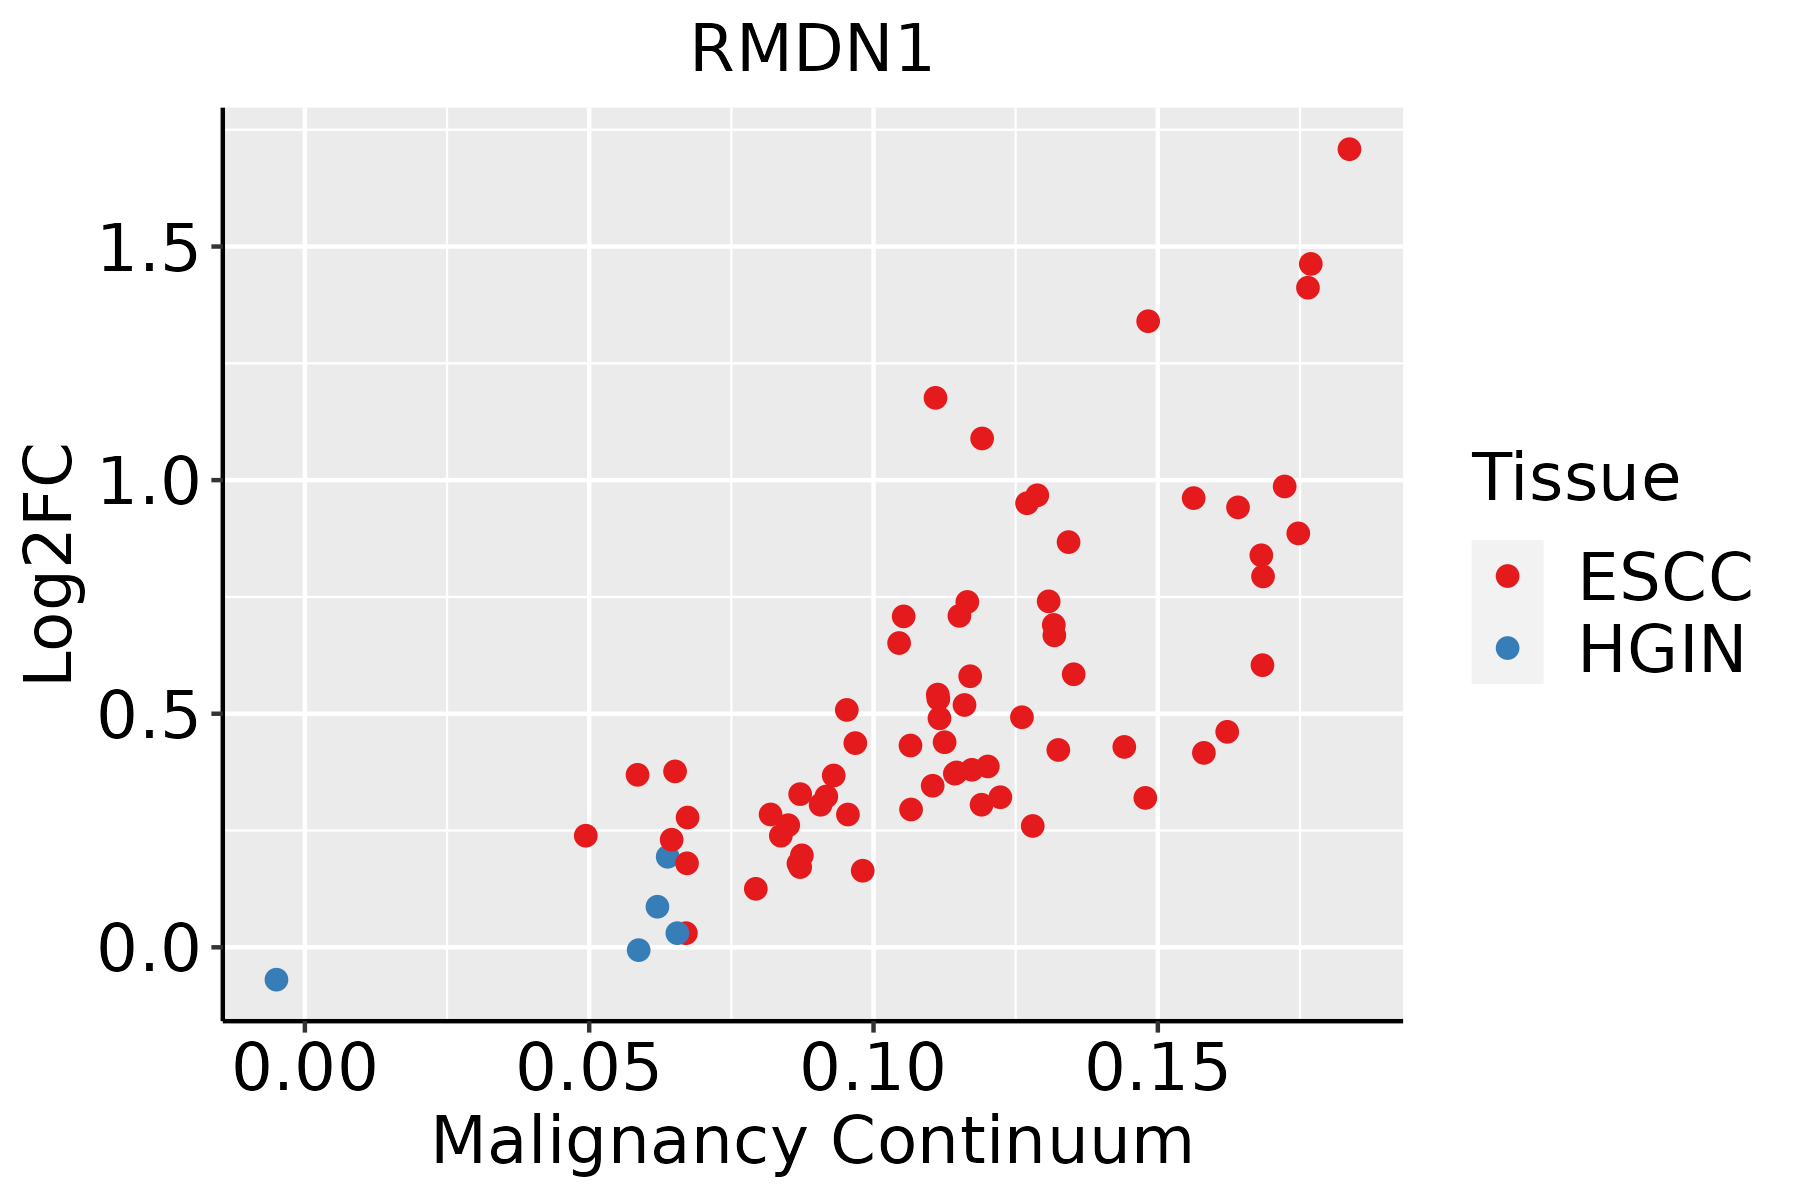 | ESCC: Esophageal squamous cell carcinoma |
| HGIN: High-grade intraepithelial neoplasias | ||
| LGIN: Low-grade intraepithelial neoplasias | ||
| Liver | 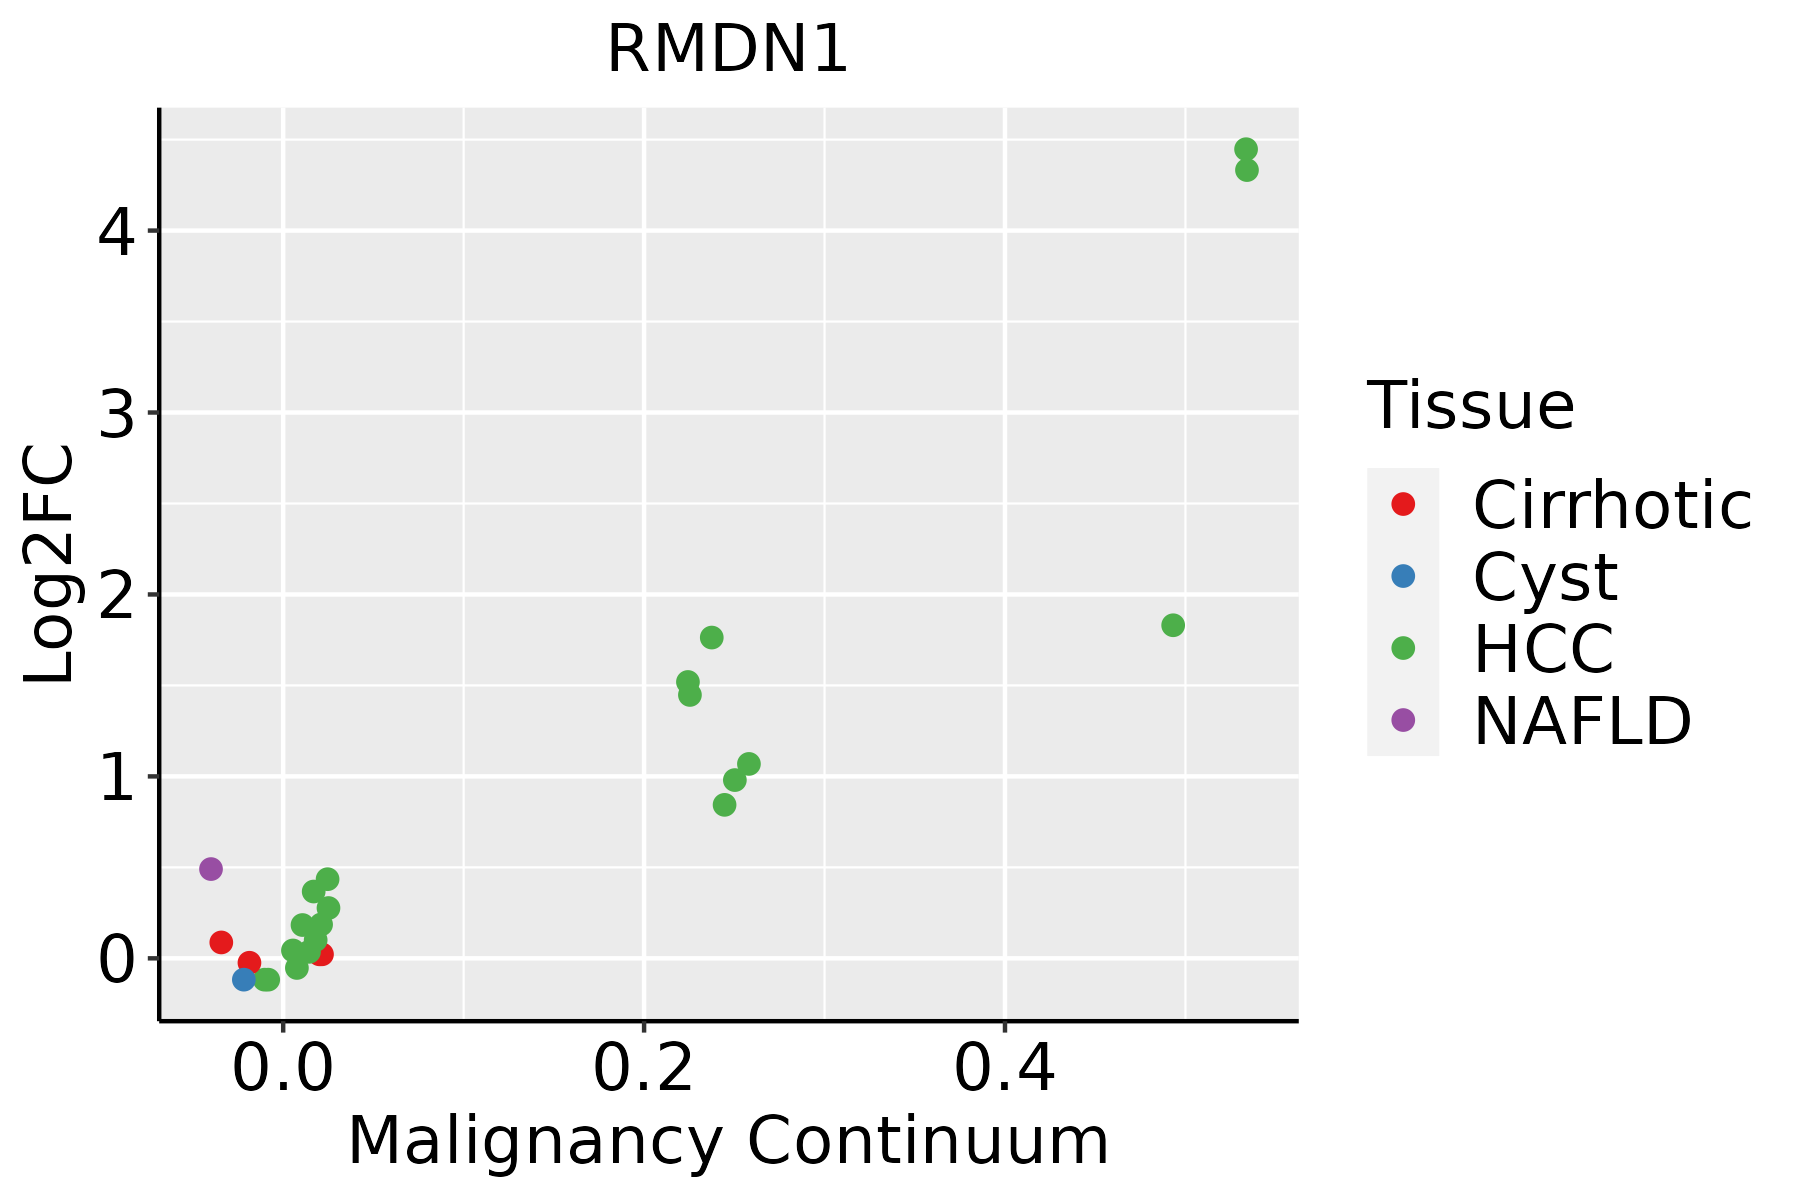 | HCC: Hepatocellular carcinoma |
| NAFLD: Non-alcoholic fatty liver disease | ||
| Oral Cavity |  | EOLP: Erosive Oral lichen planus |
| LP: leukoplakia | ||
| NEOLP: Non-erosive oral lichen planus | ||
| OSCC: Oral squamous cell carcinoma | ||
| Skin |  | AK: Actinic keratosis |
| cSCC: Cutaneous squamous cell carcinoma | ||
| SCCIS:squamous cell carcinoma in situ | ||
| Thyroid |  | ATC: Anaplastic thyroid cancer |
| HT: Hashimoto's thyroiditis | ||
| PTC: Papillary thyroid cancer |
| ∗log2FC in expression of this searched gene in stem-like cells from each diseased tissue sample relative to stem-like cells in normal samples in each tissue plotted against the malignancy continuum. Samples are colored based on if they are from different disease stage. |
Top |
Malignant transformation related pathway analysis |
| Find out the enriched GO biological processes and KEGG pathways involved in transition from healthy to precancer to cancer |
| Tissue | Disease Stage | Enriched GO biological Processes |
| Colorectum | AD |  |
| Colorectum | SER |  |
| Colorectum | MSS |  |
| Colorectum | MSI-H |  |
| Colorectum | FAP |  |
| ∗Top 15 enriched GO BP terms are showed in the bar plot of each disease state in each tissue. Each row represents a significant GO biological process which is colored according to the -log10(p.adjust). |
| Page: 1 2 3 4 5 6 7 8 9 |
| GO ID | Tissue | Disease Stage | Description | Gene Ratio | Bg Ratio | pvalue | p.adjust | Count |
| GO:014001414 | Esophagus | ESCC | mitotic nuclear division | 218/8552 | 287/18723 | 6.17e-26 | 1.78e-23 | 218 |
| GO:005165617 | Esophagus | ESCC | establishment of organelle localization | 273/8552 | 390/18723 | 9.13e-23 | 1.81e-20 | 273 |
| GO:000007011 | Esophagus | ESCC | mitotic sister chromatid segregation | 138/8552 | 168/18723 | 1.37e-22 | 2.63e-20 | 138 |
| GO:00008194 | Esophagus | ESCC | sister chromatid segregation | 157/8552 | 202/18723 | 8.41e-21 | 1.33e-18 | 157 |
| GO:000705911 | Esophagus | ESCC | chromosome segregation | 238/8552 | 346/18723 | 1.72e-18 | 1.82e-16 | 238 |
| GO:190285015 | Esophagus | ESCC | microtubule cytoskeleton organization involved in mitosis | 116/8552 | 147/18723 | 1.25e-16 | 9.91e-15 | 116 |
| GO:000705214 | Esophagus | ESCC | mitotic spindle organization | 97/8552 | 120/18723 | 2.17e-15 | 1.33e-13 | 97 |
| GO:000705114 | Esophagus | ESCC | spindle organization | 134/8552 | 184/18723 | 5.70e-14 | 2.87e-12 | 134 |
| GO:005131011 | Esophagus | ESCC | metaphase plate congression | 58/8552 | 65/18723 | 1.81e-13 | 8.63e-12 | 58 |
| GO:000708011 | Esophagus | ESCC | mitotic metaphase plate congression | 47/8552 | 50/18723 | 3.15e-13 | 1.47e-11 | 47 |
| GO:00482853 | Esophagus | ESCC | organelle fission | 301/8552 | 488/18723 | 4.64e-13 | 2.12e-11 | 301 |
| GO:00988133 | Esophagus | ESCC | nuclear chromosome segregation | 187/8552 | 281/18723 | 1.00e-12 | 4.36e-11 | 187 |
| GO:005130311 | Esophagus | ESCC | establishment of chromosome localization | 67/8552 | 80/18723 | 1.92e-12 | 8.09e-11 | 67 |
| GO:005000011 | Esophagus | ESCC | chromosome localization | 68/8552 | 82/18723 | 3.37e-12 | 1.32e-10 | 68 |
| GO:00002802 | Esophagus | ESCC | nuclear division | 270/8552 | 439/18723 | 1.17e-11 | 4.24e-10 | 270 |
| GO:00086081 | Esophagus | ESCC | attachment of spindle microtubules to kinetochore | 29/8552 | 35/18723 | 6.61e-06 | 6.75e-05 | 29 |
| GO:00513151 | Esophagus | ESCC | attachment of mitotic spindle microtubules to kinetochore | 15/8552 | 15/18723 | 7.81e-06 | 7.69e-05 | 15 |
| GO:00516565 | Liver | NAFLD | establishment of organelle localization | 57/1882 | 390/18723 | 2.52e-03 | 2.34e-02 | 57 |
| GO:014001411 | Liver | HCC | mitotic nuclear division | 174/7958 | 287/18723 | 3.74e-10 | 1.23e-08 | 174 |
| GO:005165621 | Liver | HCC | establishment of organelle localization | 226/7958 | 390/18723 | 4.15e-10 | 1.34e-08 | 226 |
| Page: 1 2 3 4 5 6 |
| Pathway ID | Tissue | Disease Stage | Description | Gene Ratio | Bg Ratio | pvalue | p.adjust | qvalue | Count |
| Page: 1 |
Top |
Cell-cell communication analysis |
| Identification of potential cell-cell interactions between two cell types and their ligand-receptor pairs for different disease states |
| Ligand | Receptor | LRpair | Pathway | Tissue | Disease Stage |
| Page: 1 |
Top |
Single-cell gene regulatory network inference analysis |
| Find out the significant the regulons (TFs) and the target genes of each regulon across cell types for different disease states |
| TF | Cell Type | Tissue | Disease Stage | Target Gene | RSS | Regulon Activity |
| ∗The dot plots of a searched regulon are shown for all cell subpopulations in each disease state of each tissue based on the regulon specific score inferred using pySCENIC and by calculating the average expression. |
| Page: 1 |
Top |
Somatic mutation of malignant transformation related genes |
| Annotation of somatic variants for genes involved in malignant transformation |
| Hugo Symbol | Variant Class | Variant Classification | dbSNP RS | HGVSc | HGVSp | HGVSp Short | SWISSPROT | BIOTYPE | SIFT | PolyPhen | Tumor Sample Barcode | Tissue | Histology | Sex | Age | Stage | Therapy Types | Drugs | Outcome |
| RMDN1 | SNV | Missense_Mutation | novel | c.490N>T | p.His164Tyr | p.H164Y | Q96DB5 | protein_coding | deleterious(0) | probably_damaging(0.924) | TCGA-A7-A6VW-01 | Breast | breast invasive carcinoma | Female | <65 | I/II | Chemotherapy | doxorubicin | CR |
| RMDN1 | deletion | Frame_Shift_Del | novel | c.470delA | p.Asn157MetfsTer44 | p.N157Mfs*44 | Q96DB5 | protein_coding | TCGA-EW-A2FV-01 | Breast | breast invasive carcinoma | Female | <65 | III/IV | Chemotherapy | docetaxel | SD | ||
| RMDN1 | deletion | Frame_Shift_Del | novel | c.454delN | p.Arg152GlufsTer3 | p.R152Efs*3 | Q96DB5 | protein_coding | TCGA-2W-A8YY-01 | Cervix | cervical & endocervical cancer | Female | <65 | I/II | Chemotherapy | cisplatin | CR | ||
| RMDN1 | SNV | Missense_Mutation | rs756781000 | c.793C>A | p.Leu265Ile | p.L265I | Q96DB5 | protein_coding | deleterious(0.03) | benign(0.373) | TCGA-AA-A010-01 | Colorectum | colon adenocarcinoma | Female | <65 | I/II | Chemotherapy | folinic | CR |
| RMDN1 | SNV | Missense_Mutation | c.899A>G | p.Gln300Arg | p.Q300R | Q96DB5 | protein_coding | tolerated(0.15) | benign(0.055) | TCGA-AD-6889-01 | Colorectum | colon adenocarcinoma | Male | >=65 | I/II | Chemotherapy | xeloda | PD | |
| RMDN1 | SNV | Missense_Mutation | rs200295883 | c.377N>A | p.Arg126His | p.R126H | Q96DB5 | protein_coding | tolerated(0.05) | possibly_damaging(0.544) | TCGA-AZ-6601-01 | Colorectum | colon adenocarcinoma | Male | >=65 | I/II | Unknown | Unknown | PD |
| RMDN1 | insertion | Frame_Shift_Ins | novel | c.470_471insA | p.Asn157LysfsTer2 | p.N157Kfs*2 | Q96DB5 | protein_coding | TCGA-CM-6171-01 | Colorectum | colon adenocarcinoma | Female | >=65 | I/II | Unknown | Unknown | SD | ||
| RMDN1 | SNV | Missense_Mutation | novel | c.694N>A | p.Leu232Met | p.L232M | Q96DB5 | protein_coding | deleterious(0) | probably_damaging(0.99) | TCGA-A5-A0G1-01 | Endometrium | uterine corpus endometrioid carcinoma | Female | >=65 | I/II | Unknown | Unknown | SD |
| RMDN1 | SNV | Missense_Mutation | novel | c.760G>T | p.Val254Leu | p.V254L | Q96DB5 | protein_coding | tolerated(0.12) | benign(0.015) | TCGA-A5-A1OF-01 | Endometrium | uterine corpus endometrioid carcinoma | Female | <65 | I/II | Unknown | Unknown | SD |
| RMDN1 | SNV | Missense_Mutation | c.613N>A | p.Ala205Thr | p.A205T | Q96DB5 | protein_coding | deleterious(0) | possibly_damaging(0.771) | TCGA-AP-A051-01 | Endometrium | uterine corpus endometrioid carcinoma | Female | >=65 | I/II | Unknown | Unknown | SD |
| Page: 1 2 3 |
Top |
Related drugs of malignant transformation related genes |
| Identification of chemicals and drugs interact with genes involved in malignant transfromation |
| (DGIdb 4.0) |
| Entrez ID | Symbol | Category | Interaction Types | Drug Claim Name | Drug Name | PMIDs |
| Page: 1 |

Copyright 2023-Present -The University of Texas Health Science Center at Houston |