
|
|||||
|
 | |
| |
| |
| |
| |
| |
|
Gene: RLF |
Gene summary for RLF |
| Gene information | Species | Human | Gene symbol | RLF | Gene ID | 6018 |
| Gene name | RLF zinc finger | |
| Gene Alias | ZN-15L | |
| Cytomap | 1p34.2 | |
| Gene Type | protein-coding | GO ID | GO:0006139 | UniProtAcc | Q13129 |
Top |
Malignant transformation analysis |
| Identification of the aberrant gene expression in precancerous and cancerous lesions by comparing the gene expression of stem-like cells in diseased tissues with normal stem cells |
| Entrez ID | Symbol | Replicates | Species | Organ | Tissue | Adj P-value | Log2FC | Malignancy |
| 6018 | RLF | CCI_1 | Human | Cervix | CC | 1.16e-10 | 8.79e-01 | 0.528 |
| 6018 | RLF | CCI_3 | Human | Cervix | CC | 5.94e-04 | 5.96e-01 | 0.516 |
| 6018 | RLF | LZE4T | Human | Esophagus | ESCC | 1.63e-13 | 3.07e-01 | 0.0811 |
| 6018 | RLF | LZE7T | Human | Esophagus | ESCC | 8.02e-03 | 3.46e-01 | 0.0667 |
| 6018 | RLF | LZE8T | Human | Esophagus | ESCC | 1.34e-02 | 1.55e-01 | 0.067 |
| 6018 | RLF | LZE20T | Human | Esophagus | ESCC | 2.22e-07 | 1.40e-01 | 0.0662 |
| 6018 | RLF | LZE22T | Human | Esophagus | ESCC | 1.13e-05 | 2.08e-01 | 0.068 |
| 6018 | RLF | LZE24T | Human | Esophagus | ESCC | 1.10e-13 | 4.56e-01 | 0.0596 |
| 6018 | RLF | LZE21T | Human | Esophagus | ESCC | 2.33e-02 | 2.44e-01 | 0.0655 |
| 6018 | RLF | P1T-E | Human | Esophagus | ESCC | 1.83e-04 | 2.48e-01 | 0.0875 |
| 6018 | RLF | P2T-E | Human | Esophagus | ESCC | 3.48e-40 | 6.71e-01 | 0.1177 |
| 6018 | RLF | P4T-E | Human | Esophagus | ESCC | 2.88e-14 | 3.71e-01 | 0.1323 |
| 6018 | RLF | P5T-E | Human | Esophagus | ESCC | 8.47e-23 | 3.70e-01 | 0.1327 |
| 6018 | RLF | P8T-E | Human | Esophagus | ESCC | 6.09e-23 | 3.58e-01 | 0.0889 |
| 6018 | RLF | P9T-E | Human | Esophagus | ESCC | 5.58e-09 | 1.02e-01 | 0.1131 |
| 6018 | RLF | P10T-E | Human | Esophagus | ESCC | 6.44e-33 | 5.65e-01 | 0.116 |
| 6018 | RLF | P11T-E | Human | Esophagus | ESCC | 3.66e-18 | 7.08e-01 | 0.1426 |
| 6018 | RLF | P12T-E | Human | Esophagus | ESCC | 3.53e-25 | 5.81e-01 | 0.1122 |
| 6018 | RLF | P15T-E | Human | Esophagus | ESCC | 2.25e-23 | 6.02e-01 | 0.1149 |
| 6018 | RLF | P16T-E | Human | Esophagus | ESCC | 3.78e-17 | 2.69e-01 | 0.1153 |
| Page: 1 2 3 4 5 6 |
| Tissue | Expression Dynamics | Abbreviation |
| Cervix | 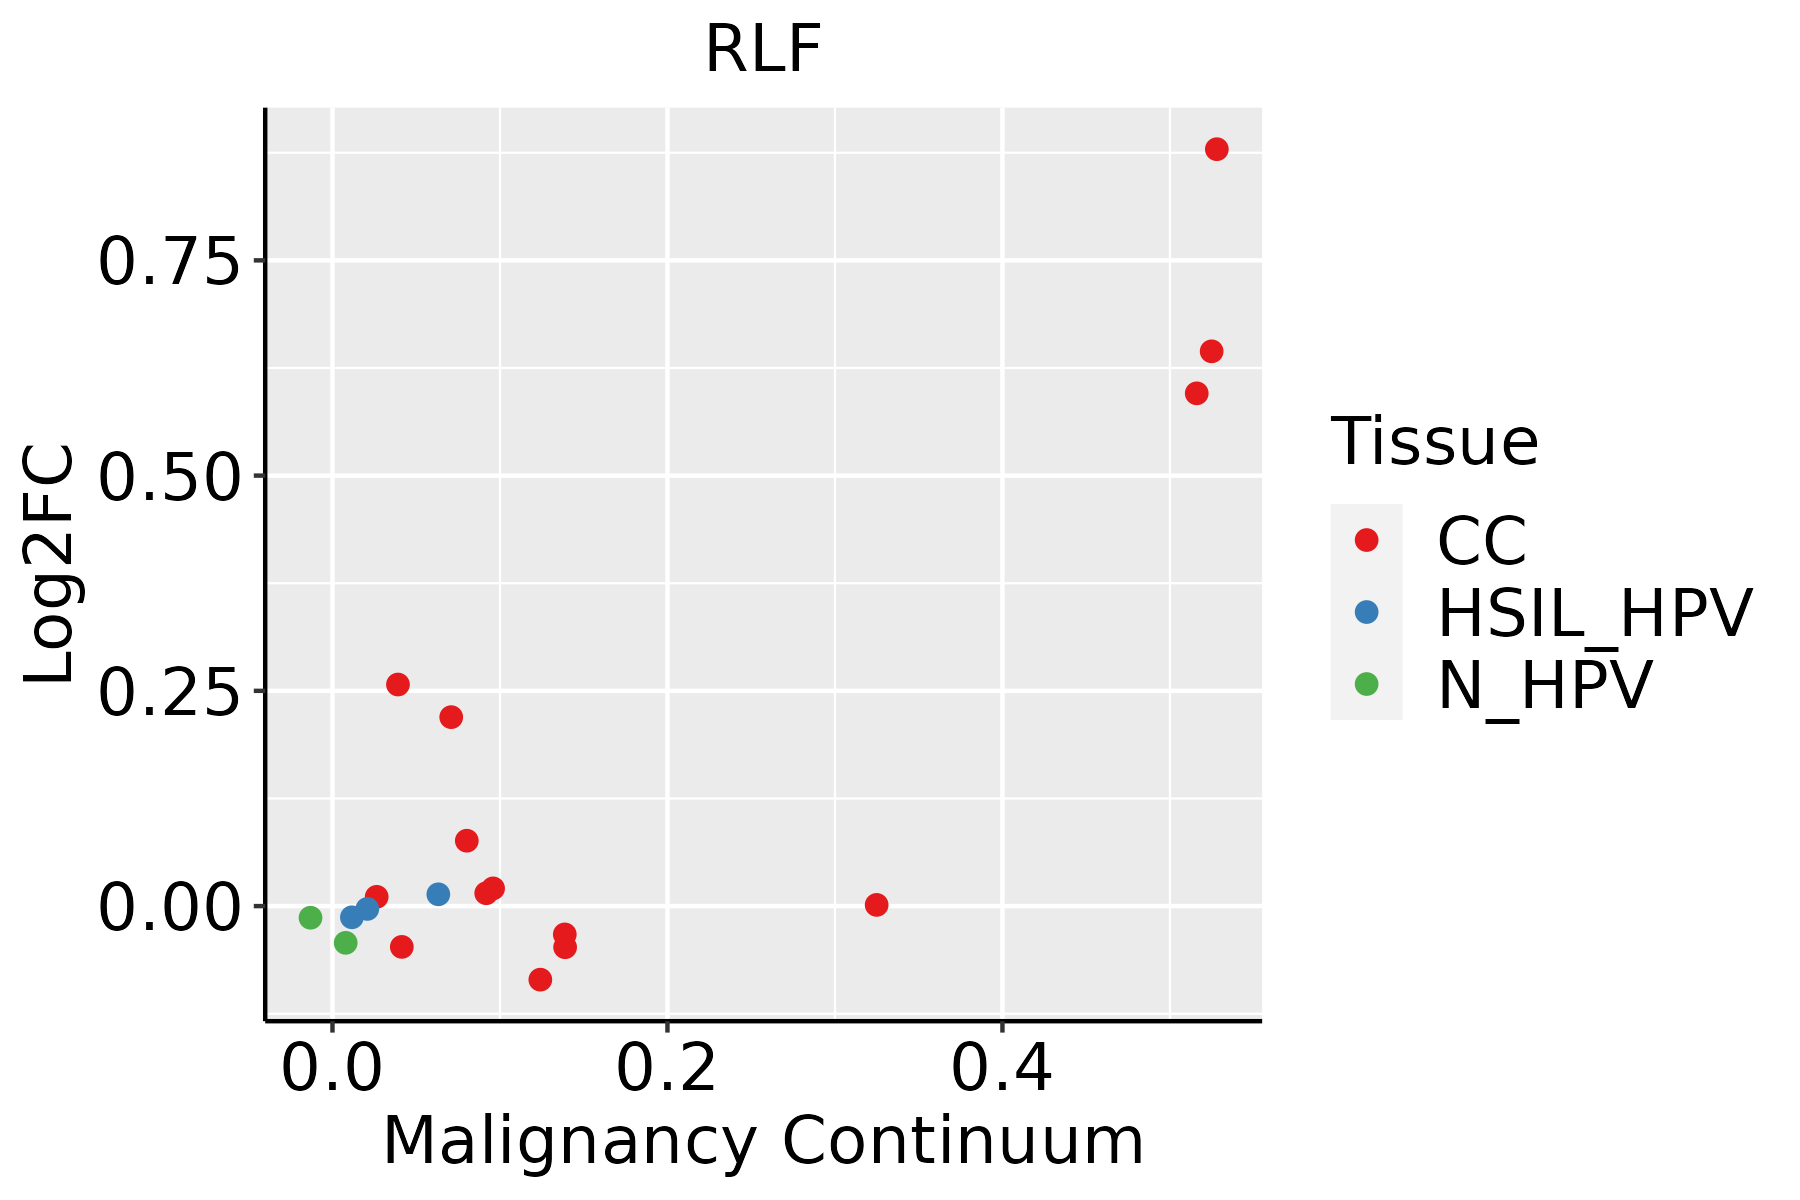 | CC: Cervix cancer |
| HSIL_HPV: HPV-infected high-grade squamous intraepithelial lesions | ||
| N_HPV: HPV-infected normal cervix | ||
| Esophagus | 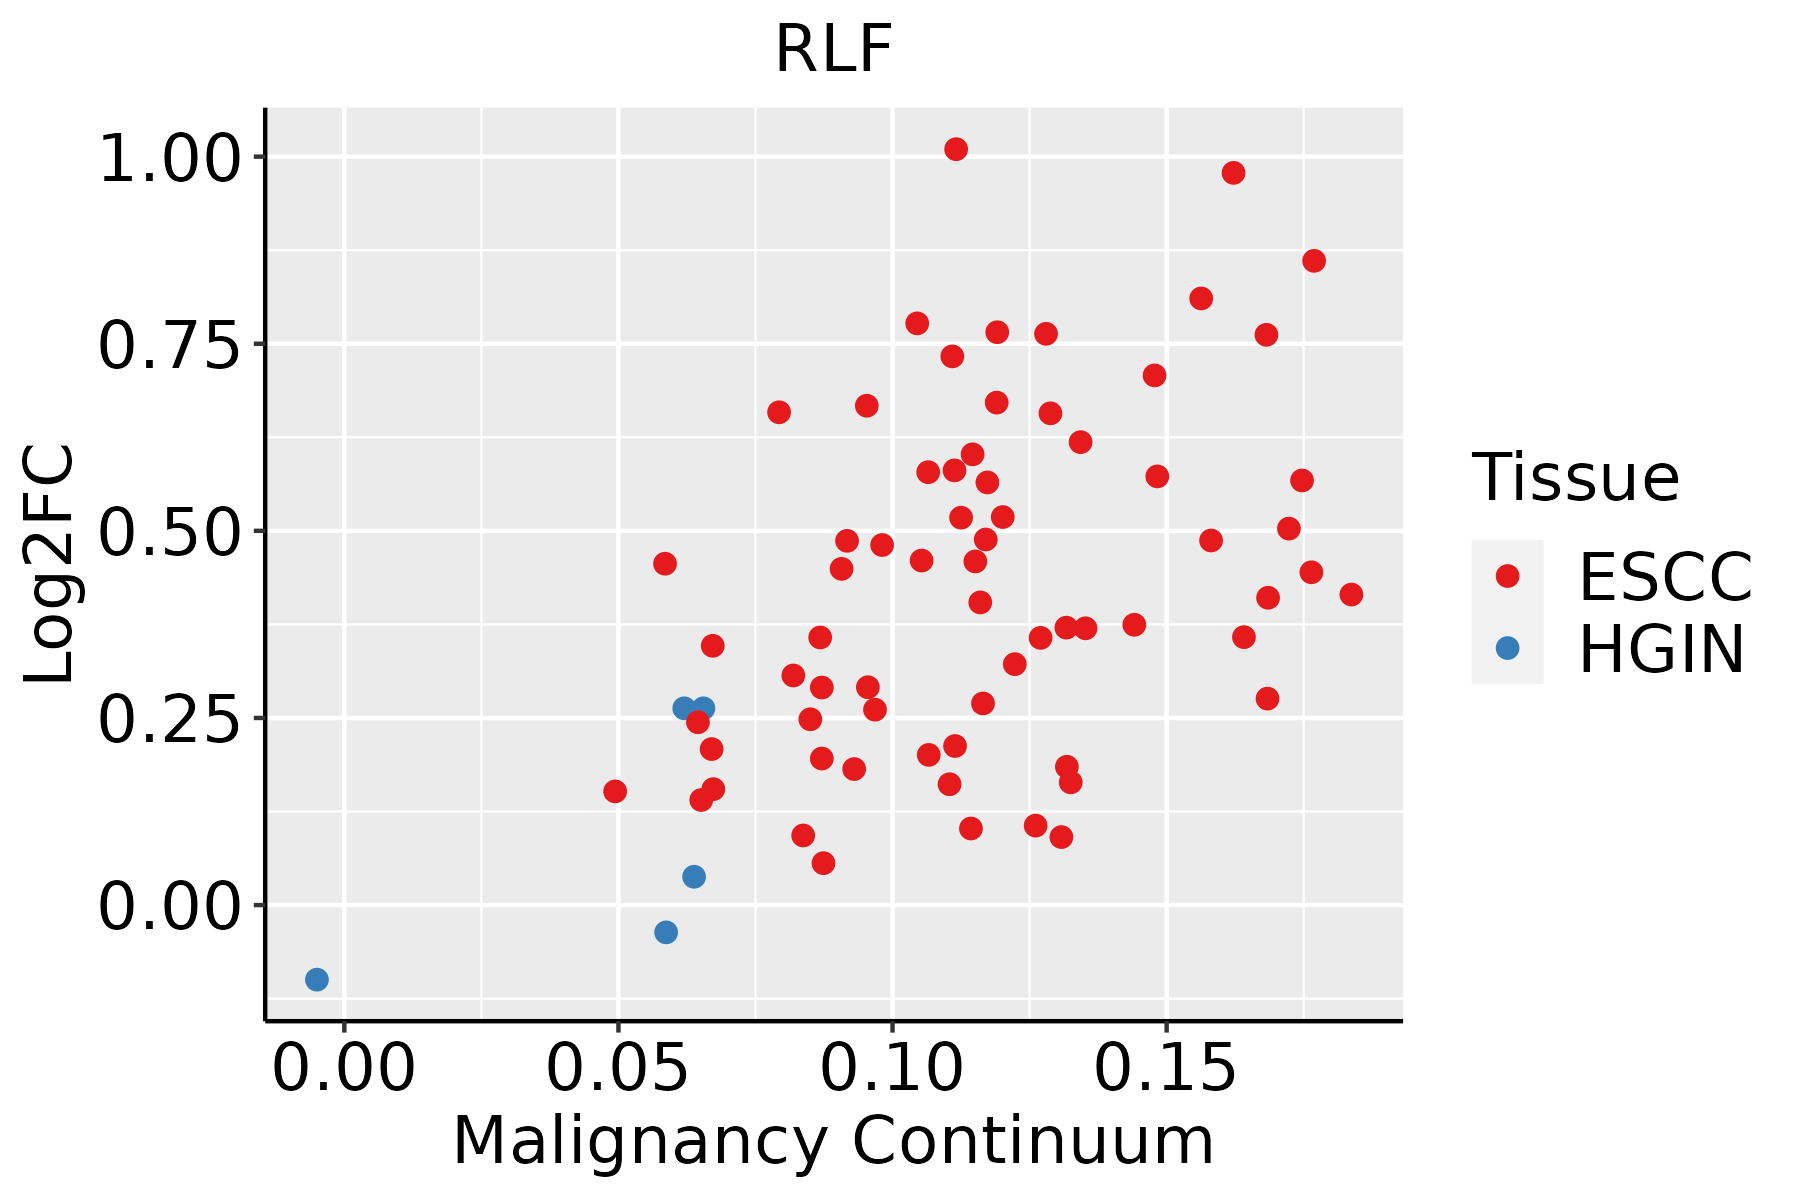 | ESCC: Esophageal squamous cell carcinoma |
| HGIN: High-grade intraepithelial neoplasias | ||
| LGIN: Low-grade intraepithelial neoplasias | ||
| Lung | 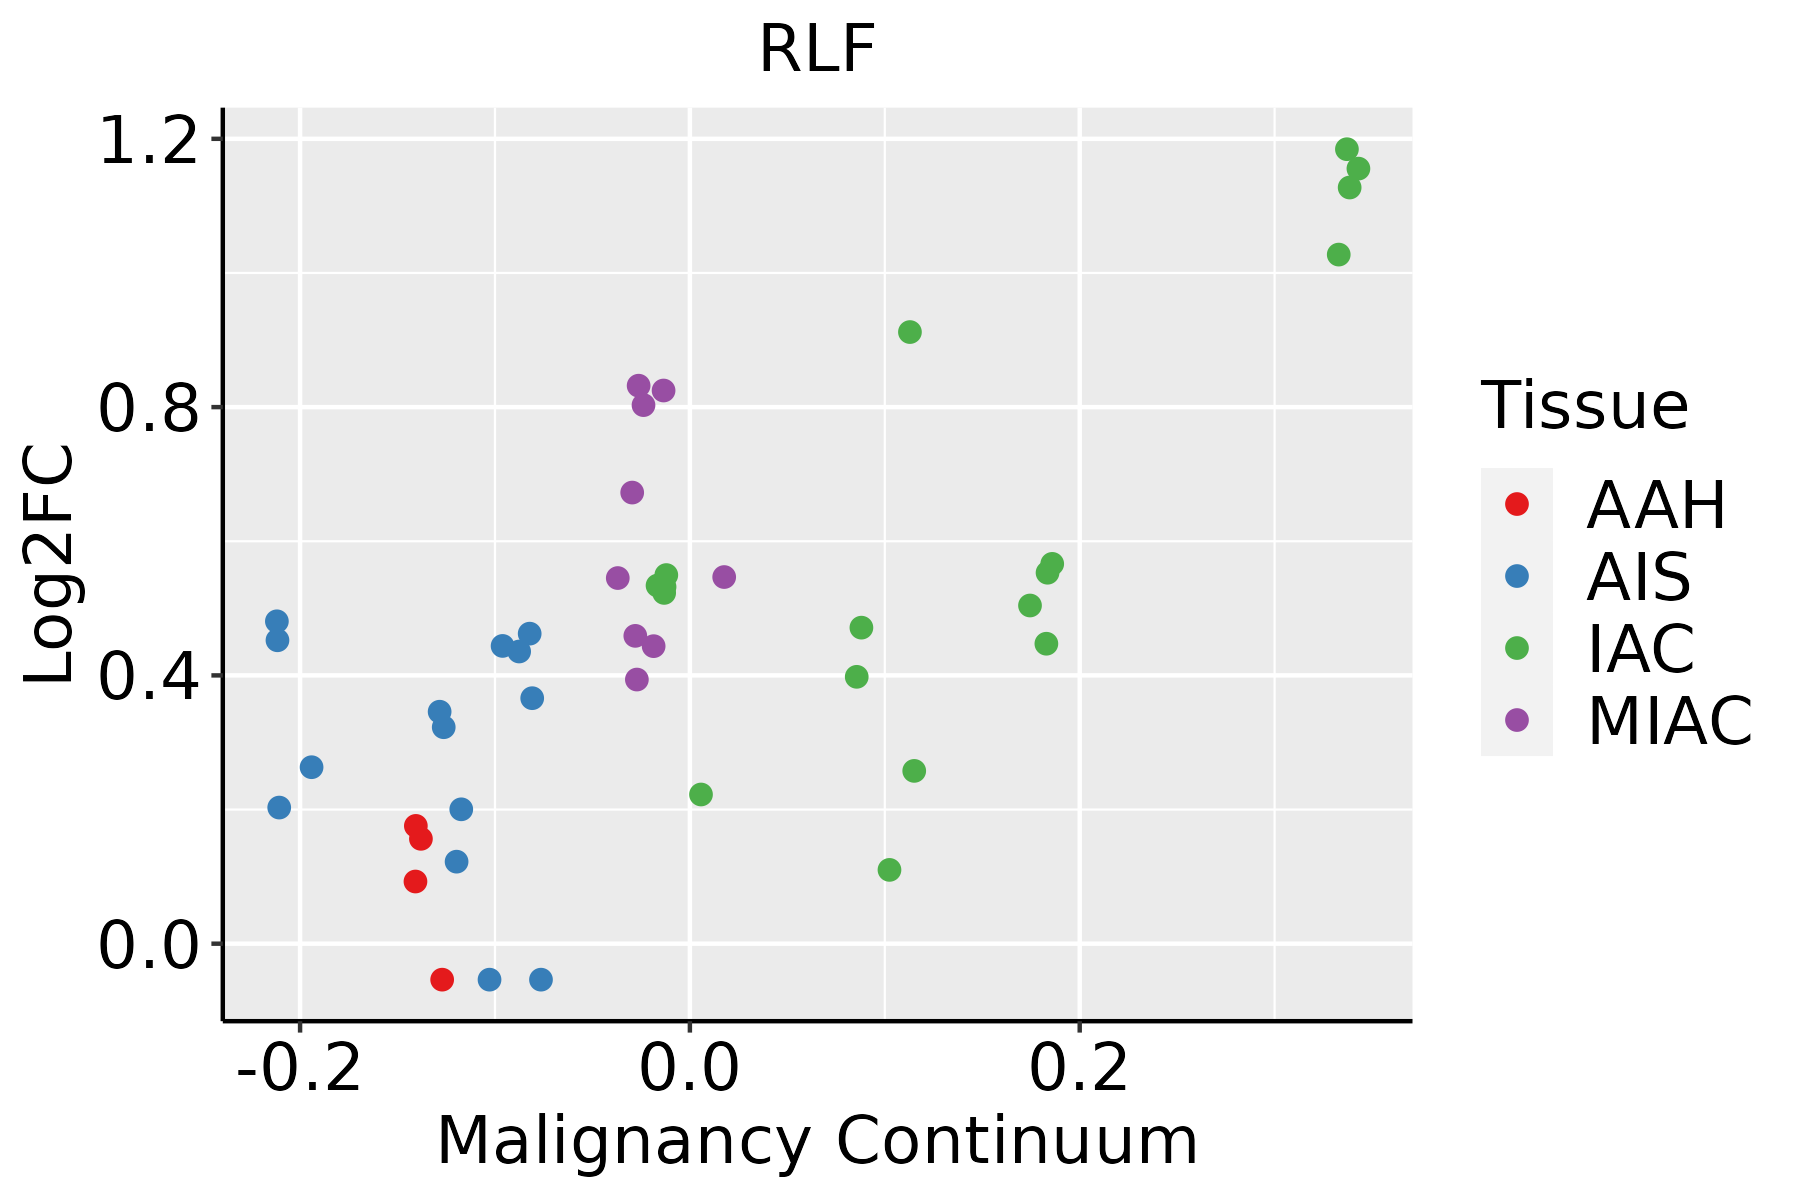 | AAH: Atypical adenomatous hyperplasia |
| AIS: Adenocarcinoma in situ | ||
| IAC: Invasive lung adenocarcinoma | ||
| MIA: Minimally invasive adenocarcinoma | ||
| Prostate |  | BPH: Benign Prostatic Hyperplasia |
| Skin | 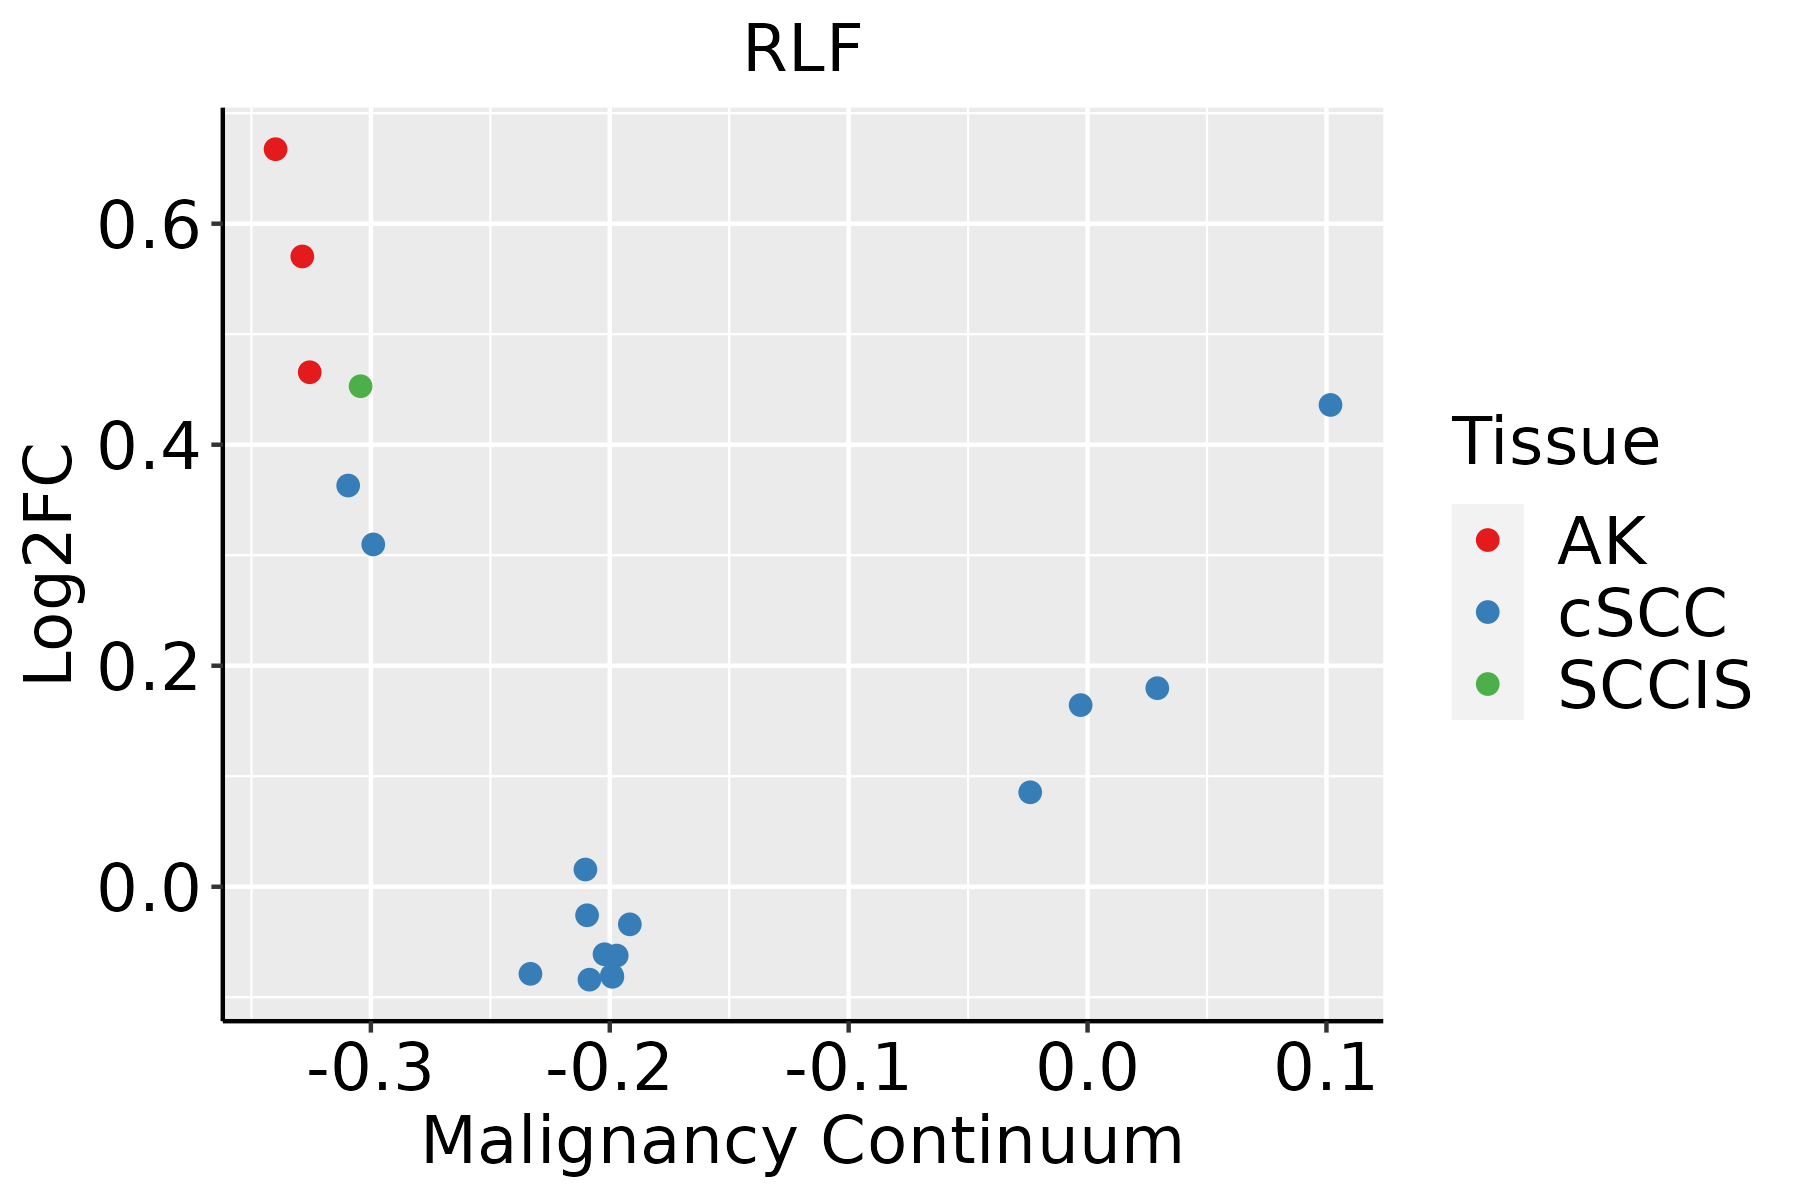 | AK: Actinic keratosis |
| cSCC: Cutaneous squamous cell carcinoma | ||
| SCCIS:squamous cell carcinoma in situ |
| ∗log2FC in expression of this searched gene in stem-like cells from each diseased tissue sample relative to stem-like cells in normal samples in each tissue plotted against the malignancy continuum. Samples are colored based on if they are from different disease stage. |
Top |
Malignant transformation related pathway analysis |
| Find out the enriched GO biological processes and KEGG pathways involved in transition from healthy to precancer to cancer |
| Tissue | Disease Stage | Enriched GO biological Processes |
| Colorectum | AD |  |
| Colorectum | SER |  |
| Colorectum | MSS |  |
| Colorectum | MSI-H |  |
| Colorectum | FAP |  |
| ∗Top 15 enriched GO BP terms are showed in the bar plot of each disease state in each tissue. Each row represents a significant GO biological process which is colored according to the -log10(p.adjust). |
| Page: 1 2 3 4 5 6 7 8 9 |
| GO ID | Tissue | Disease Stage | Description | Gene Ratio | Bg Ratio | pvalue | p.adjust | Count |
| GO:00165705 | Cervix | CC | histone modification | 84/2311 | 463/18723 | 1.70e-04 | 2.01e-03 | 84 |
| GO:00349685 | Cervix | CC | histone lysine methylation | 27/2311 | 115/18723 | 6.61e-04 | 6.09e-03 | 27 |
| GO:00510528 | Cervix | CC | regulation of DNA metabolic process | 65/2311 | 359/18723 | 9.25e-04 | 7.84e-03 | 65 |
| GO:00165715 | Cervix | CC | histone methylation | 30/2311 | 141/18723 | 1.88e-03 | 1.39e-02 | 30 |
| GO:00180224 | Cervix | CC | peptidyl-lysine methylation | 28/2311 | 131/18723 | 2.43e-03 | 1.71e-02 | 28 |
| GO:00064795 | Cervix | CC | protein methylation | 36/2311 | 181/18723 | 2.46e-03 | 1.71e-02 | 36 |
| GO:00082135 | Cervix | CC | protein alkylation | 36/2311 | 181/18723 | 2.46e-03 | 1.71e-02 | 36 |
| GO:00182054 | Cervix | CC | peptidyl-lysine modification | 62/2311 | 376/18723 | 1.04e-02 | 4.97e-02 | 62 |
| GO:001657015 | Esophagus | ESCC | histone modification | 323/8552 | 463/18723 | 2.61e-26 | 7.88e-24 | 323 |
| GO:001820514 | Esophagus | ESCC | peptidyl-lysine modification | 259/8552 | 376/18723 | 3.90e-20 | 5.26e-18 | 259 |
| GO:004477216 | Esophagus | ESCC | mitotic cell cycle phase transition | 281/8552 | 424/18723 | 4.63e-18 | 4.45e-16 | 281 |
| GO:005105215 | Esophagus | ESCC | regulation of DNA metabolic process | 232/8552 | 359/18723 | 2.40e-13 | 1.13e-11 | 232 |
| GO:0016049110 | Esophagus | ESCC | cell growth | 289/8552 | 482/18723 | 1.29e-10 | 3.77e-09 | 289 |
| GO:00434143 | Esophagus | ESCC | macromolecule methylation | 199/8552 | 316/18723 | 3.44e-10 | 9.57e-09 | 199 |
| GO:00322592 | Esophagus | ESCC | methylation | 222/8552 | 364/18723 | 2.26e-09 | 5.09e-08 | 222 |
| GO:000155819 | Esophagus | ESCC | regulation of cell growth | 248/8552 | 414/18723 | 2.97e-09 | 6.45e-08 | 248 |
| GO:000008214 | Esophagus | ESCC | G1/S transition of mitotic cell cycle | 134/8552 | 214/18723 | 4.04e-07 | 5.55e-06 | 134 |
| GO:004484314 | Esophagus | ESCC | cell cycle G1/S phase transition | 148/8552 | 241/18723 | 5.68e-07 | 7.48e-06 | 148 |
| GO:000647914 | Esophagus | ESCC | protein methylation | 115/8552 | 181/18723 | 9.07e-07 | 1.16e-05 | 115 |
| GO:000821314 | Esophagus | ESCC | protein alkylation | 115/8552 | 181/18723 | 9.07e-07 | 1.16e-05 | 115 |
| Page: 1 2 3 4 5 6 |
| Pathway ID | Tissue | Disease Stage | Description | Gene Ratio | Bg Ratio | pvalue | p.adjust | qvalue | Count |
| Page: 1 |
Top |
Cell-cell communication analysis |
| Identification of potential cell-cell interactions between two cell types and their ligand-receptor pairs for different disease states |
| Ligand | Receptor | LRpair | Pathway | Tissue | Disease Stage |
| Page: 1 |
Top |
Single-cell gene regulatory network inference analysis |
| Find out the significant the regulons (TFs) and the target genes of each regulon across cell types for different disease states |
| TF | Cell Type | Tissue | Disease Stage | Target Gene | RSS | Regulon Activity |
| ∗The dot plots of a searched regulon are shown for all cell subpopulations in each disease state of each tissue based on the regulon specific score inferred using pySCENIC and by calculating the average expression. |
| Page: 1 |
Top |
Somatic mutation of malignant transformation related genes |
| Annotation of somatic variants for genes involved in malignant transformation |
| Hugo Symbol | Variant Class | Variant Classification | dbSNP RS | HGVSc | HGVSp | HGVSp Short | SWISSPROT | BIOTYPE | SIFT | PolyPhen | Tumor Sample Barcode | Tissue | Histology | Sex | Age | Stage | Therapy Types | Drugs | Outcome |
| RLF | SNV | Missense_Mutation | novel | c.1436N>A | p.Cys479Tyr | p.C479Y | Q13129 | protein_coding | deleterious(0) | probably_damaging(0.998) | TCGA-5L-AAT1-01 | Breast | breast invasive carcinoma | Female | <65 | III/IV | Hormone Therapy | letrozol | SD |
| RLF | SNV | Missense_Mutation | c.5122G>C | p.Glu1708Gln | p.E1708Q | Q13129 | protein_coding | tolerated(0.22) | benign(0.234) | TCGA-AC-A23H-01 | Breast | breast invasive carcinoma | Female | >=65 | I/II | Unknown | Unknown | PD | |
| RLF | SNV | Missense_Mutation | c.3224N>T | p.Ser1075Leu | p.S1075L | Q13129 | protein_coding | deleterious(0.02) | benign(0.015) | TCGA-AC-A6IX-01 | Breast | breast invasive carcinoma | Female | <65 | III/IV | Unknown | Unknown | SD | |
| RLF | SNV | Missense_Mutation | rs752951336 | c.2308C>T | p.Arg770Cys | p.R770C | Q13129 | protein_coding | deleterious(0.01) | possibly_damaging(0.854) | TCGA-AN-A046-01 | Breast | breast invasive carcinoma | Female | >=65 | I/II | Unknown | Unknown | SD |
| RLF | SNV | Missense_Mutation | rs368064385 | c.4372C>T | p.Arg1458Cys | p.R1458C | Q13129 | protein_coding | tolerated(0.19) | benign(0) | TCGA-AN-A046-01 | Breast | breast invasive carcinoma | Female | >=65 | I/II | Unknown | Unknown | SD |
| RLF | SNV | Missense_Mutation | c.388N>C | p.Val130Leu | p.V130L | Q13129 | protein_coding | tolerated(0.07) | benign(0.027) | TCGA-AN-A0AT-01 | Breast | breast invasive carcinoma | Female | <65 | I/II | Unknown | Unknown | SD | |
| RLF | SNV | Missense_Mutation | c.2606A>G | p.Asp869Gly | p.D869G | Q13129 | protein_coding | tolerated(0.09) | benign(0.015) | TCGA-B6-A0I6-01 | Breast | breast invasive carcinoma | Female | <65 | I/II | Unknown | Unknown | PD | |
| RLF | SNV | Missense_Mutation | c.2264C>T | p.Ser755Leu | p.S755L | Q13129 | protein_coding | deleterious(0) | possibly_damaging(0.761) | TCGA-B6-A0IK-01 | Breast | breast invasive carcinoma | Female | <65 | III/IV | Unknown | Unknown | PD | |
| RLF | SNV | Missense_Mutation | c.2222N>T | p.Pro741Leu | p.P741L | Q13129 | protein_coding | deleterious(0) | probably_damaging(0.999) | TCGA-BH-A0HF-01 | Breast | breast invasive carcinoma | Female | >=65 | I/II | Hormone Therapy | arimidex | SD | |
| RLF | SNV | Missense_Mutation | c.5612N>A | p.Cys1871Tyr | p.C1871Y | Q13129 | protein_coding | deleterious(0) | probably_damaging(0.956) | TCGA-BH-A0HP-01 | Breast | breast invasive carcinoma | Female | >=65 | III/IV | Chemotherapy | doxorubicin | SD |
| Page: 1 2 3 4 5 6 7 8 9 10 11 12 13 14 15 16 17 18 |
Top |
Related drugs of malignant transformation related genes |
| Identification of chemicals and drugs interact with genes involved in malignant transfromation |
| (DGIdb 4.0) |
| Entrez ID | Symbol | Category | Interaction Types | Drug Claim Name | Drug Name | PMIDs |
| Page: 1 |

Copyright 2023-Present -The University of Texas Health Science Center at Houston |