
|
|||||
|
 | |
| |
| |
| |
| |
| |
|
Gene: RITA1 |
Gene summary for RITA1 |
| Gene information | Species | Human | Gene symbol | RITA1 | Gene ID | 84934 |
| Gene name | RBPJ interacting and tubulin associated 1 | |
| Gene Alias | C12orf52 | |
| Cytomap | 12q24.13 | |
| Gene Type | protein-coding | GO ID | GO:0000122 | UniProtAcc | Q96K30 |
Top |
Malignant transformation analysis |
| Identification of the aberrant gene expression in precancerous and cancerous lesions by comparing the gene expression of stem-like cells in diseased tissues with normal stem cells |
| Entrez ID | Symbol | Replicates | Species | Organ | Tissue | Adj P-value | Log2FC | Malignancy |
| 84934 | RITA1 | LZE4T | Human | Esophagus | ESCC | 1.70e-03 | 1.00e-01 | 0.0811 |
| 84934 | RITA1 | LZE7T | Human | Esophagus | ESCC | 1.62e-04 | 2.18e-01 | 0.0667 |
| 84934 | RITA1 | LZE8T | Human | Esophagus | ESCC | 9.77e-06 | 2.13e-01 | 0.067 |
| 84934 | RITA1 | LZE24T | Human | Esophagus | ESCC | 8.18e-15 | 3.48e-01 | 0.0596 |
| 84934 | RITA1 | P1T-E | Human | Esophagus | ESCC | 7.11e-04 | 1.73e-01 | 0.0875 |
| 84934 | RITA1 | P2T-E | Human | Esophagus | ESCC | 2.78e-38 | 5.98e-01 | 0.1177 |
| 84934 | RITA1 | P4T-E | Human | Esophagus | ESCC | 1.78e-10 | 2.30e-01 | 0.1323 |
| 84934 | RITA1 | P5T-E | Human | Esophagus | ESCC | 7.31e-14 | 2.39e-01 | 0.1327 |
| 84934 | RITA1 | P8T-E | Human | Esophagus | ESCC | 2.86e-20 | 2.84e-01 | 0.0889 |
| 84934 | RITA1 | P9T-E | Human | Esophagus | ESCC | 1.08e-07 | 1.45e-01 | 0.1131 |
| 84934 | RITA1 | P10T-E | Human | Esophagus | ESCC | 3.60e-13 | 2.07e-01 | 0.116 |
| 84934 | RITA1 | P11T-E | Human | Esophagus | ESCC | 6.27e-12 | 4.35e-01 | 0.1426 |
| 84934 | RITA1 | P12T-E | Human | Esophagus | ESCC | 2.93e-15 | 2.12e-01 | 0.1122 |
| 84934 | RITA1 | P15T-E | Human | Esophagus | ESCC | 1.55e-17 | 3.10e-01 | 0.1149 |
| 84934 | RITA1 | P16T-E | Human | Esophagus | ESCC | 7.52e-23 | 3.42e-01 | 0.1153 |
| 84934 | RITA1 | P17T-E | Human | Esophagus | ESCC | 8.50e-05 | 1.76e-01 | 0.1278 |
| 84934 | RITA1 | P19T-E | Human | Esophagus | ESCC | 2.95e-08 | 4.88e-01 | 0.1662 |
| 84934 | RITA1 | P20T-E | Human | Esophagus | ESCC | 8.21e-21 | 4.02e-01 | 0.1124 |
| 84934 | RITA1 | P21T-E | Human | Esophagus | ESCC | 1.47e-35 | 6.19e-01 | 0.1617 |
| 84934 | RITA1 | P22T-E | Human | Esophagus | ESCC | 5.17e-27 | 3.93e-01 | 0.1236 |
| Page: 1 2 3 4 5 |
| Tissue | Expression Dynamics | Abbreviation |
| Esophagus | 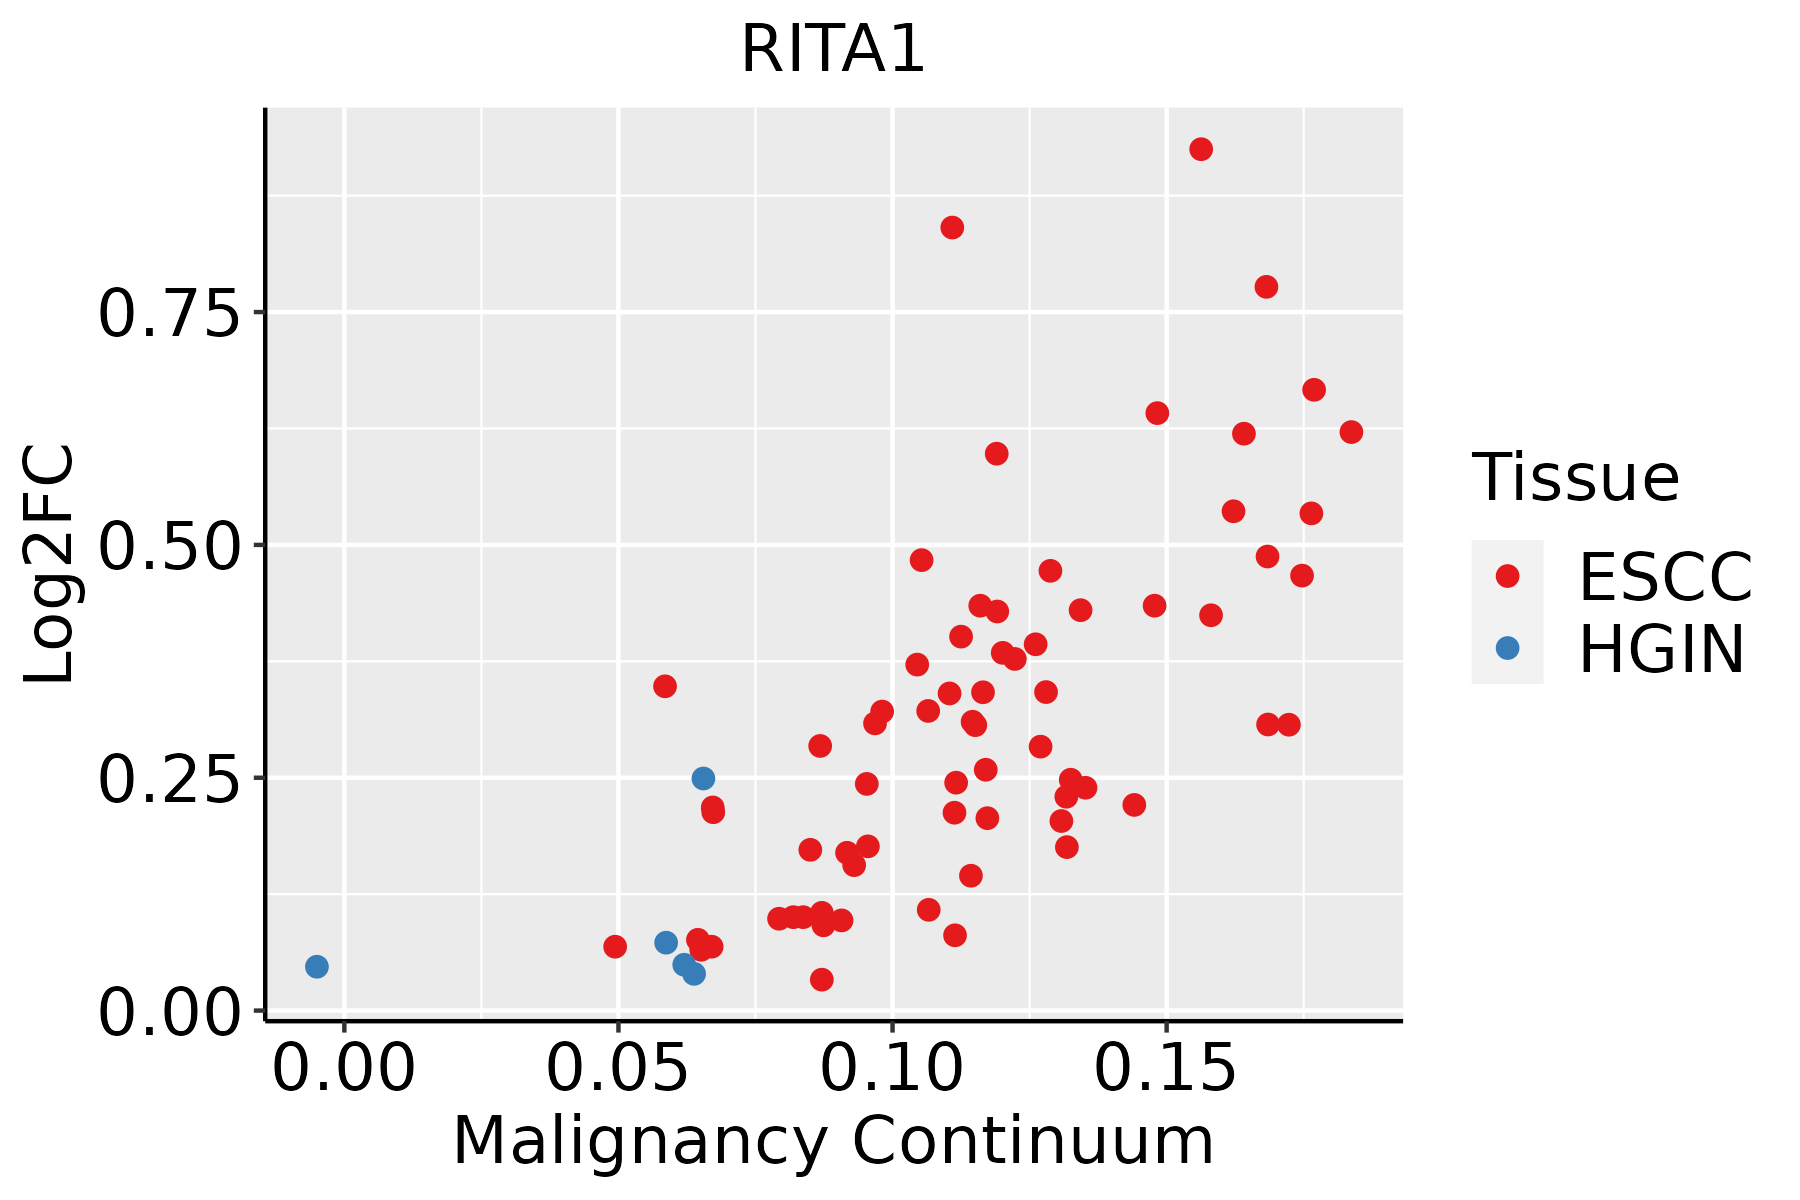 | ESCC: Esophageal squamous cell carcinoma |
| HGIN: High-grade intraepithelial neoplasias | ||
| LGIN: Low-grade intraepithelial neoplasias | ||
| Liver |  | HCC: Hepatocellular carcinoma |
| NAFLD: Non-alcoholic fatty liver disease | ||
| Oral Cavity | 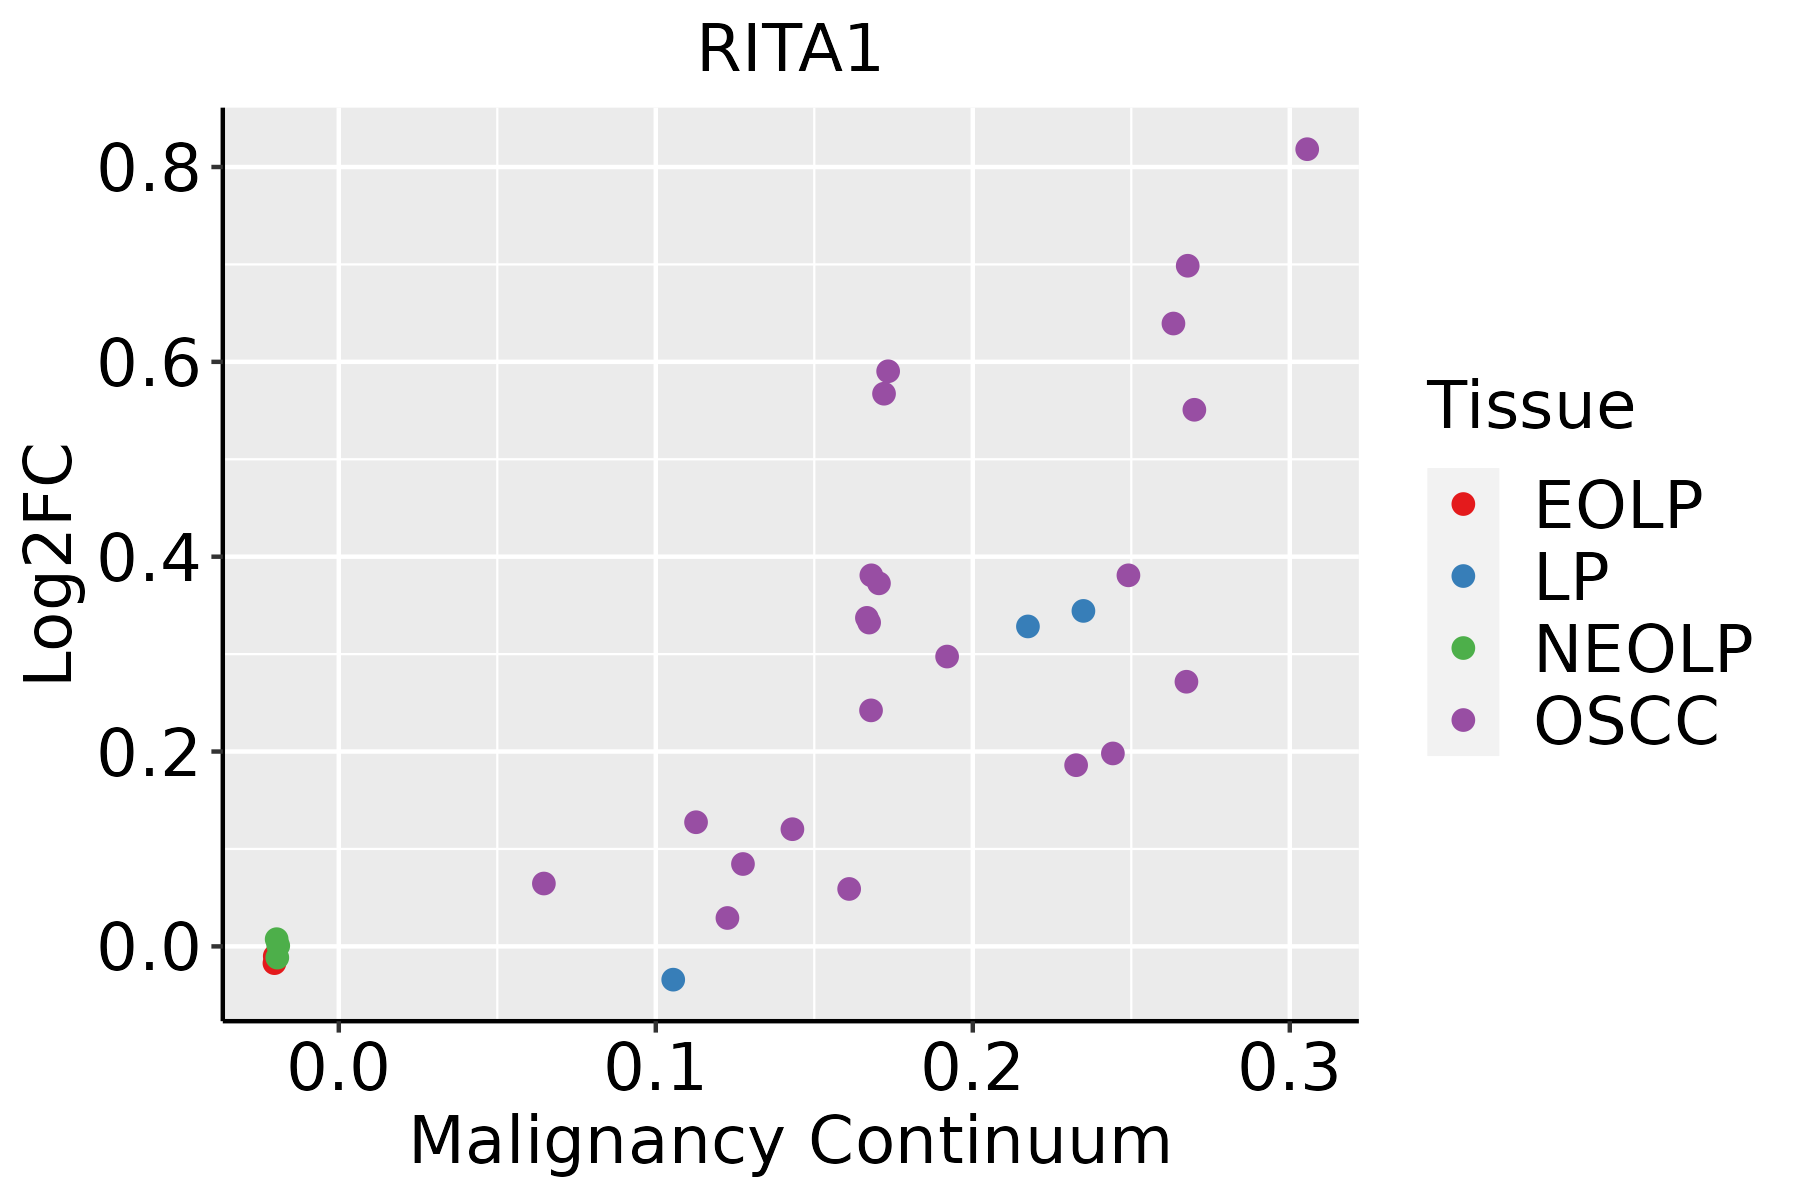 | EOLP: Erosive Oral lichen planus |
| LP: leukoplakia | ||
| NEOLP: Non-erosive oral lichen planus | ||
| OSCC: Oral squamous cell carcinoma | ||
| Skin | 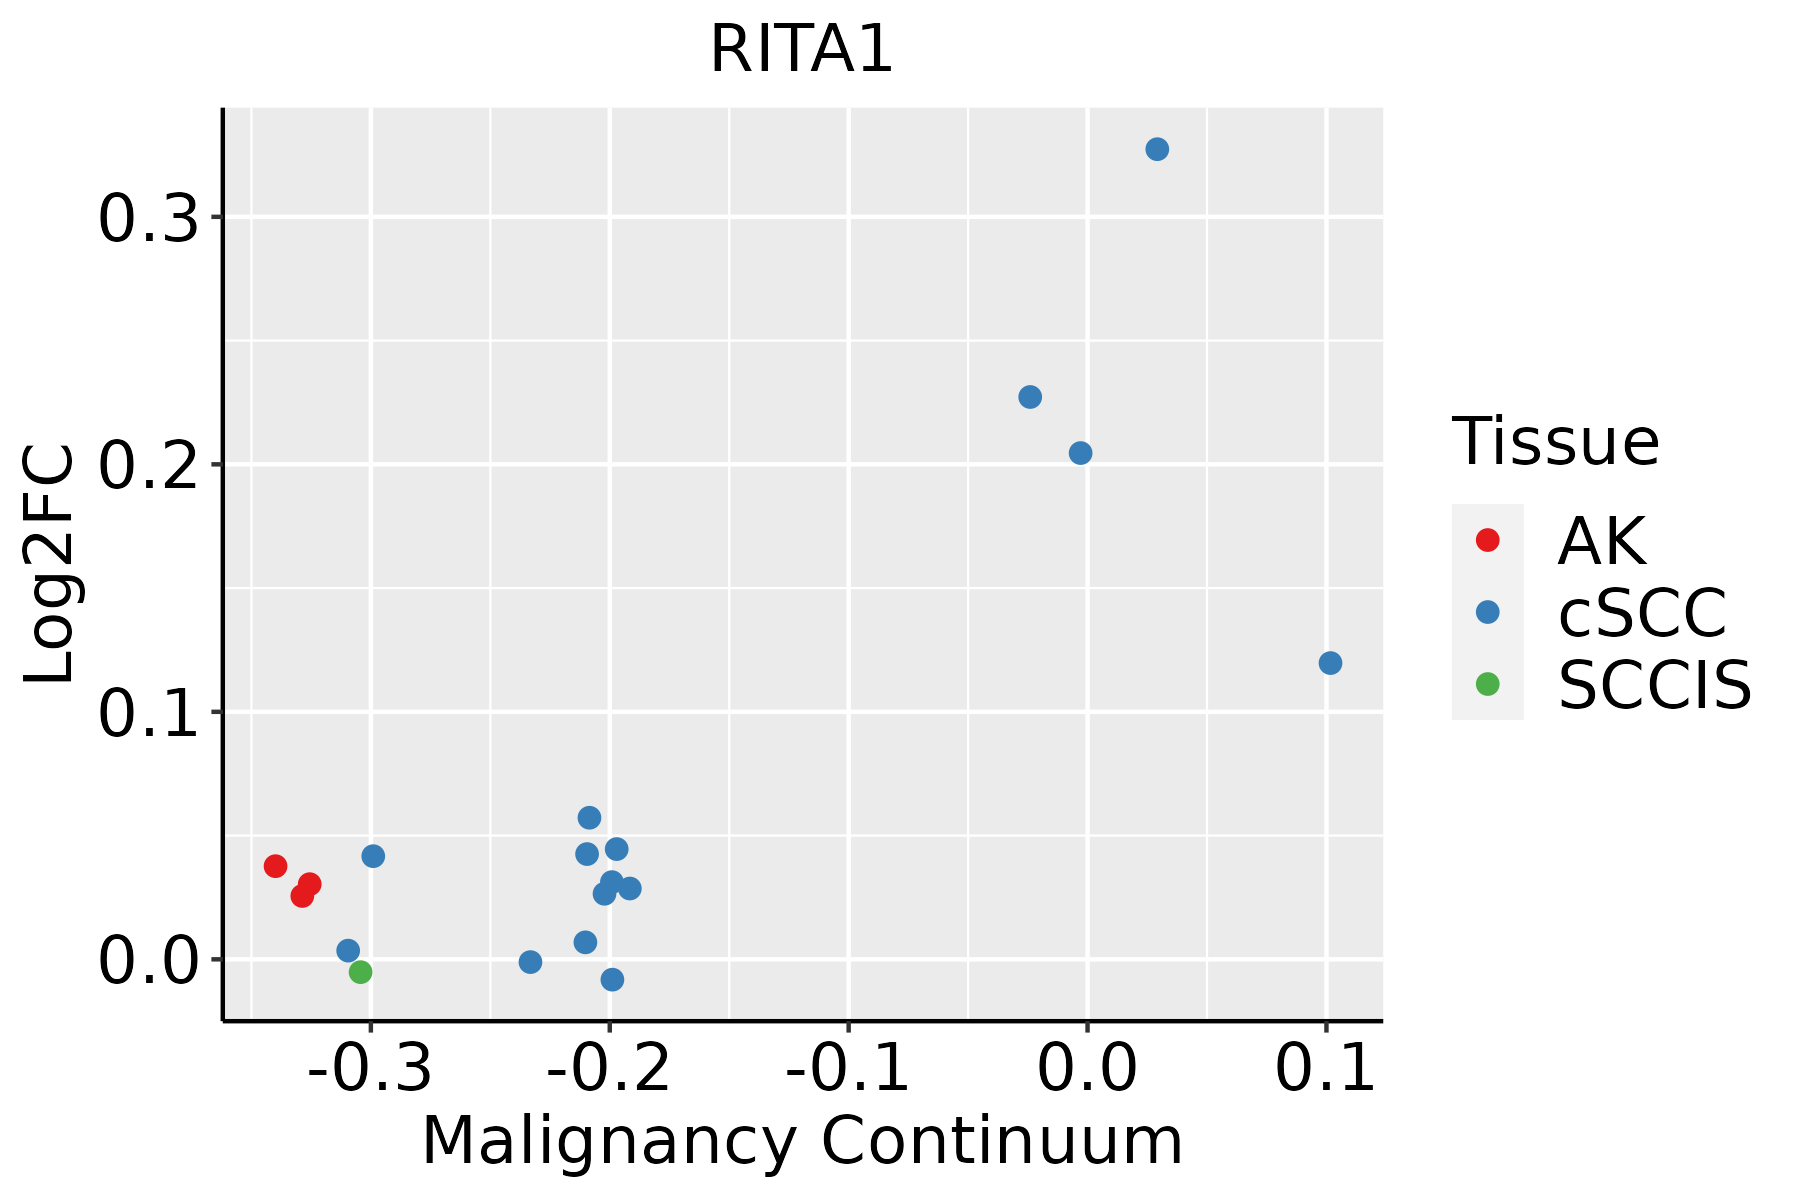 | AK: Actinic keratosis |
| cSCC: Cutaneous squamous cell carcinoma | ||
| SCCIS:squamous cell carcinoma in situ | ||
| Thyroid | 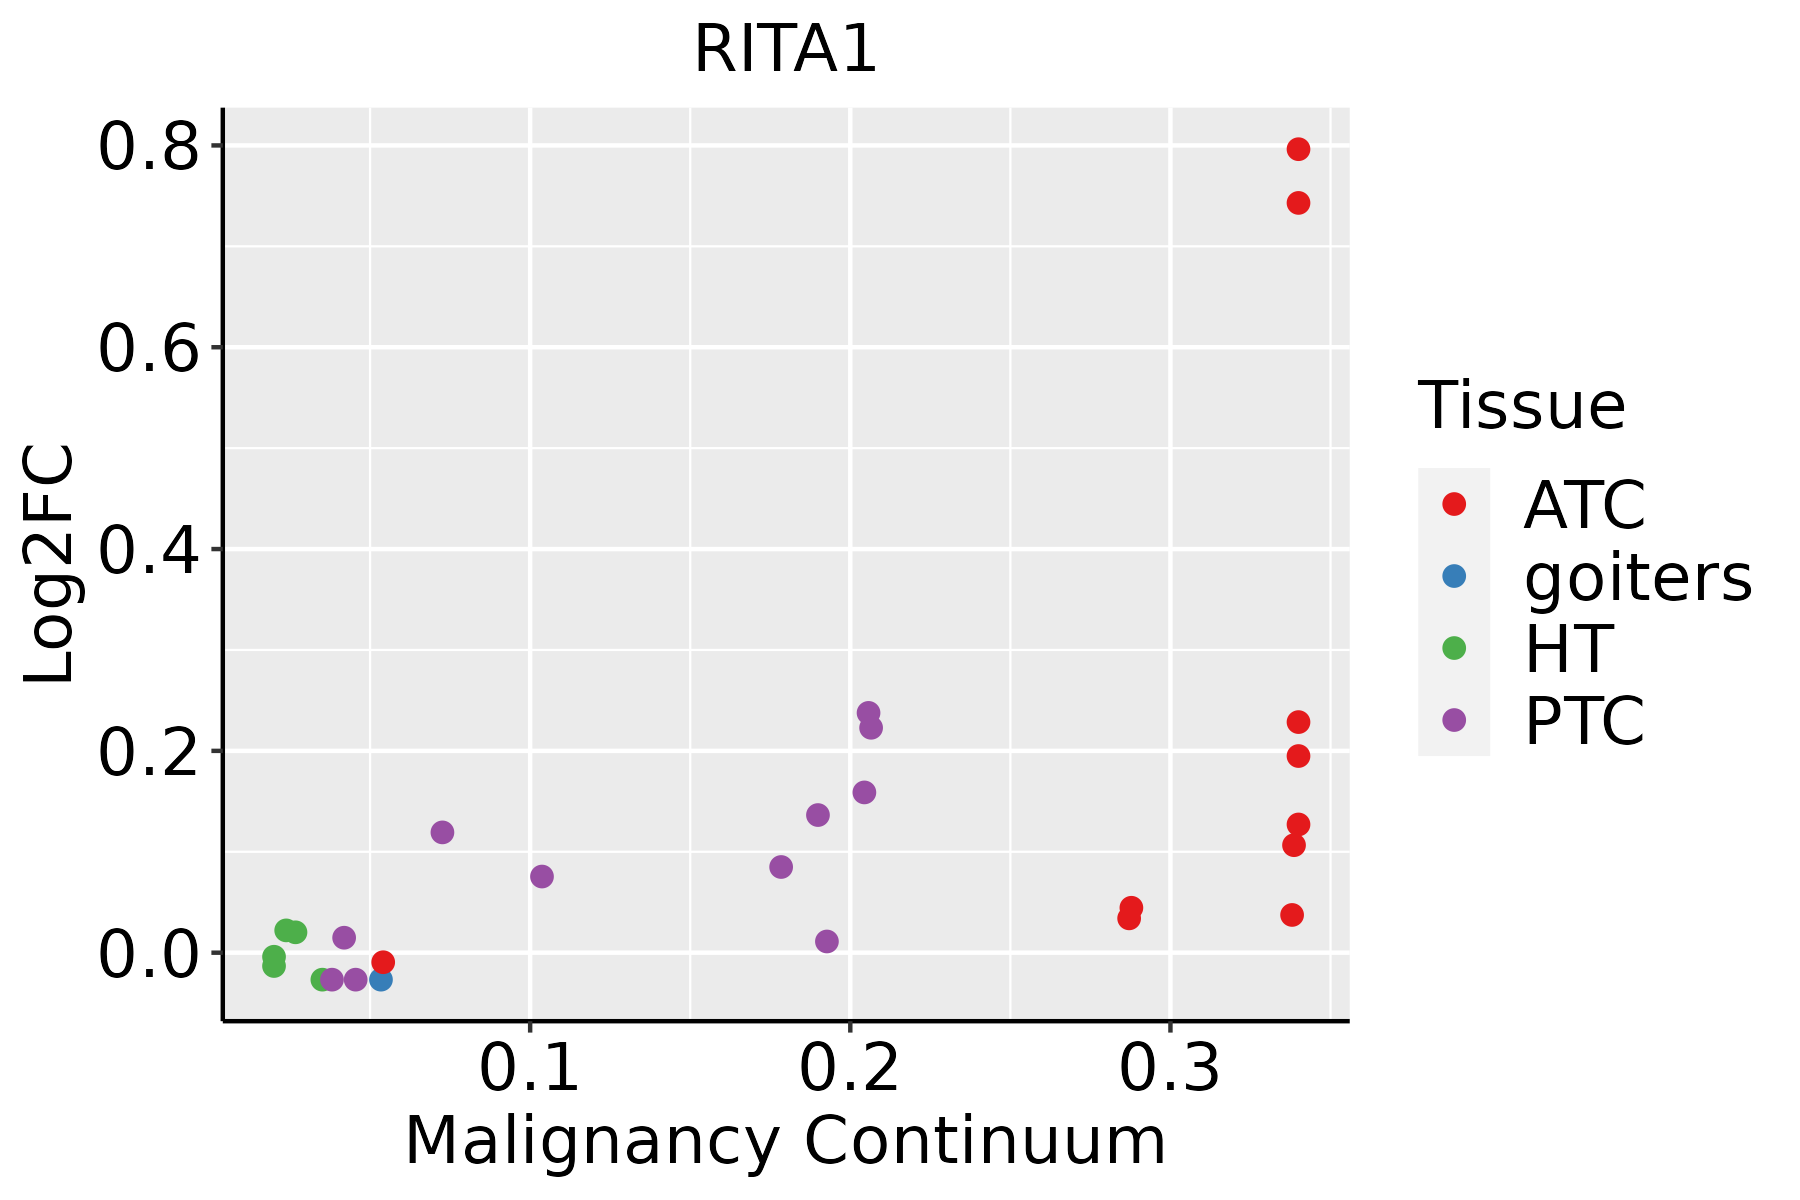 | ATC: Anaplastic thyroid cancer |
| HT: Hashimoto's thyroiditis | ||
| PTC: Papillary thyroid cancer |
| ∗log2FC in expression of this searched gene in stem-like cells from each diseased tissue sample relative to stem-like cells in normal samples in each tissue plotted against the malignancy continuum. Samples are colored based on if they are from different disease stage. |
Top |
Malignant transformation related pathway analysis |
| Find out the enriched GO biological processes and KEGG pathways involved in transition from healthy to precancer to cancer |
| Tissue | Disease Stage | Enriched GO biological Processes |
| Colorectum | AD |  |
| Colorectum | SER |  |
| Colorectum | MSS |  |
| Colorectum | MSI-H |  |
| Colorectum | FAP |  |
| ∗Top 15 enriched GO BP terms are showed in the bar plot of each disease state in each tissue. Each row represents a significant GO biological process which is colored according to the -log10(p.adjust). |
| Page: 1 2 3 4 5 6 7 8 9 |
| GO ID | Tissue | Disease Stage | Description | Gene Ratio | Bg Ratio | pvalue | p.adjust | Count |
| GO:0006913110 | Esophagus | ESCC | nucleocytoplasmic transport | 230/8552 | 301/18723 | 6.04e-28 | 2.02e-25 | 230 |
| GO:0051169110 | Esophagus | ESCC | nuclear transport | 230/8552 | 301/18723 | 6.04e-28 | 2.02e-25 | 230 |
| GO:0051168110 | Esophagus | ESCC | nuclear export | 126/8552 | 154/18723 | 1.88e-20 | 2.65e-18 | 126 |
| GO:00072197 | Esophagus | ESCC | Notch signaling pathway | 106/8552 | 172/18723 | 1.74e-05 | 1.55e-04 | 106 |
| GO:0045746 | Esophagus | ESCC | negative regulation of Notch signaling pathway | 28/8552 | 36/18723 | 8.62e-05 | 6.22e-04 | 28 |
| GO:00085935 | Esophagus | ESCC | regulation of Notch signaling pathway | 59/8552 | 95/18723 | 9.12e-04 | 4.65e-03 | 59 |
| GO:000691312 | Liver | Cirrhotic | nucleocytoplasmic transport | 118/4634 | 301/18723 | 1.71e-08 | 6.27e-07 | 118 |
| GO:005116912 | Liver | Cirrhotic | nuclear transport | 118/4634 | 301/18723 | 1.71e-08 | 6.27e-07 | 118 |
| GO:005116812 | Liver | Cirrhotic | nuclear export | 67/4634 | 154/18723 | 2.57e-07 | 6.41e-06 | 67 |
| GO:000691322 | Liver | HCC | nucleocytoplasmic transport | 208/7958 | 301/18723 | 5.51e-21 | 8.12e-19 | 208 |
| GO:005116922 | Liver | HCC | nuclear transport | 208/7958 | 301/18723 | 5.51e-21 | 8.12e-19 | 208 |
| GO:005116822 | Liver | HCC | nuclear export | 113/7958 | 154/18723 | 6.30e-15 | 4.39e-13 | 113 |
| GO:000691317 | Oral cavity | OSCC | nucleocytoplasmic transport | 204/7305 | 301/18723 | 2.65e-24 | 6.98e-22 | 204 |
| GO:005116917 | Oral cavity | OSCC | nuclear transport | 204/7305 | 301/18723 | 2.65e-24 | 6.98e-22 | 204 |
| GO:005116817 | Oral cavity | OSCC | nuclear export | 112/7305 | 154/18723 | 1.70e-17 | 1.56e-15 | 112 |
| GO:00072196 | Oral cavity | OSCC | Notch signaling pathway | 92/7305 | 172/18723 | 7.84e-05 | 6.08e-04 | 92 |
| GO:00085934 | Oral cavity | OSCC | regulation of Notch signaling pathway | 53/7305 | 95/18723 | 6.64e-04 | 3.72e-03 | 53 |
| GO:000691324 | Skin | cSCC | nucleocytoplasmic transport | 162/4864 | 301/18723 | 4.20e-25 | 1.10e-22 | 162 |
| GO:005116924 | Skin | cSCC | nuclear transport | 162/4864 | 301/18723 | 4.20e-25 | 1.10e-22 | 162 |
| GO:0051168111 | Skin | cSCC | nuclear export | 91/4864 | 154/18723 | 3.33e-18 | 4.18e-16 | 91 |
| Page: 1 2 |
| Pathway ID | Tissue | Disease Stage | Description | Gene Ratio | Bg Ratio | pvalue | p.adjust | qvalue | Count |
| Page: 1 |
Top |
Cell-cell communication analysis |
| Identification of potential cell-cell interactions between two cell types and their ligand-receptor pairs for different disease states |
| Ligand | Receptor | LRpair | Pathway | Tissue | Disease Stage |
| Page: 1 |
Top |
Single-cell gene regulatory network inference analysis |
| Find out the significant the regulons (TFs) and the target genes of each regulon across cell types for different disease states |
| TF | Cell Type | Tissue | Disease Stage | Target Gene | RSS | Regulon Activity |
| ∗The dot plots of a searched regulon are shown for all cell subpopulations in each disease state of each tissue based on the regulon specific score inferred using pySCENIC and by calculating the average expression. |
| Page: 1 |
Top |
Somatic mutation of malignant transformation related genes |
| Annotation of somatic variants for genes involved in malignant transformation |
| Hugo Symbol | Variant Class | Variant Classification | dbSNP RS | HGVSc | HGVSp | HGVSp Short | SWISSPROT | BIOTYPE | SIFT | PolyPhen | Tumor Sample Barcode | Tissue | Histology | Sex | Age | Stage | Therapy Types | Drugs | Outcome |
| RITA1 | SNV | Missense_Mutation | rs767217662 | c.268N>A | p.Val90Met | p.V90M | Q96K30 | protein_coding | tolerated(0.09) | benign(0.082) | TCGA-EK-A2RC-01 | Cervix | cervical & endocervical cancer | Female | <65 | I/II | Unknown | Unknown | SD |
| RITA1 | SNV | Missense_Mutation | rs368110690 | c.455G>A | p.Arg152Gln | p.R152Q | Q96K30 | protein_coding | tolerated(0.29) | benign(0.199) | TCGA-AA-3672-01 | Colorectum | colon adenocarcinoma | Female | >=65 | III/IV | Unknown | Unknown | SD |
| RITA1 | SNV | Missense_Mutation | rs773378868 | c.805N>T | p.Arg269Cys | p.R269C | Q96K30 | protein_coding | tolerated(0.27) | benign(0.001) | TCGA-AG-3885-01 | Colorectum | rectum adenocarcinoma | Female | >=65 | III/IV | Ancillary | zoledronic | SD |
| RITA1 | SNV | Missense_Mutation | c.876N>T | p.Trp292Cys | p.W292C | Q96K30 | protein_coding | deleterious(0) | probably_damaging(0.999) | TCGA-AG-A002-01 | Colorectum | rectum adenocarcinoma | Male | <65 | I/II | Unknown | Unknown | SD | |
| RITA1 | SNV | Missense_Mutation | rs76765925 | c.667N>C | p.Ser223Pro | p.S223P | Q96K30 | protein_coding | deleterious(0) | probably_damaging(0.92) | TCGA-EI-6882-01 | Colorectum | rectum adenocarcinoma | Male | <65 | I/II | Unknown | Unknown | SD |
| RITA1 | deletion | Frame_Shift_Del | novel | c.469delG | p.Asp157MetfsTer62 | p.D157Mfs*62 | Q96K30 | protein_coding | TCGA-D5-6530-01 | Colorectum | colon adenocarcinoma | Male | <65 | I/II | Unknown | Unknown | SD | ||
| RITA1 | SNV | Missense_Mutation | rs367637594 | c.209N>A | p.Arg70Gln | p.R70Q | Q96K30 | protein_coding | tolerated(0.17) | benign(0.03) | TCGA-AJ-A3BG-01 | Endometrium | uterine corpus endometrioid carcinoma | Female | >=65 | I/II | Chemotherapy | carboplatin | PD |
| RITA1 | SNV | Missense_Mutation | rs777149039 | c.658N>T | p.Arg220Trp | p.R220W | Q96K30 | protein_coding | deleterious(0.01) | possibly_damaging(0.796) | TCGA-AJ-A3BH-01 | Endometrium | uterine corpus endometrioid carcinoma | Female | Unknown | I/II | Unknown | Unknown | SD |
| RITA1 | SNV | Missense_Mutation | rs538504098 | c.806N>A | p.Arg269His | p.R269H | Q96K30 | protein_coding | tolerated(0.77) | benign(0) | TCGA-AP-A0LM-01 | Endometrium | uterine corpus endometrioid carcinoma | Female | <65 | III/IV | Chemotherapy | cisplatin | SD |
| RITA1 | SNV | Missense_Mutation | novel | c.59N>T | p.Gly20Val | p.G20V | Q96K30 | protein_coding | tolerated_low_confidence(0.34) | benign(0.375) | TCGA-AP-A1DK-01 | Endometrium | uterine corpus endometrioid carcinoma | Female | <65 | I/II | Unknown | Unknown | SD |
| Page: 1 2 3 |
Top |
Related drugs of malignant transformation related genes |
| Identification of chemicals and drugs interact with genes involved in malignant transfromation |
| (DGIdb 4.0) |
| Entrez ID | Symbol | Category | Interaction Types | Drug Claim Name | Drug Name | PMIDs |
| Page: 1 |

Copyright 2023-Present -The University of Texas Health Science Center at Houston |