
|
|||||
|
 | |
| |
| |
| |
| |
| |
|
Gene: RIT1 |
Gene summary for RIT1 |
| Gene information | Species | Human | Gene symbol | RIT1 | Gene ID | 6016 |
| Gene name | Ras like without CAAX 1 | |
| Gene Alias | NS8 | |
| Cytomap | 1q22 | |
| Gene Type | protein-coding | GO ID | GO:0007154 | UniProtAcc | Q92963 |
Top |
Malignant transformation analysis |
| Identification of the aberrant gene expression in precancerous and cancerous lesions by comparing the gene expression of stem-like cells in diseased tissues with normal stem cells |
| Entrez ID | Symbol | Replicates | Species | Organ | Tissue | Adj P-value | Log2FC | Malignancy |
| 6016 | RIT1 | LZE2T | Human | Esophagus | ESCC | 8.53e-06 | 1.06e+00 | 0.082 |
| 6016 | RIT1 | LZE4T | Human | Esophagus | ESCC | 4.70e-31 | 1.04e+00 | 0.0811 |
| 6016 | RIT1 | LZE7T | Human | Esophagus | ESCC | 9.71e-10 | 6.36e-01 | 0.0667 |
| 6016 | RIT1 | LZE20T | Human | Esophagus | ESCC | 3.51e-03 | 2.06e-01 | 0.0662 |
| 6016 | RIT1 | LZE22T | Human | Esophagus | ESCC | 9.75e-07 | 3.65e-01 | 0.068 |
| 6016 | RIT1 | LZE24T | Human | Esophagus | ESCC | 6.92e-11 | 2.61e-01 | 0.0596 |
| 6016 | RIT1 | LZE21T | Human | Esophagus | ESCC | 6.03e-05 | 3.53e-01 | 0.0655 |
| 6016 | RIT1 | LZE6T | Human | Esophagus | ESCC | 1.09e-07 | 2.50e-01 | 0.0845 |
| 6016 | RIT1 | P1T-E | Human | Esophagus | ESCC | 6.61e-03 | 2.55e-01 | 0.0875 |
| 6016 | RIT1 | P2T-E | Human | Esophagus | ESCC | 7.98e-19 | 2.59e-01 | 0.1177 |
| 6016 | RIT1 | P4T-E | Human | Esophagus | ESCC | 7.64e-29 | 6.53e-01 | 0.1323 |
| 6016 | RIT1 | P5T-E | Human | Esophagus | ESCC | 1.26e-17 | 4.04e-01 | 0.1327 |
| 6016 | RIT1 | P8T-E | Human | Esophagus | ESCC | 3.12e-12 | 2.46e-01 | 0.0889 |
| 6016 | RIT1 | P9T-E | Human | Esophagus | ESCC | 1.15e-40 | 8.20e-01 | 0.1131 |
| 6016 | RIT1 | P10T-E | Human | Esophagus | ESCC | 1.70e-16 | 2.67e-01 | 0.116 |
| 6016 | RIT1 | P11T-E | Human | Esophagus | ESCC | 4.48e-15 | 5.77e-01 | 0.1426 |
| 6016 | RIT1 | P12T-E | Human | Esophagus | ESCC | 7.65e-10 | 2.84e-01 | 0.1122 |
| 6016 | RIT1 | P15T-E | Human | Esophagus | ESCC | 1.77e-38 | 8.86e-01 | 0.1149 |
| 6016 | RIT1 | P16T-E | Human | Esophagus | ESCC | 3.41e-11 | 2.29e-01 | 0.1153 |
| 6016 | RIT1 | P17T-E | Human | Esophagus | ESCC | 2.44e-04 | 3.53e-01 | 0.1278 |
| Page: 1 2 3 4 5 |
| Tissue | Expression Dynamics | Abbreviation |
| Esophagus | 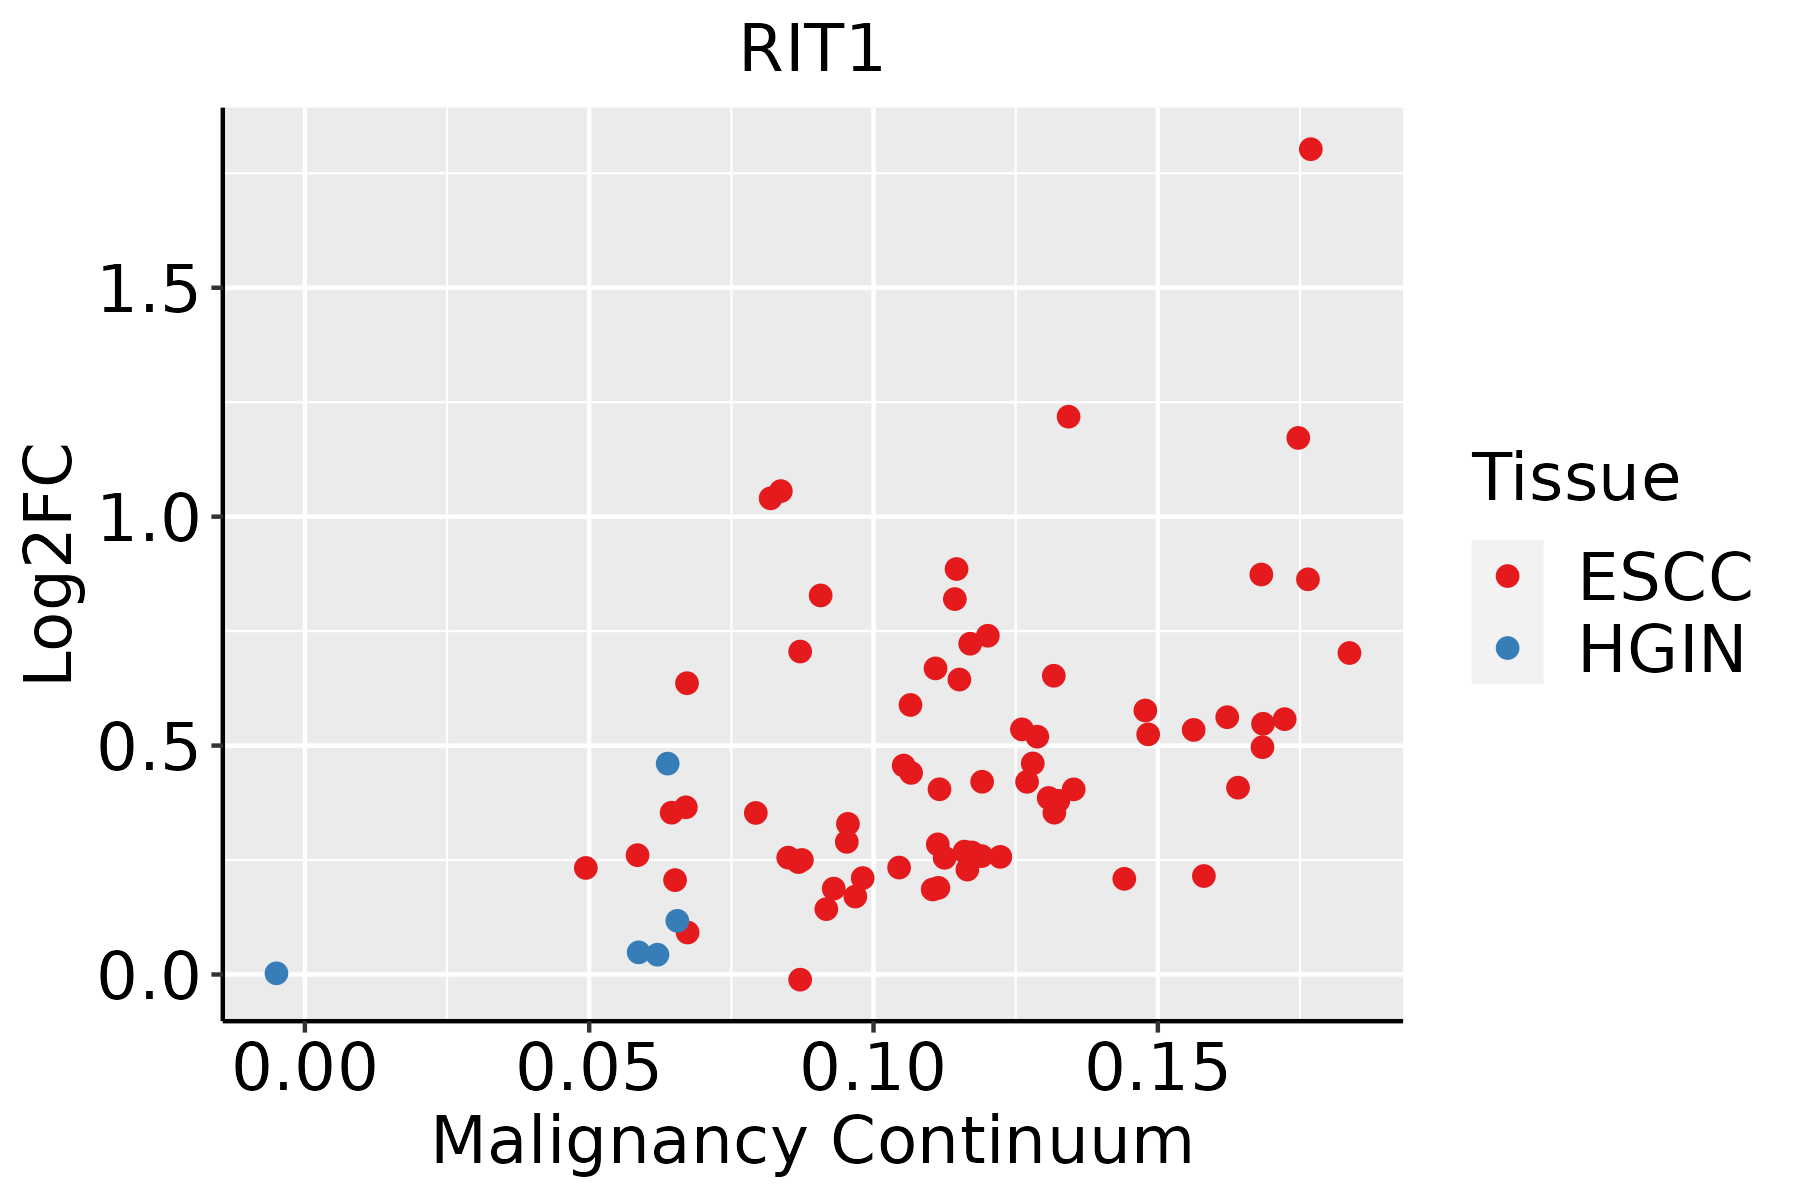 | ESCC: Esophageal squamous cell carcinoma |
| HGIN: High-grade intraepithelial neoplasias | ||
| LGIN: Low-grade intraepithelial neoplasias | ||
| Liver | 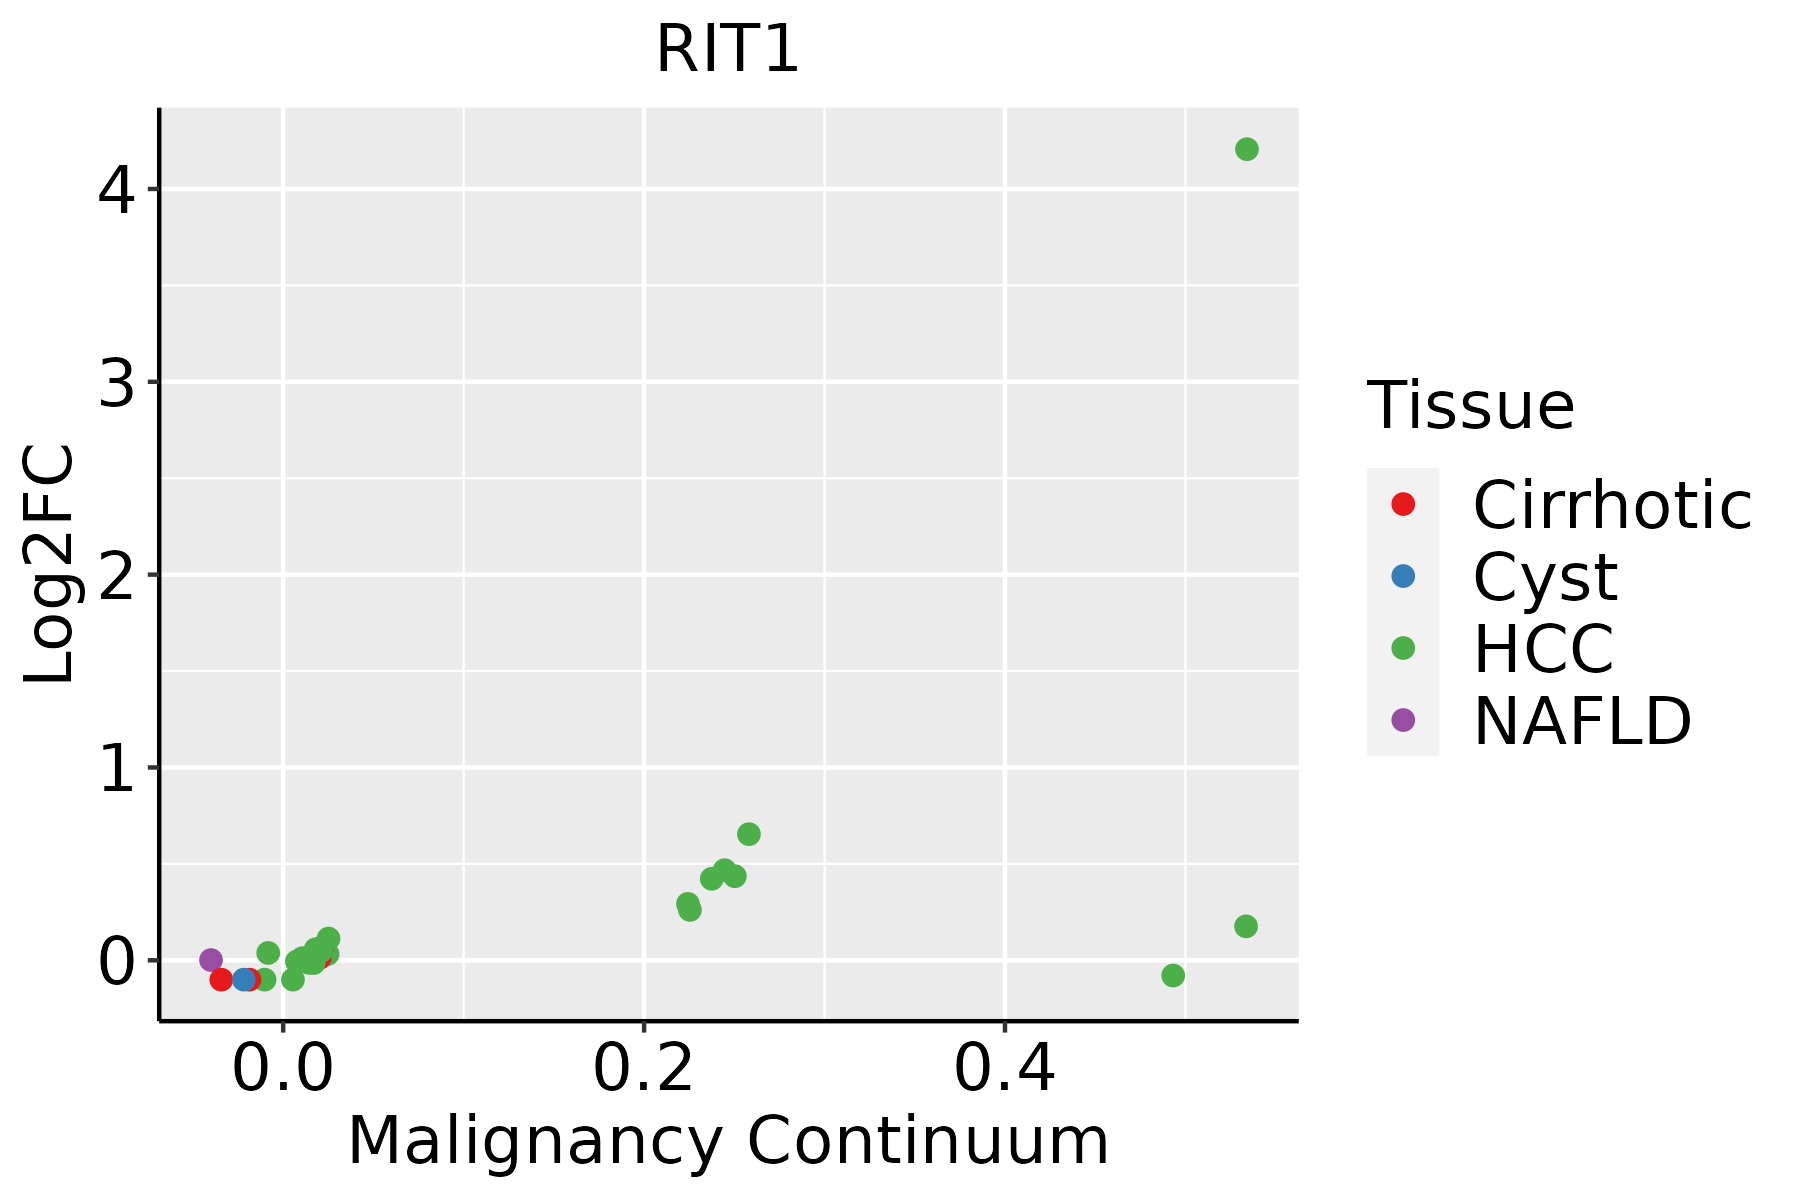 | HCC: Hepatocellular carcinoma |
| NAFLD: Non-alcoholic fatty liver disease | ||
| Oral Cavity | 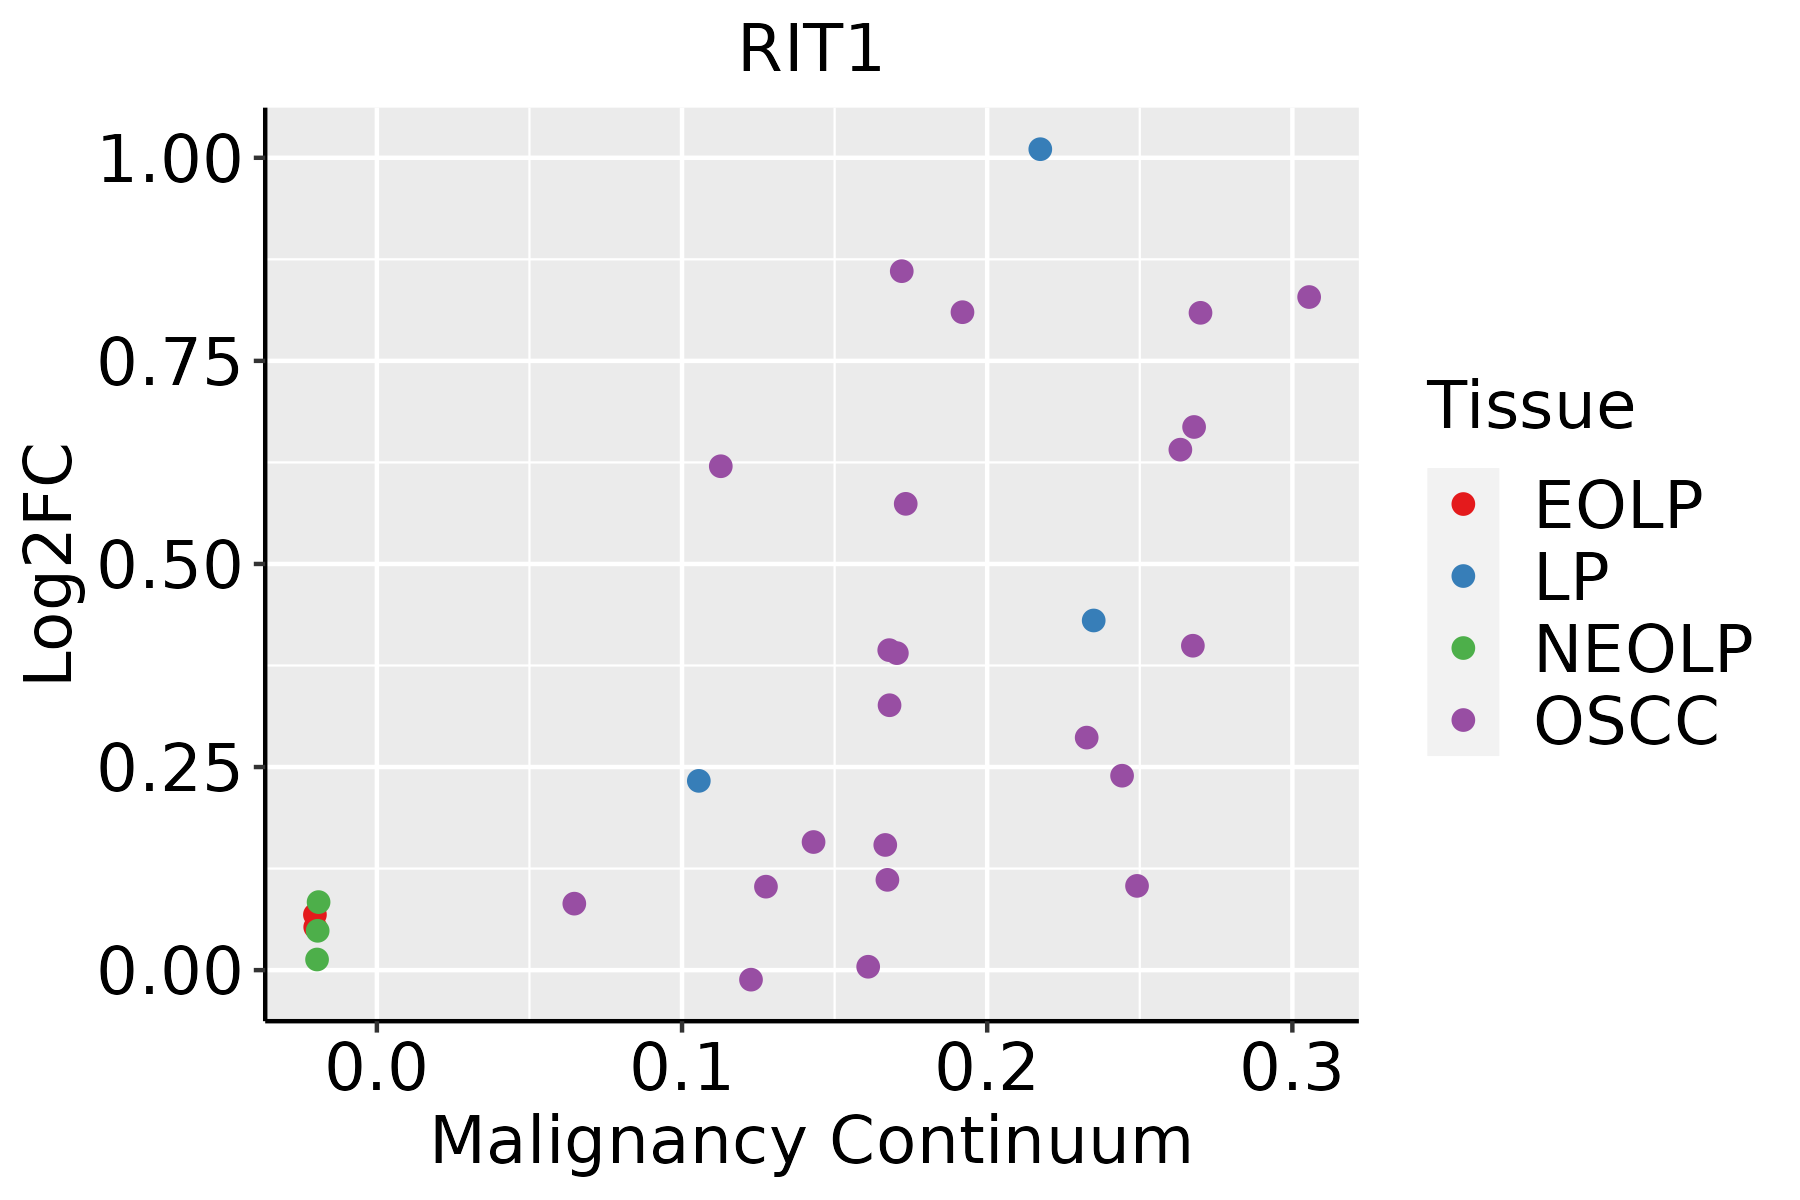 | EOLP: Erosive Oral lichen planus |
| LP: leukoplakia | ||
| NEOLP: Non-erosive oral lichen planus | ||
| OSCC: Oral squamous cell carcinoma |
| ∗log2FC in expression of this searched gene in stem-like cells from each diseased tissue sample relative to stem-like cells in normal samples in each tissue plotted against the malignancy continuum. Samples are colored based on if they are from different disease stage. |
Top |
Malignant transformation related pathway analysis |
| Find out the enriched GO biological processes and KEGG pathways involved in transition from healthy to precancer to cancer |
| Tissue | Disease Stage | Enriched GO biological Processes |
| Colorectum | AD |  |
| Colorectum | SER |  |
| Colorectum | MSS |  |
| Colorectum | MSI-H |  |
| Colorectum | FAP |  |
| ∗Top 15 enriched GO BP terms are showed in the bar plot of each disease state in each tissue. Each row represents a significant GO biological process which is colored according to the -log10(p.adjust). |
| Page: 1 2 3 4 5 6 7 8 9 |
| GO ID | Tissue | Disease Stage | Description | Gene Ratio | Bg Ratio | pvalue | p.adjust | Count |
| GO:003447015 | Esophagus | ESCC | ncRNA processing | 300/8552 | 395/18723 | 3.09e-35 | 3.26e-32 | 300 |
| GO:003466012 | Esophagus | ESCC | ncRNA metabolic process | 346/8552 | 485/18723 | 4.35e-31 | 2.51e-28 | 346 |
| GO:014005313 | Esophagus | ESCC | mitochondrial gene expression | 93/8552 | 108/18723 | 1.96e-18 | 2.03e-16 | 93 |
| GO:00080333 | Esophagus | ESCC | tRNA processing | 92/8552 | 127/18723 | 7.83e-10 | 1.93e-08 | 92 |
| GO:00063992 | Esophagus | ESCC | tRNA metabolic process | 122/8552 | 179/18723 | 9.03e-10 | 2.19e-08 | 122 |
| GO:000716320 | Esophagus | ESCC | establishment or maintenance of cell polarity | 143/8552 | 218/18723 | 2.05e-09 | 4.65e-08 | 143 |
| GO:00094512 | Esophagus | ESCC | RNA modification | 114/8552 | 167/18723 | 2.76e-09 | 6.04e-08 | 114 |
| GO:000726510 | Esophagus | ESCC | Ras protein signal transduction | 201/8552 | 337/18723 | 1.44e-07 | 2.30e-06 | 201 |
| GO:003001018 | Esophagus | ESCC | establishment of cell polarity | 96/8552 | 143/18723 | 1.69e-07 | 2.67e-06 | 96 |
| GO:00009592 | Esophagus | ESCC | mitochondrial RNA metabolic process | 39/8552 | 49/18723 | 1.20e-06 | 1.49e-05 | 39 |
| GO:00009631 | Esophagus | ESCC | mitochondrial RNA processing | 19/8552 | 20/18723 | 3.83e-06 | 4.14e-05 | 19 |
| GO:004545419 | Esophagus | ESCC | cell redox homeostasis | 29/8552 | 35/18723 | 6.61e-06 | 6.75e-05 | 29 |
| GO:00064002 | Esophagus | ESCC | tRNA modification | 62/8552 | 90/18723 | 7.02e-06 | 7.04e-05 | 62 |
| GO:005067318 | Esophagus | ESCC | epithelial cell proliferation | 238/8552 | 437/18723 | 1.19e-04 | 8.20e-04 | 238 |
| GO:005067817 | Esophagus | ESCC | regulation of epithelial cell proliferation | 206/8552 | 381/18723 | 5.51e-04 | 3.02e-03 | 206 |
| GO:000166720 | Esophagus | ESCC | ameboidal-type cell migration | 250/8552 | 475/18723 | 1.22e-03 | 5.97e-03 | 250 |
| GO:0090646 | Esophagus | ESCC | mitochondrial tRNA processing | 11/8552 | 12/18723 | 1.26e-03 | 6.06e-03 | 11 |
| GO:001063120 | Esophagus | ESCC | epithelial cell migration | 187/8552 | 357/18723 | 6.05e-03 | 2.23e-02 | 187 |
| GO:009013220 | Esophagus | ESCC | epithelium migration | 188/8552 | 360/18723 | 6.96e-03 | 2.54e-02 | 188 |
| GO:009013020 | Esophagus | ESCC | tissue migration | 190/8552 | 365/18723 | 7.91e-03 | 2.82e-02 | 190 |
| Page: 1 2 3 4 5 6 7 |
| Pathway ID | Tissue | Disease Stage | Description | Gene Ratio | Bg Ratio | pvalue | p.adjust | qvalue | Count |
| Page: 1 |
Top |
Cell-cell communication analysis |
| Identification of potential cell-cell interactions between two cell types and their ligand-receptor pairs for different disease states |
| Ligand | Receptor | LRpair | Pathway | Tissue | Disease Stage |
| Page: 1 |
Top |
Single-cell gene regulatory network inference analysis |
| Find out the significant the regulons (TFs) and the target genes of each regulon across cell types for different disease states |
| TF | Cell Type | Tissue | Disease Stage | Target Gene | RSS | Regulon Activity |
| ∗The dot plots of a searched regulon are shown for all cell subpopulations in each disease state of each tissue based on the regulon specific score inferred using pySCENIC and by calculating the average expression. |
| Page: 1 |
Top |
Somatic mutation of malignant transformation related genes |
| Annotation of somatic variants for genes involved in malignant transformation |
| Hugo Symbol | Variant Class | Variant Classification | dbSNP RS | HGVSc | HGVSp | HGVSp Short | SWISSPROT | BIOTYPE | SIFT | PolyPhen | Tumor Sample Barcode | Tissue | Histology | Sex | Age | Stage | Therapy Types | Drugs | Outcome |
| RIT1 | SNV | Missense_Mutation | novel | c.661N>G | p.Trp221Gly | p.W221G | Q92963 | protein_coding | tolerated(0.06) | probably_damaging(0.968) | TCGA-E2-A14N-01 | Breast | breast invasive carcinoma | Female | <65 | I/II | Chemotherapy | cyclophosphamide | SD |
| RIT1 | deletion | Frame_Shift_Del | c.305_314delNNNNNNNNNN | p.Met102SerfsTer3 | p.M102Sfs*3 | Q92963 | protein_coding | TCGA-A2-A04T-01 | Breast | breast invasive carcinoma | Female | <65 | I/II | Chemotherapy | cyclophosphamide | SD | |||
| RIT1 | insertion | Frame_Shift_Ins | novel | c.260_261insGGATCTCACTATGTTGCCCAGGCTGATCT | p.Asn87LysfsTer31 | p.N87Kfs*31 | Q92963 | protein_coding | TCGA-AN-A04A-01 | Breast | breast invasive carcinoma | Female | <65 | III/IV | Unknown | Unknown | SD | ||
| RIT1 | SNV | Missense_Mutation | rs483352822 | c.321N>A | p.Met107Ile | p.M107I | Q92963 | protein_coding | tolerated(0.07) | probably_damaging(0.972) | TCGA-C5-A1ML-01 | Cervix | cervical & endocervical cancer | Female | <65 | I/II | Unknown | Unknown | PD |
| RIT1 | SNV | Missense_Mutation | c.153N>C | p.Lys51Asn | p.K51N | Q92963 | protein_coding | deleterious(0) | probably_damaging(1) | TCGA-EK-A3GK-01 | Cervix | cervical & endocervical cancer | Female | <65 | I/II | Unknown | Unknown | SD | |
| RIT1 | SNV | Missense_Mutation | rs777167776 | c.262N>G | p.Leu88Val | p.L88V | Q92963 | protein_coding | deleterious(0.01) | possibly_damaging(0.861) | TCGA-FU-A3HY-01 | Cervix | cervical & endocervical cancer | Female | <65 | I/II | Chemotherapy | cisplatin | CR |
| RIT1 | SNV | Missense_Mutation | c.565N>A | p.Asp189Asn | p.D189N | Q92963 | protein_coding | tolerated(0.1) | probably_damaging(0.999) | TCGA-JX-A3Q0-01 | Cervix | cervical & endocervical cancer | Female | <65 | III/IV | Unknown | Unknown | SD | |
| RIT1 | SNV | Missense_Mutation | novel | c.230T>G | p.Ile77Ser | p.I77S | Q92963 | protein_coding | deleterious(0.03) | benign(0.056) | TCGA-AG-3726-01 | Colorectum | rectum adenocarcinoma | Female | <65 | I/II | Unknown | Unknown | SD |
| RIT1 | SNV | Missense_Mutation | novel | c.697G>T | p.Asp233Tyr | p.D233Y | Q92963 | protein_coding | deleterious_low_confidence(0) | benign(0.367) | TCGA-AG-A002-01 | Colorectum | rectum adenocarcinoma | Male | <65 | I/II | Unknown | Unknown | SD |
| RIT1 | SNV | Missense_Mutation | c.554N>A | p.Arg185His | p.R185H | Q92963 | protein_coding | deleterious(0.01) | benign(0.15) | TCGA-A5-A0G2-01 | Endometrium | uterine corpus endometrioid carcinoma | Female | <65 | III/IV | Unknown | Unknown | SD |
| Page: 1 2 3 4 |
Top |
Related drugs of malignant transformation related genes |
| Identification of chemicals and drugs interact with genes involved in malignant transfromation |
| (DGIdb 4.0) |
| Entrez ID | Symbol | Category | Interaction Types | Drug Claim Name | Drug Name | PMIDs |
| 6016 | RIT1 | CLINICALLY ACTIONABLE | PICTILISIB | PICTILISIB | 24469055 | |
| 6016 | RIT1 | CLINICALLY ACTIONABLE | SELUMETINIB | SELUMETINIB | 24469055 |
| Page: 1 |

Copyright 2023-Present -The University of Texas Health Science Center at Houston |