
|
|||||
|
 | |
| |
| |
| |
| |
| |
|
Gene: RIPPLY3 |
Gene summary for RIPPLY3 |
| Gene information | Species | Human | Gene symbol | RIPPLY3 | Gene ID | 53820 |
| Gene name | ripply transcriptional repressor 3 | |
| Gene Alias | DSCR6 | |
| Cytomap | 21q22.13 | |
| Gene Type | protein-coding | GO ID | GO:0000122 | UniProtAcc | P57055 |
Top |
Malignant transformation analysis |
| Identification of the aberrant gene expression in precancerous and cancerous lesions by comparing the gene expression of stem-like cells in diseased tissues with normal stem cells |
| Entrez ID | Symbol | Replicates | Species | Organ | Tissue | Adj P-value | Log2FC | Malignancy |
| 53820 | RIPPLY3 | HCC1 | Human | Liver | HCC | 5.16e-13 | 9.58e-01 | 0.5336 |
| 53820 | RIPPLY3 | HCC2 | Human | Liver | HCC | 1.13e-31 | 1.63e+00 | 0.5341 |
| 53820 | RIPPLY3 | HCC5 | Human | Liver | HCC | 2.28e-41 | 1.68e+00 | 0.4932 |
| Page: 1 |
| Tissue | Expression Dynamics | Abbreviation |
| Liver | 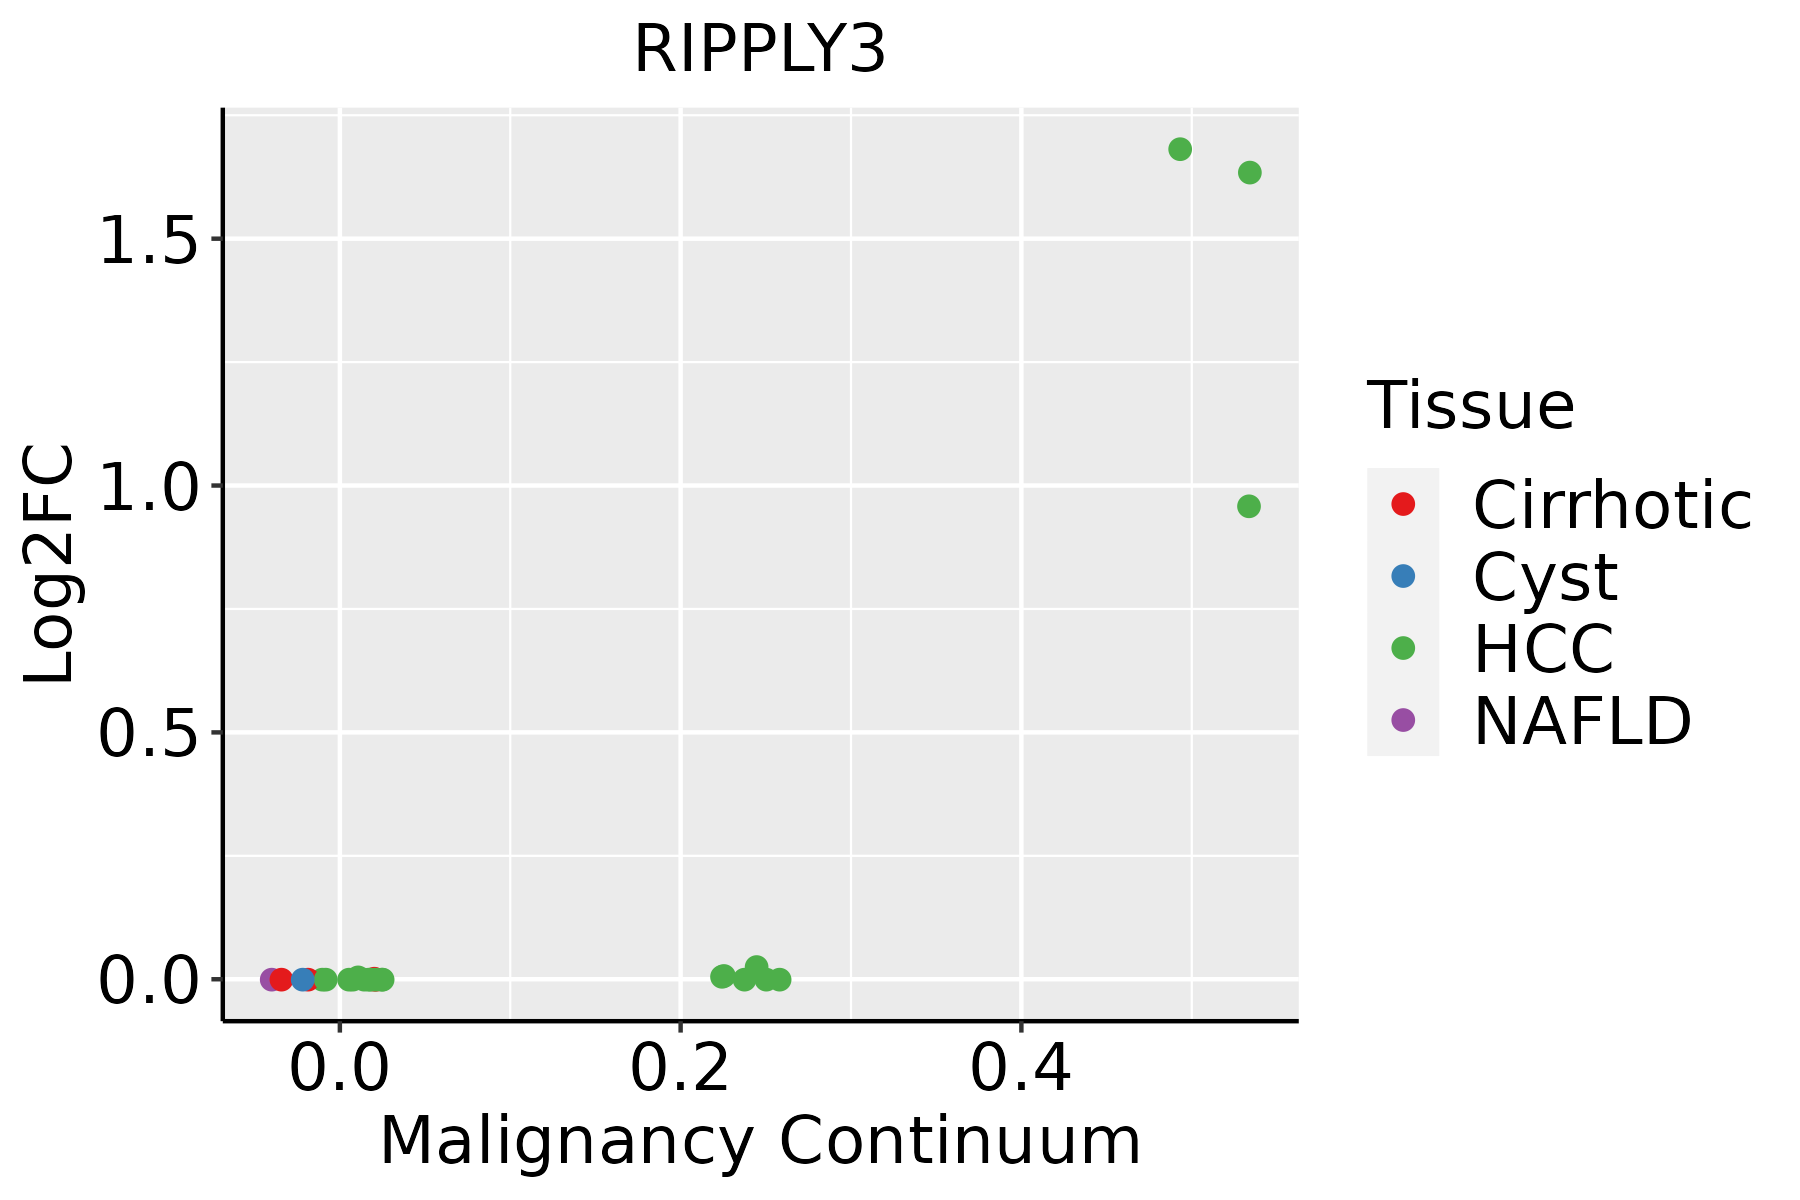 | HCC: Hepatocellular carcinoma |
| NAFLD: Non-alcoholic fatty liver disease |
| ∗log2FC in expression of this searched gene in stem-like cells from each diseased tissue sample relative to stem-like cells in normal samples in each tissue plotted against the malignancy continuum. Samples are colored based on if they are from different disease stage. |
Top |
Malignant transformation related pathway analysis |
| Find out the enriched GO biological processes and KEGG pathways involved in transition from healthy to precancer to cancer |
| Tissue | Disease Stage | Enriched GO biological Processes |
| Colorectum | AD |  |
| Colorectum | SER |  |
| Colorectum | MSS |  |
| Colorectum | MSI-H |  |
| Colorectum | FAP |  |
| ∗Top 15 enriched GO BP terms are showed in the bar plot of each disease state in each tissue. Each row represents a significant GO biological process which is colored according to the -log10(p.adjust). |
| Page: 1 2 3 4 5 6 7 8 9 |
| GO ID | Tissue | Disease Stage | Description | Gene Ratio | Bg Ratio | pvalue | p.adjust | Count |
| Page: 1 |
| Pathway ID | Tissue | Disease Stage | Description | Gene Ratio | Bg Ratio | pvalue | p.adjust | qvalue | Count |
| Page: 1 |
Top |
Cell-cell communication analysis |
| Identification of potential cell-cell interactions between two cell types and their ligand-receptor pairs for different disease states |
| Ligand | Receptor | LRpair | Pathway | Tissue | Disease Stage |
| Page: 1 |
Top |
Single-cell gene regulatory network inference analysis |
| Find out the significant the regulons (TFs) and the target genes of each regulon across cell types for different disease states |
| TF | Cell Type | Tissue | Disease Stage | Target Gene | RSS | Regulon Activity |
| ∗The dot plots of a searched regulon are shown for all cell subpopulations in each disease state of each tissue based on the regulon specific score inferred using pySCENIC and by calculating the average expression. |
| Page: 1 |
Top |
Somatic mutation of malignant transformation related genes |
| Annotation of somatic variants for genes involved in malignant transformation |
| Hugo Symbol | Variant Class | Variant Classification | dbSNP RS | HGVSc | HGVSp | HGVSp Short | SWISSPROT | BIOTYPE | SIFT | PolyPhen | Tumor Sample Barcode | Tissue | Histology | Sex | Age | Stage | Therapy Types | Drugs | Outcome |
| RIPPLY3 | SNV | Missense_Mutation | rs533700142 | c.278G>A | p.Arg93Gln | p.R93Q | P57055 | protein_coding | tolerated(1) | benign(0) | TCGA-B6-A1KN-01 | Breast | breast invasive carcinoma | Female | <65 | III/IV | Unknown | Unknown | SD |
| RIPPLY3 | SNV | Missense_Mutation | c.541N>G | p.Ser181Ala | p.S181A | P57055 | protein_coding | tolerated_low_confidence(1) | benign(0.001) | TCGA-BH-A0EE-01 | Breast | breast invasive carcinoma | Female | >=65 | I/II | Chemotherapy | docetaxel | SD | |
| RIPPLY3 | SNV | Missense_Mutation | c.352G>A | p.Glu118Lys | p.E118K | P57055 | protein_coding | deleterious(0.03) | benign(0.08) | TCGA-JX-A3Q0-01 | Cervix | cervical & endocervical cancer | Female | <65 | III/IV | Unknown | Unknown | SD | |
| RIPPLY3 | SNV | Missense_Mutation | c.142N>C | p.Asp48His | p.D48H | P57055 | protein_coding | deleterious(0.03) | probably_damaging(0.924) | TCGA-Q1-A73O-01 | Cervix | cervical & endocervical cancer | Female | <65 | I/II | Chemotherapy | cisplatin | CR | |
| RIPPLY3 | SNV | Missense_Mutation | novel | c.403C>T | p.Leu135Phe | p.L135F | P57055 | protein_coding | deleterious(0.01) | benign(0.003) | TCGA-VS-A9U7-01 | Cervix | cervical & endocervical cancer | Female | <65 | I/II | Chemotherapy | cisplatin | CR |
| RIPPLY3 | SNV | Missense_Mutation | c.517N>T | p.Gly173Cys | p.G173C | P57055 | protein_coding | deleterious_low_confidence(0) | probably_damaging(0.976) | TCGA-EI-7002-01 | Colorectum | rectum adenocarcinoma | Male | <65 | III/IV | Chemotherapy | irinotecan+5-fluorouracilim | SD | |
| RIPPLY3 | SNV | Missense_Mutation | rs145016016 | c.319N>A | p.Ala107Thr | p.A107T | P57055 | protein_coding | deleterious(0) | probably_damaging(0.999) | TCGA-AX-A05Z-01 | Endometrium | uterine corpus endometrioid carcinoma | Female | <65 | III/IV | Chemotherapy | adriamycin | SD |
| RIPPLY3 | SNV | Missense_Mutation | novel | c.134N>T | p.Thr45Ile | p.T45I | P57055 | protein_coding | deleterious(0) | probably_damaging(0.936) | TCGA-EY-A1GU-01 | Endometrium | uterine corpus endometrioid carcinoma | Female | >=65 | I/II | Unknown | Unknown | SD |
| RIPPLY3 | SNV | Missense_Mutation | c.150N>T | p.Glu50Asp | p.E50D | P57055 | protein_coding | tolerated(0.06) | benign(0.031) | TCGA-35-5375-01 | Lung | lung adenocarcinoma | Male | <65 | III/IV | Unknown | Unknown | SD | |
| RIPPLY3 | SNV | Missense_Mutation | c.212G>A | p.Gly71Glu | p.G71E | P57055 | protein_coding | deleterious(0) | possibly_damaging(0.779) | TCGA-55-6972-01 | Lung | lung adenocarcinoma | Male | >=65 | I/II | Unknown | Unknown | SD |
| Page: 1 2 |
Top |
Related drugs of malignant transformation related genes |
| Identification of chemicals and drugs interact with genes involved in malignant transfromation |
| (DGIdb 4.0) |
| Entrez ID | Symbol | Category | Interaction Types | Drug Claim Name | Drug Name | PMIDs |
| Page: 1 |

Copyright 2023-Present -The University of Texas Health Science Center at Houston |