
|
|||||
|
 | |
| |
| |
| |
| |
| |
|
Gene: RIPK4 |
Gene summary for RIPK4 |
| Gene information | Species | Human | Gene symbol | RIPK4 | Gene ID | 54101 |
| Gene name | receptor interacting serine/threonine kinase 4 | |
| Gene Alias | ANKK2 | |
| Cytomap | 21q22.3 | |
| Gene Type | protein-coding | GO ID | GO:0002009 | UniProtAcc | Q96T11 |
Top |
Malignant transformation analysis |
| Identification of the aberrant gene expression in precancerous and cancerous lesions by comparing the gene expression of stem-like cells in diseased tissues with normal stem cells |
| Entrez ID | Symbol | Replicates | Species | Organ | Tissue | Adj P-value | Log2FC | Malignancy |
| 54101 | RIPK4 | CCI_3 | Human | Cervix | CC | 9.12e-14 | 8.99e-01 | 0.516 |
| 54101 | RIPK4 | sample3 | Human | Cervix | CC | 1.43e-02 | 1.78e-01 | 0.1387 |
| 54101 | RIPK4 | H2 | Human | Cervix | HSIL_HPV | 1.23e-02 | 2.69e-01 | 0.0632 |
| 54101 | RIPK4 | T2 | Human | Cervix | CC | 1.21e-07 | 5.33e-01 | 0.0709 |
| 54101 | RIPK4 | T3 | Human | Cervix | CC | 1.42e-03 | 1.86e-01 | 0.1389 |
| 54101 | RIPK4 | LZE5T | Human | Esophagus | ESCC | 3.93e-02 | 6.21e-02 | 0.0514 |
| 54101 | RIPK4 | LZE8T | Human | Esophagus | ESCC | 1.01e-11 | 3.47e-01 | 0.067 |
| 54101 | RIPK4 | LZE20T | Human | Esophagus | ESCC | 7.45e-03 | 1.11e-01 | 0.0662 |
| 54101 | RIPK4 | LZE24T | Human | Esophagus | ESCC | 4.48e-03 | 1.51e-01 | 0.0596 |
| 54101 | RIPK4 | LZE21T | Human | Esophagus | ESCC | 3.02e-03 | 2.48e-01 | 0.0655 |
| 54101 | RIPK4 | P1T-E | Human | Esophagus | ESCC | 7.44e-12 | 8.29e-01 | 0.0875 |
| 54101 | RIPK4 | P2T-E | Human | Esophagus | ESCC | 6.49e-13 | 2.55e-01 | 0.1177 |
| 54101 | RIPK4 | P4T-E | Human | Esophagus | ESCC | 4.56e-17 | 3.63e-01 | 0.1323 |
| 54101 | RIPK4 | P5T-E | Human | Esophagus | ESCC | 2.31e-14 | 1.60e-01 | 0.1327 |
| 54101 | RIPK4 | P8T-E | Human | Esophagus | ESCC | 1.43e-21 | 3.75e-01 | 0.0889 |
| 54101 | RIPK4 | P9T-E | Human | Esophagus | ESCC | 3.53e-04 | 7.38e-02 | 0.1131 |
| 54101 | RIPK4 | P10T-E | Human | Esophagus | ESCC | 1.01e-24 | 2.29e-01 | 0.116 |
| 54101 | RIPK4 | P11T-E | Human | Esophagus | ESCC | 3.32e-20 | 1.57e+00 | 0.1426 |
| 54101 | RIPK4 | P12T-E | Human | Esophagus | ESCC | 1.41e-29 | 6.20e-01 | 0.1122 |
| 54101 | RIPK4 | P15T-E | Human | Esophagus | ESCC | 2.06e-13 | 1.08e-01 | 0.1149 |
| Page: 1 2 3 4 |
| Tissue | Expression Dynamics | Abbreviation |
| Cervix | 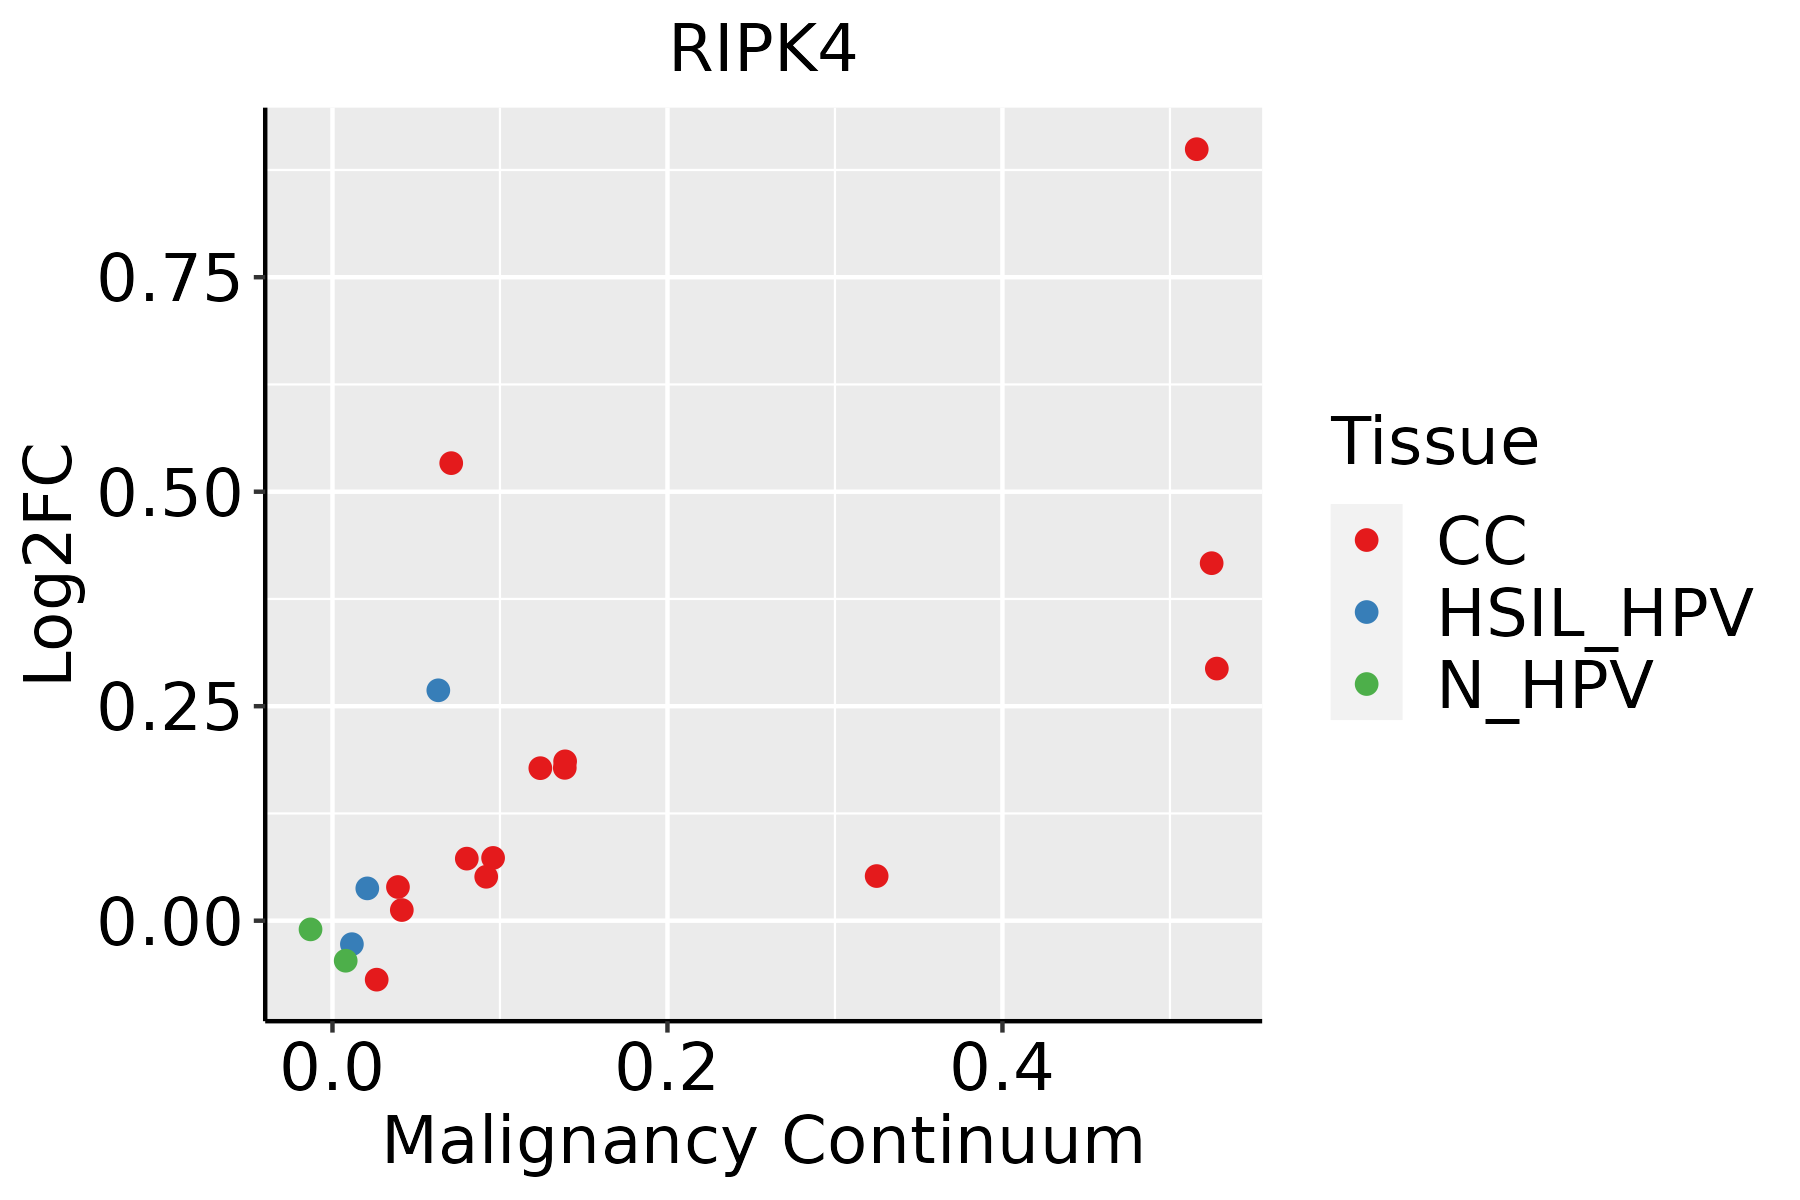 | CC: Cervix cancer |
| HSIL_HPV: HPV-infected high-grade squamous intraepithelial lesions | ||
| N_HPV: HPV-infected normal cervix | ||
| Esophagus | 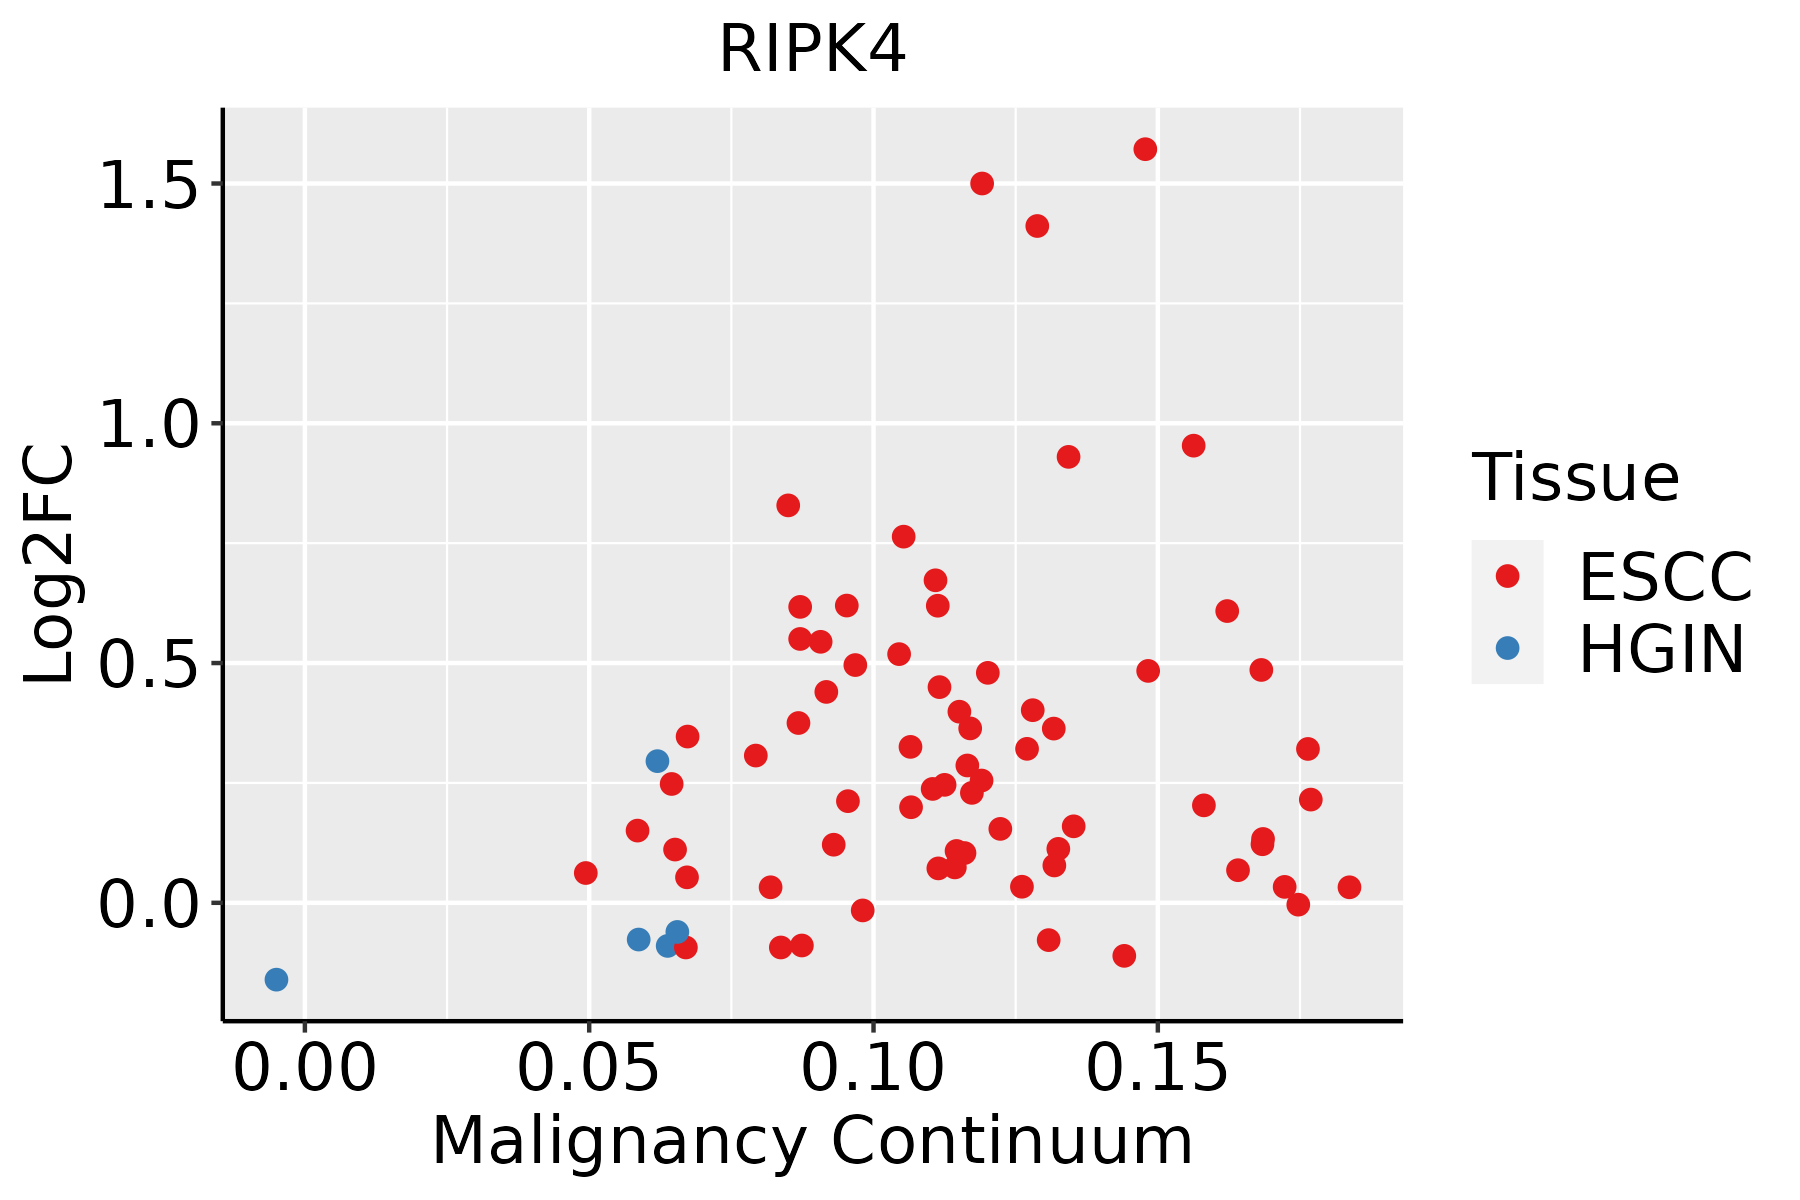 | ESCC: Esophageal squamous cell carcinoma |
| HGIN: High-grade intraepithelial neoplasias | ||
| LGIN: Low-grade intraepithelial neoplasias | ||
| Oral Cavity | 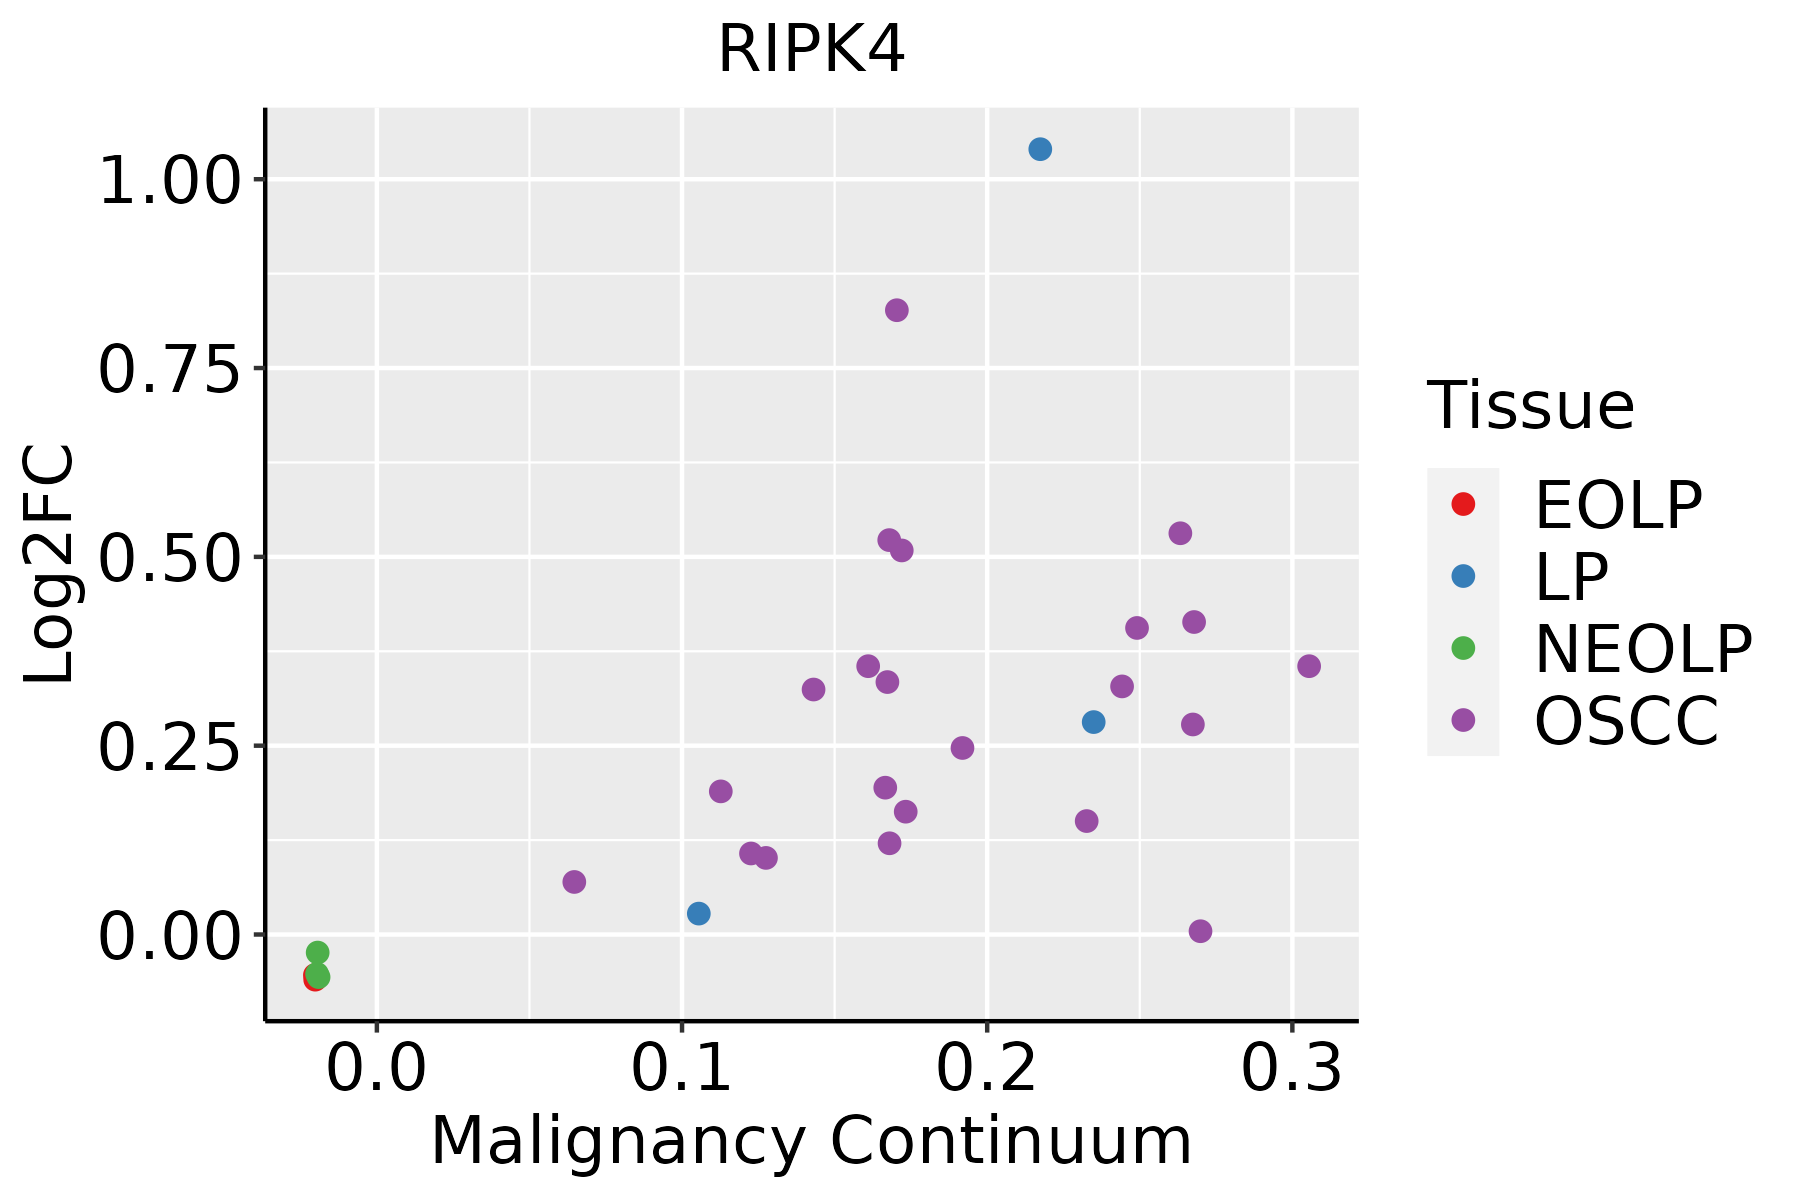 | EOLP: Erosive Oral lichen planus |
| LP: leukoplakia | ||
| NEOLP: Non-erosive oral lichen planus | ||
| OSCC: Oral squamous cell carcinoma |
| ∗log2FC in expression of this searched gene in stem-like cells from each diseased tissue sample relative to stem-like cells in normal samples in each tissue plotted against the malignancy continuum. Samples are colored based on if they are from different disease stage. |
Top |
Malignant transformation related pathway analysis |
| Find out the enriched GO biological processes and KEGG pathways involved in transition from healthy to precancer to cancer |
| Tissue | Disease Stage | Enriched GO biological Processes |
| Colorectum | AD |  |
| Colorectum | SER |  |
| Colorectum | MSS |  |
| Colorectum | MSI-H |  |
| Colorectum | FAP |  |
| ∗Top 15 enriched GO BP terms are showed in the bar plot of each disease state in each tissue. Each row represents a significant GO biological process which is colored according to the -log10(p.adjust). |
| Page: 1 2 3 4 5 6 7 8 9 |
| GO ID | Tissue | Disease Stage | Description | Gene Ratio | Bg Ratio | pvalue | p.adjust | Count |
| GO:00510904 | Cervix | CC | regulation of DNA-binding transcription factor activity | 87/2311 | 440/18723 | 4.85e-06 | 1.22e-04 | 87 |
| GO:00510915 | Cervix | CC | positive regulation of DNA-binding transcription factor activity | 51/2311 | 260/18723 | 5.05e-04 | 4.92e-03 | 51 |
| GO:00510923 | Cervix | CC | positive regulation of NF-kappaB transcription factor activity | 32/2311 | 152/18723 | 1.62e-03 | 1.25e-02 | 32 |
| GO:005109211 | Cervix | HSIL_HPV | positive regulation of NF-kappaB transcription factor activity | 20/737 | 152/18723 | 2.25e-06 | 9.41e-05 | 20 |
| GO:005109012 | Cervix | HSIL_HPV | regulation of DNA-binding transcription factor activity | 35/737 | 440/18723 | 6.77e-05 | 1.58e-03 | 35 |
| GO:005109112 | Cervix | HSIL_HPV | positive regulation of DNA-binding transcription factor activity | 24/737 | 260/18723 | 1.01e-04 | 2.16e-03 | 24 |
| GO:00510908 | Esophagus | ESCC | regulation of DNA-binding transcription factor activity | 252/8552 | 440/18723 | 5.22e-07 | 6.97e-06 | 252 |
| GO:00510918 | Esophagus | ESCC | positive regulation of DNA-binding transcription factor activity | 155/8552 | 260/18723 | 3.83e-06 | 4.14e-05 | 155 |
| GO:00510926 | Esophagus | ESCC | positive regulation of NF-kappaB transcription factor activity | 91/8552 | 152/18723 | 2.91e-04 | 1.75e-03 | 91 |
| GO:00510907 | Oral cavity | OSCC | regulation of DNA-binding transcription factor activity | 221/7305 | 440/18723 | 9.06e-07 | 1.23e-05 | 221 |
| GO:00510917 | Oral cavity | OSCC | positive regulation of DNA-binding transcription factor activity | 134/7305 | 260/18723 | 2.52e-05 | 2.35e-04 | 134 |
| GO:00510925 | Oral cavity | OSCC | positive regulation of NF-kappaB transcription factor activity | 82/7305 | 152/18723 | 1.28e-04 | 9.13e-04 | 82 |
| GO:005109213 | Oral cavity | LP | positive regulation of NF-kappaB transcription factor activity | 61/4623 | 152/18723 | 1.82e-05 | 3.11e-04 | 61 |
| GO:005109015 | Oral cavity | LP | regulation of DNA-binding transcription factor activity | 147/4623 | 440/18723 | 2.00e-05 | 3.35e-04 | 147 |
| GO:005109114 | Oral cavity | LP | positive regulation of DNA-binding transcription factor activity | 86/4623 | 260/18723 | 1.35e-03 | 1.08e-02 | 86 |
| Page: 1 |
| Pathway ID | Tissue | Disease Stage | Description | Gene Ratio | Bg Ratio | pvalue | p.adjust | qvalue | Count |
| Page: 1 |
Top |
Cell-cell communication analysis |
| Identification of potential cell-cell interactions between two cell types and their ligand-receptor pairs for different disease states |
| Ligand | Receptor | LRpair | Pathway | Tissue | Disease Stage |
| Page: 1 |
Top |
Single-cell gene regulatory network inference analysis |
| Find out the significant the regulons (TFs) and the target genes of each regulon across cell types for different disease states |
| TF | Cell Type | Tissue | Disease Stage | Target Gene | RSS | Regulon Activity |
| ∗The dot plots of a searched regulon are shown for all cell subpopulations in each disease state of each tissue based on the regulon specific score inferred using pySCENIC and by calculating the average expression. |
| Page: 1 |
Top |
Somatic mutation of malignant transformation related genes |
| Annotation of somatic variants for genes involved in malignant transformation |
| Hugo Symbol | Variant Class | Variant Classification | dbSNP RS | HGVSc | HGVSp | HGVSp Short | SWISSPROT | BIOTYPE | SIFT | PolyPhen | Tumor Sample Barcode | Tissue | Histology | Sex | Age | Stage | Therapy Types | Drugs | Outcome |
| RIPK4 | SNV | Missense_Mutation | rs144880660 | c.2237N>A | p.Arg746Gln | p.R746Q | P57078 | protein_coding | tolerated(0.38) | benign(0.057) | TCGA-B6-A409-01 | Breast | breast invasive carcinoma | Female | <65 | III/IV | Chemotherapy | cyclophosphamide | PD |
| RIPK4 | SNV | Missense_Mutation | c.65N>A | p.Phe22Tyr | p.F22Y | P57078 | protein_coding | deleterious(0.01) | probably_damaging(0.979) | TCGA-E2-A15P-01 | Breast | breast invasive carcinoma | Female | <65 | I/II | Hormone Therapy | arimidex | SD | |
| RIPK4 | insertion | Nonsense_Mutation | novel | c.1421_1422insTTGCCTGTCTTGAAATAGTGATAATTTAACA | p.Leu475CysfsTer4 | p.L475Cfs*4 | P57078 | protein_coding | TCGA-BH-A0BA-01 | Breast | breast invasive carcinoma | Female | <65 | III/IV | Chemotherapy | cytoxan | SD | ||
| RIPK4 | SNV | Missense_Mutation | c.665N>T | p.Pro222Leu | p.P222L | P57078 | protein_coding | deleterious(0) | probably_damaging(0.999) | TCGA-2W-A8YY-01 | Cervix | cervical & endocervical cancer | Female | <65 | I/II | Chemotherapy | cisplatin | CR | |
| RIPK4 | SNV | Missense_Mutation | c.613N>A | p.Asp205Asn | p.D205N | P57078 | protein_coding | deleterious(0) | probably_damaging(0.996) | TCGA-LP-A4AV-01 | Cervix | cervical & endocervical cancer | Female | <65 | I/II | Unknown | Unknown | SD | |
| RIPK4 | insertion | Frame_Shift_Ins | novel | c.1186_1187insTGAGCGGGAACCTT | p.Ser396LeufsTer32 | p.S396Lfs*32 | P57078 | protein_coding | TCGA-EK-A2RO-01 | Cervix | cervical & endocervical cancer | Female | <65 | I/II | Unknown | Unknown | SD | ||
| RIPK4 | SNV | Missense_Mutation | rs369156558 | c.2212N>A | p.Ala738Thr | p.A738T | P57078 | protein_coding | deleterious(0.02) | probably_damaging(0.996) | TCGA-A6-2686-01 | Colorectum | colon adenocarcinoma | Female | >=65 | I/II | Unknown | Unknown | SD |
| RIPK4 | SNV | Missense_Mutation | c.1562N>A | p.Arg521Gln | p.R521Q | P57078 | protein_coding | deleterious(0.02) | benign(0.396) | TCGA-AA-3710-01 | Colorectum | colon adenocarcinoma | Female | >=65 | I/II | Unknown | Unknown | SD | |
| RIPK4 | SNV | Missense_Mutation | novel | c.1406N>A | p.Arg469His | p.R469H | P57078 | protein_coding | tolerated(0.09) | possibly_damaging(0.46) | TCGA-AA-3845-01 | Colorectum | colon adenocarcinoma | Female | >=65 | I/II | Unknown | Unknown | PD |
| RIPK4 | SNV | Missense_Mutation | rs144179743 | c.812G>A | p.Arg271Gln | p.R271Q | P57078 | protein_coding | tolerated(0.17) | benign(0) | TCGA-AA-3947-01 | Colorectum | colon adenocarcinoma | Female | <65 | I/II | Unknown | Unknown | SD |
| Page: 1 2 3 4 5 6 7 8 |
Top |
Related drugs of malignant transformation related genes |
| Identification of chemicals and drugs interact with genes involved in malignant transfromation |
| (DGIdb 4.0) |
| Entrez ID | Symbol | Category | Interaction Types | Drug Claim Name | Drug Name | PMIDs |
| Page: 1 |

Copyright 2023-Present -The University of Texas Health Science Center at Houston |