
|
|||||
|
 | |
| |
| |
| |
| |
| |
|
Gene: RIPK2 |
Gene summary for RIPK2 |
| Gene information | Species | Human | Gene symbol | RIPK2 | Gene ID | 8767 |
| Gene name | receptor interacting serine/threonine kinase 2 | |
| Gene Alias | CARD3 | |
| Cytomap | 8q21.3 | |
| Gene Type | protein-coding | GO ID | GO:0000165 | UniProtAcc | A0A0S2Z4Z8 |
Top |
Malignant transformation analysis |
| Identification of the aberrant gene expression in precancerous and cancerous lesions by comparing the gene expression of stem-like cells in diseased tissues with normal stem cells |
| Entrez ID | Symbol | Replicates | Species | Organ | Tissue | Adj P-value | Log2FC | Malignancy |
| 8767 | RIPK2 | AEH-subject1 | Human | Endometrium | AEH | 3.62e-13 | 4.45e-01 | -0.3059 |
| 8767 | RIPK2 | AEH-subject2 | Human | Endometrium | AEH | 3.78e-04 | 2.52e-01 | -0.2525 |
| 8767 | RIPK2 | AEH-subject3 | Human | Endometrium | AEH | 1.08e-05 | 3.25e-01 | -0.2576 |
| 8767 | RIPK2 | AEH-subject4 | Human | Endometrium | AEH | 1.34e-15 | 5.29e-01 | -0.2657 |
| 8767 | RIPK2 | AEH-subject5 | Human | Endometrium | AEH | 5.58e-32 | 8.62e-01 | -0.2953 |
| 8767 | RIPK2 | EEC-subject1 | Human | Endometrium | EEC | 3.71e-15 | 5.25e-01 | -0.2682 |
| 8767 | RIPK2 | EEC-subject2 | Human | Endometrium | EEC | 1.64e-03 | 2.63e-01 | -0.2607 |
| 8767 | RIPK2 | EEC-subject4 | Human | Endometrium | EEC | 2.15e-07 | 3.41e-01 | -0.2571 |
| 8767 | RIPK2 | EEC-subject5 | Human | Endometrium | EEC | 9.07e-06 | 3.00e-01 | -0.249 |
| 8767 | RIPK2 | GSM6177620_NYU_UCEC1_lib1_lib1 | Human | Endometrium | EEC | 4.10e-06 | 2.65e-01 | -0.1869 |
| 8767 | RIPK2 | GSM6177620_NYU_UCEC1_lib2_lib2 | Human | Endometrium | EEC | 2.56e-07 | 2.43e-01 | -0.1875 |
| 8767 | RIPK2 | GSM6177620_NYU_UCEC1_lib3_lib3 | Human | Endometrium | EEC | 2.63e-05 | 1.82e-01 | -0.1883 |
| 8767 | RIPK2 | GSM6177621_NYU_UCEC2_lib1_lib1 | Human | Endometrium | EEC | 3.30e-07 | 3.24e-01 | -0.1934 |
| 8767 | RIPK2 | GSM6177622_NYU_UCEC3_lib1_lib1 | Human | Endometrium | EEC | 1.86e-10 | 2.06e-01 | -0.1917 |
| 8767 | RIPK2 | GSM6177622_NYU_UCEC3_lib2_lib2 | Human | Endometrium | EEC | 1.05e-07 | 1.70e-01 | -0.1916 |
| 8767 | RIPK2 | LZE4T | Human | Esophagus | ESCC | 6.14e-07 | 2.22e-01 | 0.0811 |
| 8767 | RIPK2 | LZE8T | Human | Esophagus | ESCC | 6.27e-04 | 1.66e-01 | 0.067 |
| 8767 | RIPK2 | LZE24T | Human | Esophagus | ESCC | 7.80e-06 | 7.19e-02 | 0.0596 |
| 8767 | RIPK2 | LZE6T | Human | Esophagus | ESCC | 1.29e-03 | 9.50e-02 | 0.0845 |
| 8767 | RIPK2 | P2T-E | Human | Esophagus | ESCC | 1.98e-33 | 7.92e-01 | 0.1177 |
| Page: 1 2 3 4 5 6 |
| Tissue | Expression Dynamics | Abbreviation |
| Endometrium |  | AEH: Atypical endometrial hyperplasia |
| EEC: Endometrioid Cancer | ||
| Esophagus | 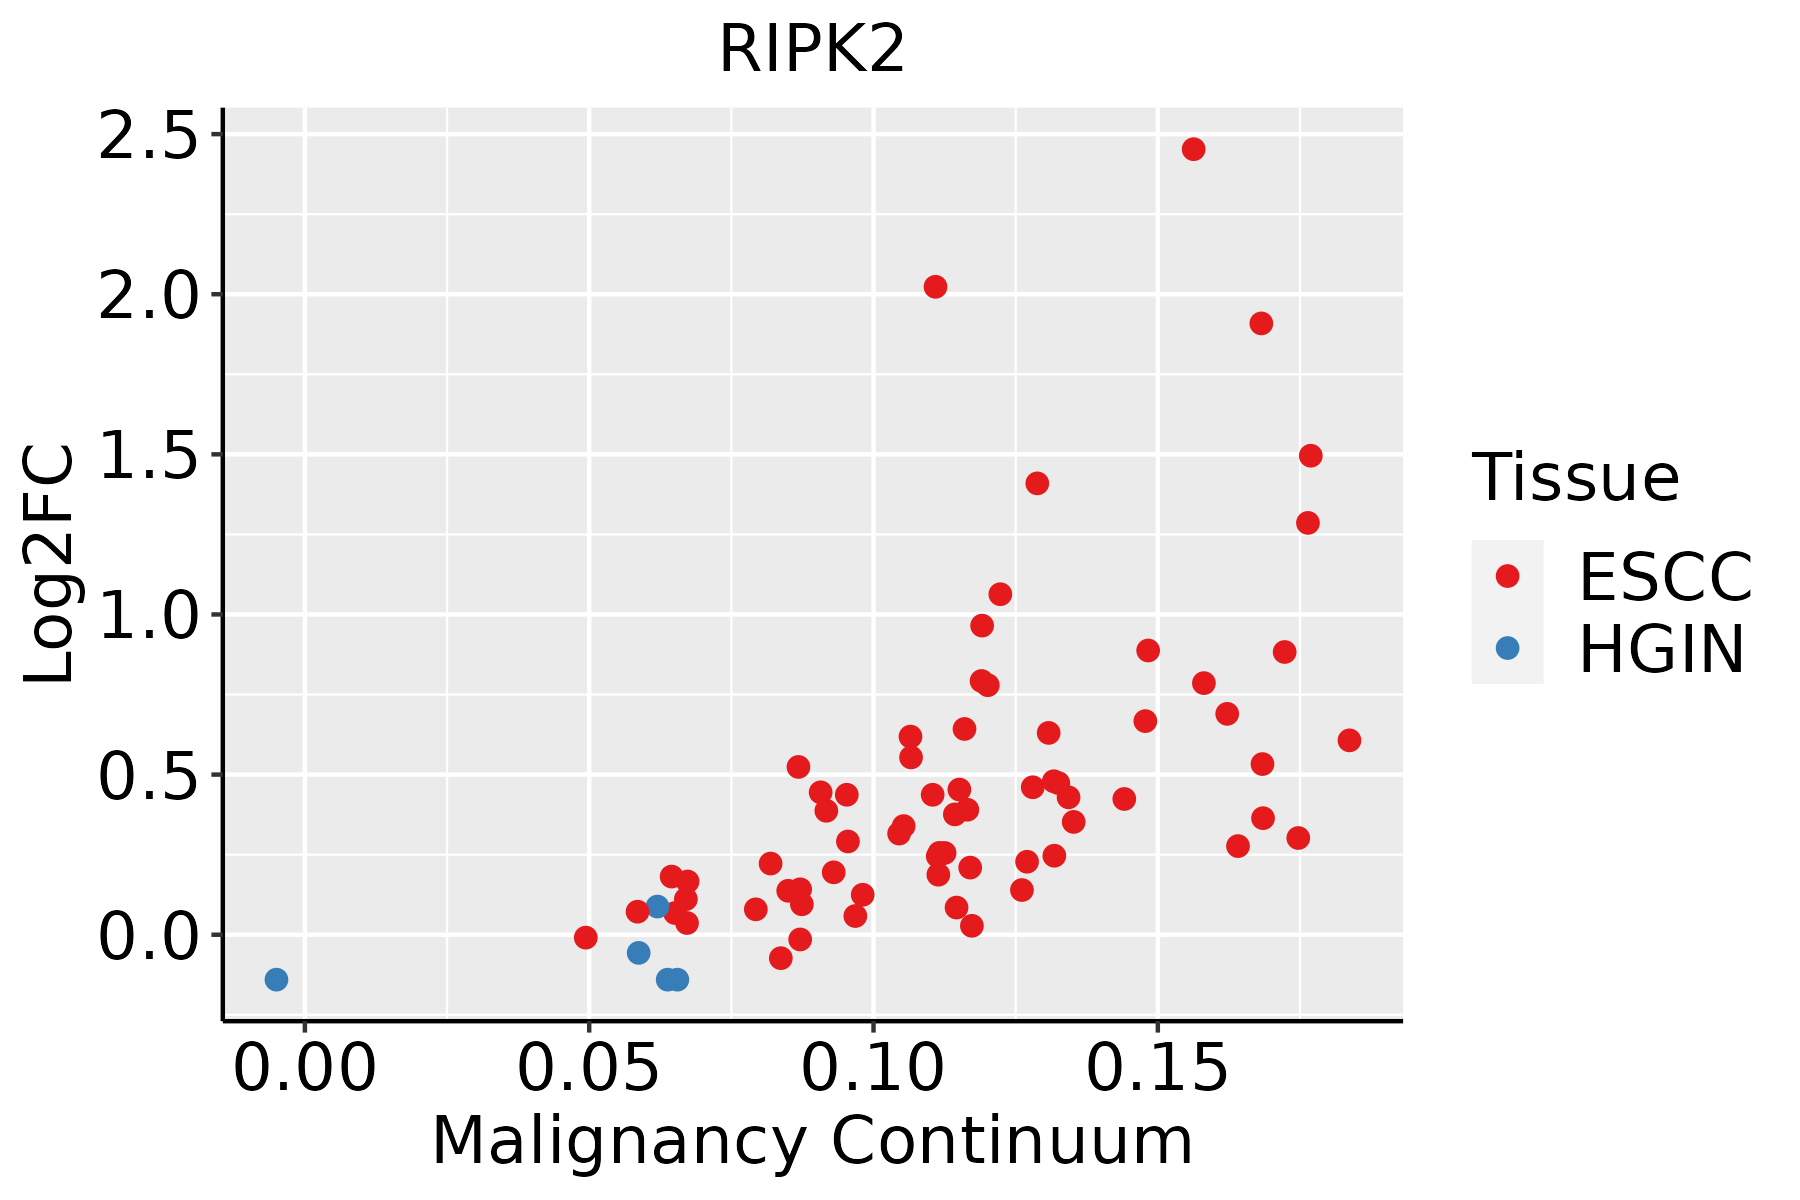 | ESCC: Esophageal squamous cell carcinoma |
| HGIN: High-grade intraepithelial neoplasias | ||
| LGIN: Low-grade intraepithelial neoplasias | ||
| Liver |  | HCC: Hepatocellular carcinoma |
| NAFLD: Non-alcoholic fatty liver disease | ||
| Lung | 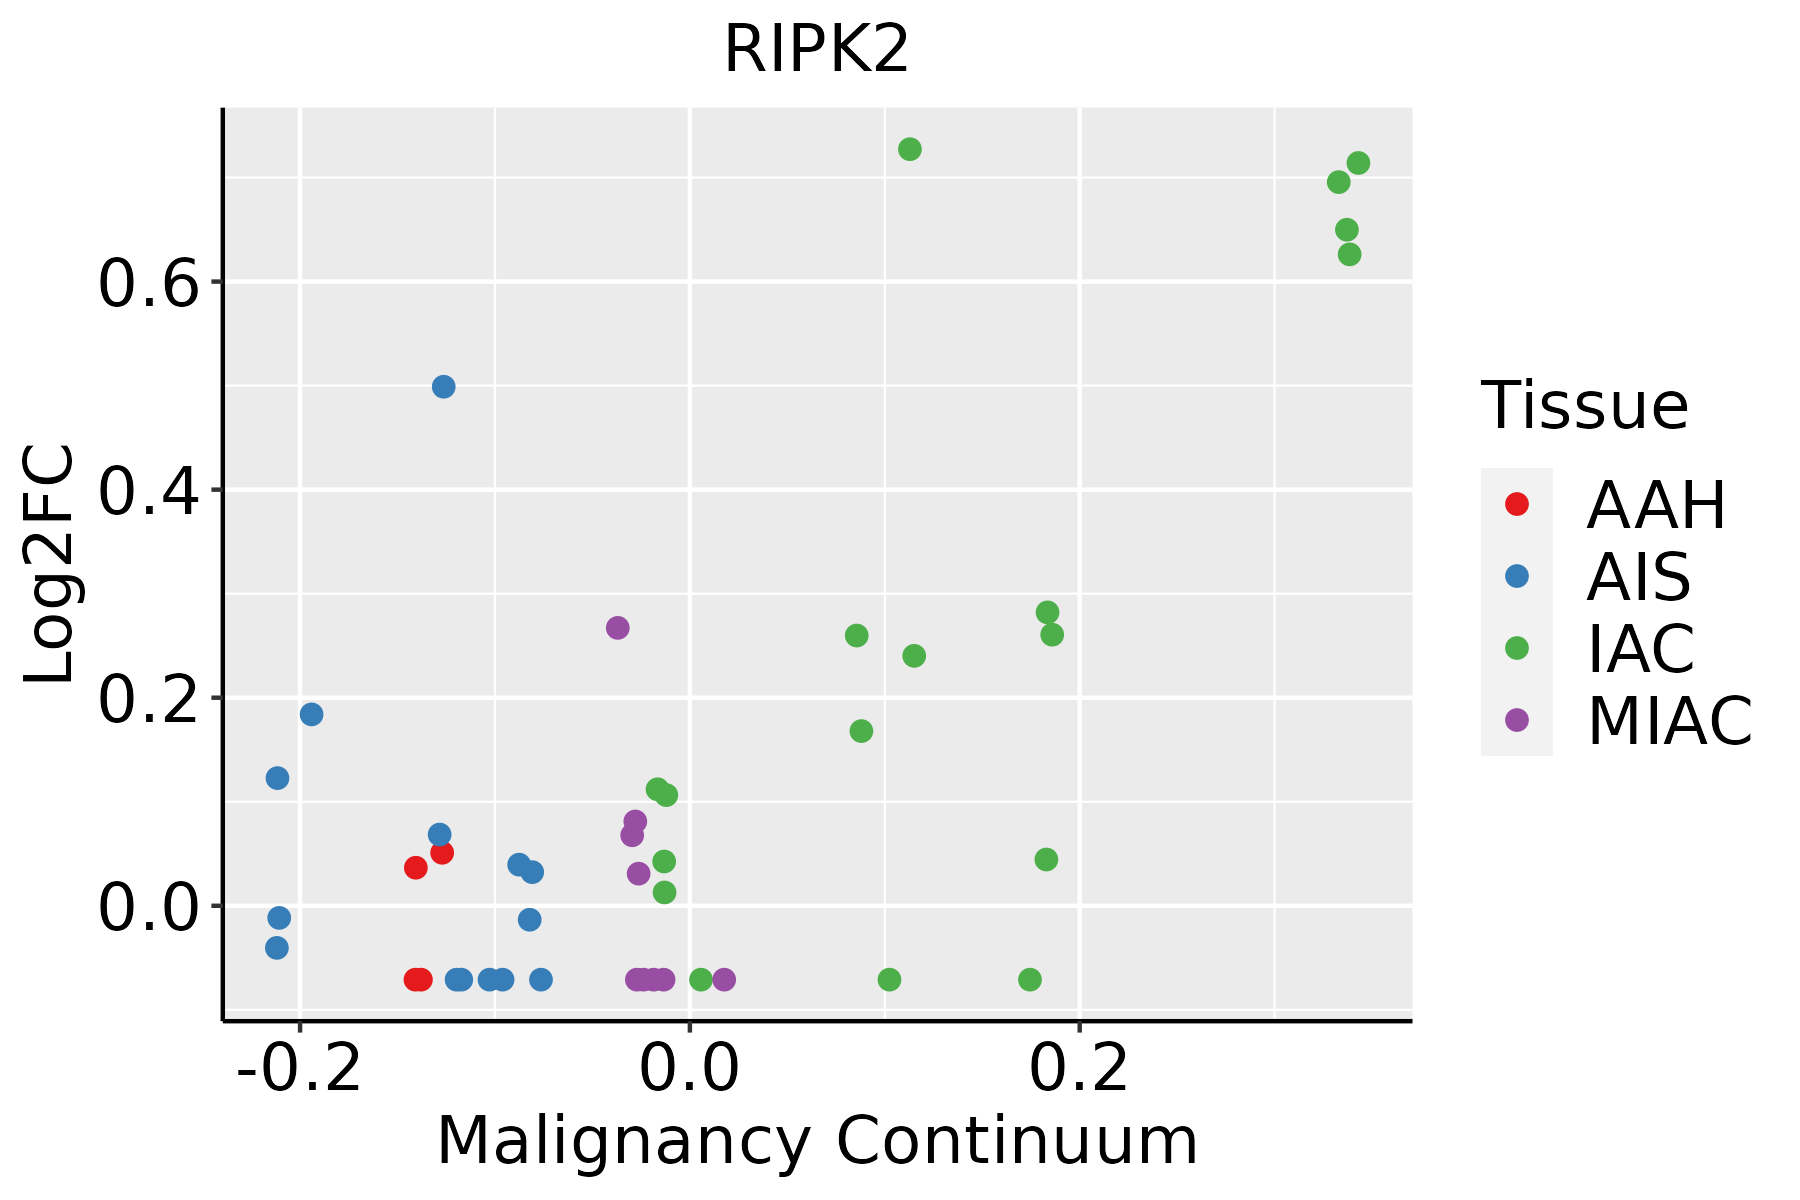 | AAH: Atypical adenomatous hyperplasia |
| AIS: Adenocarcinoma in situ | ||
| IAC: Invasive lung adenocarcinoma | ||
| MIA: Minimally invasive adenocarcinoma | ||
| Oral Cavity |  | EOLP: Erosive Oral lichen planus |
| LP: leukoplakia | ||
| NEOLP: Non-erosive oral lichen planus | ||
| OSCC: Oral squamous cell carcinoma | ||
| Thyroid | 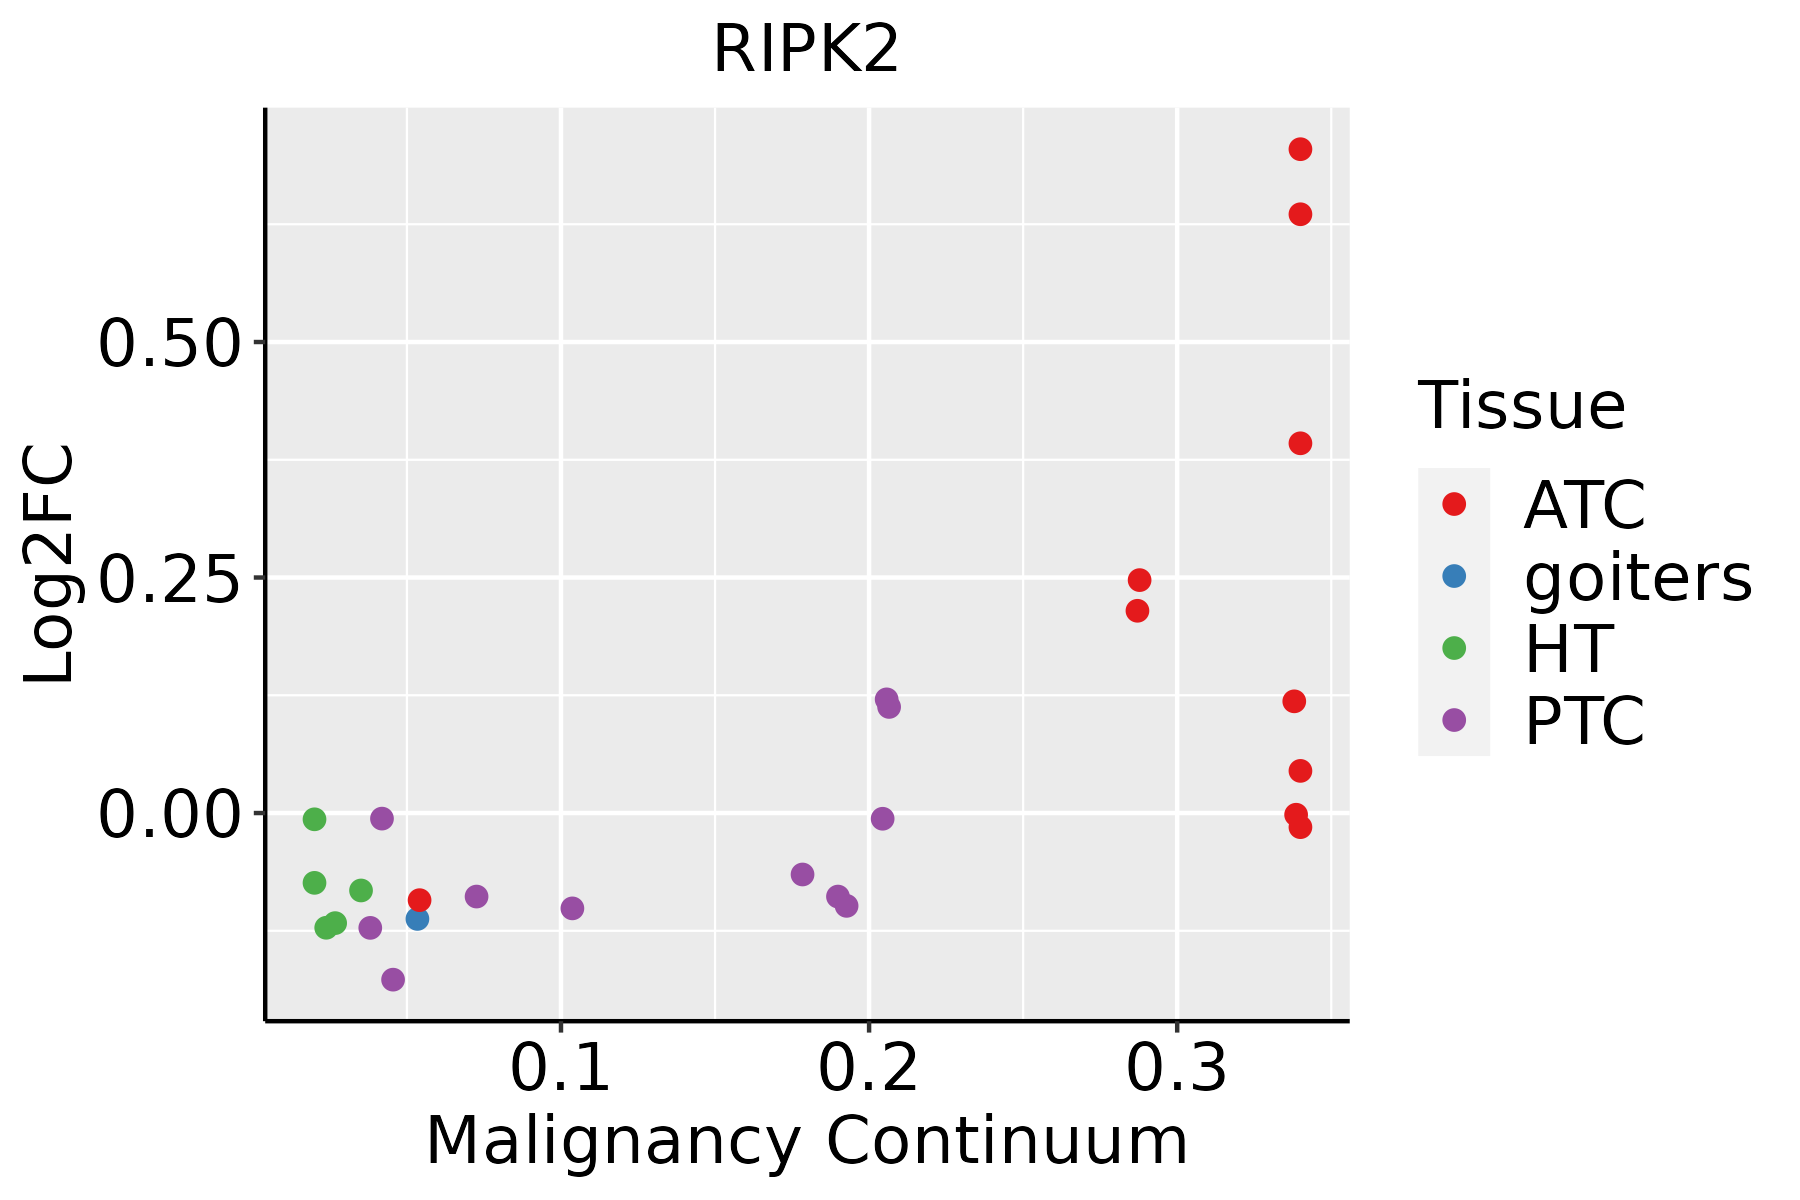 | ATC: Anaplastic thyroid cancer |
| HT: Hashimoto's thyroiditis | ||
| PTC: Papillary thyroid cancer |
| ∗log2FC in expression of this searched gene in stem-like cells from each diseased tissue sample relative to stem-like cells in normal samples in each tissue plotted against the malignancy continuum. Samples are colored based on if they are from different disease stage. |
Top |
Malignant transformation related pathway analysis |
| Find out the enriched GO biological processes and KEGG pathways involved in transition from healthy to precancer to cancer |
| Tissue | Disease Stage | Enriched GO biological Processes |
| Colorectum | AD |  |
| Colorectum | SER |  |
| Colorectum | MSS |  |
| Colorectum | MSI-H |  |
| Colorectum | FAP |  |
| ∗Top 15 enriched GO BP terms are showed in the bar plot of each disease state in each tissue. Each row represents a significant GO biological process which is colored according to the -log10(p.adjust). |
| Page: 1 2 3 4 5 6 7 8 9 |
| GO ID | Tissue | Disease Stage | Description | Gene Ratio | Bg Ratio | pvalue | p.adjust | Count |
| GO:190332016 | Endometrium | AEH | regulation of protein modification by small protein conjugation or removal | 67/2100 | 242/18723 | 1.10e-12 | 2.26e-10 | 67 |
| GO:004578516 | Endometrium | AEH | positive regulation of cell adhesion | 96/2100 | 437/18723 | 5.50e-11 | 7.18e-09 | 96 |
| GO:000989616 | Endometrium | AEH | positive regulation of catabolic process | 104/2100 | 492/18723 | 9.38e-11 | 1.10e-08 | 104 |
| GO:003139616 | Endometrium | AEH | regulation of protein ubiquitination | 57/2100 | 210/18723 | 1.24e-10 | 1.40e-08 | 57 |
| GO:003133116 | Endometrium | AEH | positive regulation of cellular catabolic process | 91/2100 | 427/18723 | 9.15e-10 | 8.31e-08 | 91 |
| GO:004586216 | Endometrium | AEH | positive regulation of proteolysis | 81/2100 | 372/18723 | 2.72e-09 | 2.06e-07 | 81 |
| GO:005109816 | Endometrium | AEH | regulation of binding | 77/2100 | 363/18723 | 2.21e-08 | 1.31e-06 | 77 |
| GO:003052210 | Endometrium | AEH | intracellular receptor signaling pathway | 60/2100 | 265/18723 | 7.16e-08 | 3.77e-06 | 60 |
| GO:005109916 | Endometrium | AEH | positive regulation of binding | 41/2100 | 173/18723 | 2.39e-06 | 6.92e-05 | 41 |
| GO:005254716 | Endometrium | AEH | regulation of peptidase activity | 85/2100 | 461/18723 | 2.47e-06 | 7.11e-05 | 85 |
| GO:001095216 | Endometrium | AEH | positive regulation of peptidase activity | 44/2100 | 197/18723 | 5.53e-06 | 1.38e-04 | 44 |
| GO:00431229 | Endometrium | AEH | regulation of I-kappaB kinase/NF-kappaB signaling | 52/2100 | 249/18723 | 6.58e-06 | 1.59e-04 | 52 |
| GO:00514039 | Endometrium | AEH | stress-activated MAPK cascade | 50/2100 | 239/18723 | 9.33e-06 | 2.18e-04 | 50 |
| GO:00310989 | Endometrium | AEH | stress-activated protein kinase signaling cascade | 51/2100 | 247/18723 | 1.12e-05 | 2.52e-04 | 51 |
| GO:00328728 | Endometrium | AEH | regulation of stress-activated MAPK cascade | 42/2100 | 192/18723 | 1.53e-05 | 3.23e-04 | 42 |
| GO:00431238 | Endometrium | AEH | positive regulation of I-kappaB kinase/NF-kappaB signaling | 41/2100 | 186/18723 | 1.59e-05 | 3.32e-04 | 41 |
| GO:00434105 | Endometrium | AEH | positive regulation of MAPK cascade | 84/2100 | 480/18723 | 2.19e-05 | 4.25e-04 | 84 |
| GO:00703028 | Endometrium | AEH | regulation of stress-activated protein kinase signaling cascade | 42/2100 | 195/18723 | 2.27e-05 | 4.35e-04 | 42 |
| GO:004339310 | Endometrium | AEH | regulation of protein binding | 42/2100 | 196/18723 | 2.58e-05 | 4.86e-04 | 42 |
| GO:00072498 | Endometrium | AEH | I-kappaB kinase/NF-kappaB signaling | 55/2100 | 281/18723 | 2.60e-05 | 4.88e-04 | 55 |
| Page: 1 2 3 4 5 6 7 8 9 10 11 12 13 14 15 16 17 18 19 20 21 22 23 24 25 26 27 28 29 30 31 32 33 34 35 36 37 38 39 40 41 42 43 |
| Pathway ID | Tissue | Disease Stage | Description | Gene Ratio | Bg Ratio | pvalue | p.adjust | qvalue | Count |
| hsa0513126 | Endometrium | AEH | Shigellosis | 78/1197 | 247/8465 | 9.23e-13 | 2.00e-11 | 1.46e-11 | 78 |
| hsa0513226 | Endometrium | AEH | Salmonella infection | 71/1197 | 249/8465 | 1.69e-09 | 3.44e-08 | 2.52e-08 | 71 |
| hsa0472216 | Endometrium | AEH | Neurotrophin signaling pathway | 31/1197 | 119/8465 | 4.07e-04 | 3.07e-03 | 2.25e-03 | 31 |
| hsa05131111 | Endometrium | AEH | Shigellosis | 78/1197 | 247/8465 | 9.23e-13 | 2.00e-11 | 1.46e-11 | 78 |
| hsa05132112 | Endometrium | AEH | Salmonella infection | 71/1197 | 249/8465 | 1.69e-09 | 3.44e-08 | 2.52e-08 | 71 |
| hsa0472217 | Endometrium | AEH | Neurotrophin signaling pathway | 31/1197 | 119/8465 | 4.07e-04 | 3.07e-03 | 2.25e-03 | 31 |
| hsa0513127 | Endometrium | EEC | Shigellosis | 79/1237 | 247/8465 | 1.80e-12 | 3.95e-11 | 2.95e-11 | 79 |
| hsa0513227 | Endometrium | EEC | Salmonella infection | 71/1237 | 249/8465 | 7.11e-09 | 1.30e-07 | 9.69e-08 | 71 |
| hsa0472222 | Endometrium | EEC | Neurotrophin signaling pathway | 30/1237 | 119/8465 | 1.54e-03 | 9.55e-03 | 7.12e-03 | 30 |
| hsa0513136 | Endometrium | EEC | Shigellosis | 79/1237 | 247/8465 | 1.80e-12 | 3.95e-11 | 2.95e-11 | 79 |
| hsa0513236 | Endometrium | EEC | Salmonella infection | 71/1237 | 249/8465 | 7.11e-09 | 1.30e-07 | 9.69e-08 | 71 |
| hsa0472232 | Endometrium | EEC | Neurotrophin signaling pathway | 30/1237 | 119/8465 | 1.54e-03 | 9.55e-03 | 7.12e-03 | 30 |
| hsa05132211 | Esophagus | ESCC | Salmonella infection | 191/4205 | 249/8465 | 6.51e-19 | 5.45e-17 | 2.79e-17 | 191 |
| hsa05131211 | Esophagus | ESCC | Shigellosis | 176/4205 | 247/8465 | 2.27e-12 | 4.01e-11 | 2.05e-11 | 176 |
| hsa0472225 | Esophagus | ESCC | Neurotrophin signaling pathway | 80/4205 | 119/8465 | 7.33e-05 | 3.07e-04 | 1.57e-04 | 80 |
| hsa0462122 | Esophagus | ESCC | NOD-like receptor signaling pathway | 116/4205 | 186/8465 | 2.90e-04 | 1.03e-03 | 5.30e-04 | 116 |
| hsa051527 | Esophagus | ESCC | Tuberculosis | 111/4205 | 180/8465 | 7.14e-04 | 2.32e-03 | 1.19e-03 | 111 |
| hsa05132310 | Esophagus | ESCC | Salmonella infection | 191/4205 | 249/8465 | 6.51e-19 | 5.45e-17 | 2.79e-17 | 191 |
| hsa05131310 | Esophagus | ESCC | Shigellosis | 176/4205 | 247/8465 | 2.27e-12 | 4.01e-11 | 2.05e-11 | 176 |
| hsa04722111 | Esophagus | ESCC | Neurotrophin signaling pathway | 80/4205 | 119/8465 | 7.33e-05 | 3.07e-04 | 1.57e-04 | 80 |
| Page: 1 2 3 4 |
Top |
Cell-cell communication analysis |
| Identification of potential cell-cell interactions between two cell types and their ligand-receptor pairs for different disease states |
| Ligand | Receptor | LRpair | Pathway | Tissue | Disease Stage |
| Page: 1 |
Top |
Single-cell gene regulatory network inference analysis |
| Find out the significant the regulons (TFs) and the target genes of each regulon across cell types for different disease states |
| TF | Cell Type | Tissue | Disease Stage | Target Gene | RSS | Regulon Activity |
| ∗The dot plots of a searched regulon are shown for all cell subpopulations in each disease state of each tissue based on the regulon specific score inferred using pySCENIC and by calculating the average expression. |
| Page: 1 |
Top |
Somatic mutation of malignant transformation related genes |
| Annotation of somatic variants for genes involved in malignant transformation |
| Hugo Symbol | Variant Class | Variant Classification | dbSNP RS | HGVSc | HGVSp | HGVSp Short | SWISSPROT | BIOTYPE | SIFT | PolyPhen | Tumor Sample Barcode | Tissue | Histology | Sex | Age | Stage | Therapy Types | Drugs | Outcome |
| RIPK2 | SNV | Missense_Mutation | c.510N>T | p.Trp170Cys | p.W170C | O43353 | protein_coding | tolerated(0.13) | probably_damaging(1) | TCGA-AO-A128-01 | Breast | breast invasive carcinoma | Female | <65 | I/II | Chemotherapy | doxorubicin | SD | |
| RIPK2 | SNV | Missense_Mutation | c.206T>A | p.Ile69Asn | p.I69N | O43353 | protein_coding | deleterious(0.02) | probably_damaging(0.983) | TCGA-C8-A133-01 | Breast | breast invasive carcinoma | Female | >=65 | III/IV | Unknown | Unknown | SD | |
| RIPK2 | SNV | Missense_Mutation | c.1336N>C | p.Asp446His | p.D446H | O43353 | protein_coding | deleterious(0) | possibly_damaging(0.721) | TCGA-C8-A26Y-01 | Breast | breast invasive carcinoma | Female | >=65 | I/II | Unknown | Unknown | SD | |
| RIPK2 | insertion | Frame_Shift_Ins | novel | c.1618_1619insAACATAGTTTTTCTTCAGTTGTTCATTTCTTC | p.Met540LysfsTer14 | p.M540Kfs*14 | O43353 | protein_coding | TCGA-A2-A04Y-01 | Breast | breast invasive carcinoma | Female | <65 | I/II | Chemotherapy | cytoxan | SD | ||
| RIPK2 | SNV | Missense_Mutation | c.1218N>A | p.Phe406Leu | p.F406L | O43353 | protein_coding | tolerated(0.78) | benign(0) | TCGA-AA-3977-01 | Colorectum | colon adenocarcinoma | Male | >=65 | I/II | Unknown | Unknown | SD | |
| RIPK2 | SNV | Missense_Mutation | c.218C>A | p.Ala73Asp | p.A73D | O43353 | protein_coding | deleterious(0) | probably_damaging(1) | TCGA-AA-A010-01 | Colorectum | colon adenocarcinoma | Female | <65 | I/II | Chemotherapy | folinic | CR | |
| RIPK2 | SNV | Missense_Mutation | novel | c.570N>G | p.Ile190Met | p.I190M | O43353 | protein_coding | deleterious(0) | probably_damaging(0.978) | TCGA-AZ-4315-01 | Colorectum | colon adenocarcinoma | Male | <65 | I/II | Unknown | Unknown | SD |
| RIPK2 | SNV | Missense_Mutation | c.821C>T | p.Ala274Val | p.A274V | O43353 | protein_coding | tolerated(0.09) | probably_damaging(0.91) | TCGA-CK-6746-01 | Colorectum | colon adenocarcinoma | Female | >=65 | I/II | Unknown | Unknown | SD | |
| RIPK2 | SNV | Missense_Mutation | rs775421386 | c.1600N>G | p.Leu534Val | p.L534V | O43353 | protein_coding | tolerated_low_confidence(0.05) | benign(0) | TCGA-F5-6814-01 | Colorectum | rectum adenocarcinoma | Male | <65 | I/II | Unknown | Unknown | SD |
| RIPK2 | SNV | Missense_Mutation | c.422C>A | p.Pro141His | p.P141H | O43353 | protein_coding | deleterious(0) | probably_damaging(0.998) | TCGA-A5-A0G2-01 | Endometrium | uterine corpus endometrioid carcinoma | Female | <65 | III/IV | Unknown | Unknown | SD |
| Page: 1 2 3 4 5 |
Top |
Related drugs of malignant transformation related genes |
| Identification of chemicals and drugs interact with genes involved in malignant transfromation |
| (DGIdb 4.0) |
| Entrez ID | Symbol | Category | Interaction Types | Drug Claim Name | Drug Name | PMIDs |
| 8767 | RIPK2 | SERINE THREONINE KINASE, KINASE, DRUGGABLE GENOME, ENZYME | inhibitor | 315661219 | ||
| 8767 | RIPK2 | SERINE THREONINE KINASE, KINASE, DRUGGABLE GENOME, ENZYME | PD-169316 | PD-169316 | 18408713 | |
| 8767 | RIPK2 | SERINE THREONINE KINASE, KINASE, DRUGGABLE GENOME, ENZYME | inhibitor | 384403681 | ||
| 8767 | RIPK2 | SERINE THREONINE KINASE, KINASE, DRUGGABLE GENOME, ENZYME | inhibitor | 178102513 | PONATINIB | |
| 8767 | RIPK2 | SERINE THREONINE KINASE, KINASE, DRUGGABLE GENOME, ENZYME | inhibitor | 385612179 | ||
| 8767 | RIPK2 | SERINE THREONINE KINASE, KINASE, DRUGGABLE GENOME, ENZYME | inhibitor | 381118799 | ||
| 8767 | RIPK2 | SERINE THREONINE KINASE, KINASE, DRUGGABLE GENOME, ENZYME | SB-202190 | SB-202190 | 22951114 | |
| 8767 | RIPK2 | SERINE THREONINE KINASE, KINASE, DRUGGABLE GENOME, ENZYME | inhibitor | 178102664 | ||
| 8767 | RIPK2 | SERINE THREONINE KINASE, KINASE, DRUGGABLE GENOME, ENZYME | inhibitor | 348353647 | ||
| 8767 | RIPK2 | SERINE THREONINE KINASE, KINASE, DRUGGABLE GENOME, ENZYME | inhibitor | 385612168 |
| Page: 1 |

Copyright 2023-Present -The University of Texas Health Science Center at Houston |