
|
|||||
|
 | |
| |
| |
| |
| |
| |
|
Gene: RIOX2 |
Gene summary for RIOX2 |
| Gene information | Species | Human | Gene symbol | RIOX2 | Gene ID | 84864 |
| Gene name | ribosomal oxygenase 2 | |
| Gene Alias | JMJD10 | |
| Cytomap | 3q11.2 | |
| Gene Type | protein-coding | GO ID | GO:0006139 | UniProtAcc | Q8IUF8 |
Top |
Malignant transformation analysis |
| Identification of the aberrant gene expression in precancerous and cancerous lesions by comparing the gene expression of stem-like cells in diseased tissues with normal stem cells |
| Entrez ID | Symbol | Replicates | Species | Organ | Tissue | Adj P-value | Log2FC | Malignancy |
| 84864 | RIOX2 | LZE4T | Human | Esophagus | ESCC | 1.47e-07 | 2.22e-01 | 0.0811 |
| 84864 | RIOX2 | LZE7T | Human | Esophagus | ESCC | 6.33e-03 | 2.13e-01 | 0.0667 |
| 84864 | RIOX2 | LZE8T | Human | Esophagus | ESCC | 5.32e-14 | 3.47e-01 | 0.067 |
| 84864 | RIOX2 | LZE20T | Human | Esophagus | ESCC | 4.88e-05 | 1.97e-01 | 0.0662 |
| 84864 | RIOX2 | LZE22T | Human | Esophagus | ESCC | 1.48e-05 | 3.63e-01 | 0.068 |
| 84864 | RIOX2 | LZE24T | Human | Esophagus | ESCC | 4.28e-25 | 5.66e-01 | 0.0596 |
| 84864 | RIOX2 | NAFLD1 | Human | Liver | NAFLD | 1.07e-02 | 2.65e-01 | -0.04 |
| 84864 | RIOX2 | S014 | Human | Liver | HCC | 2.15e-19 | 5.92e-01 | 0.2254 |
| 84864 | RIOX2 | S015 | Human | Liver | HCC | 7.40e-12 | 5.23e-01 | 0.2375 |
| 84864 | RIOX2 | S016 | Human | Liver | HCC | 8.08e-19 | 4.30e-01 | 0.2243 |
| 84864 | RIOX2 | S027 | Human | Liver | HCC | 8.93e-19 | 1.12e+00 | 0.2446 |
| 84864 | RIOX2 | S028 | Human | Liver | HCC | 1.73e-38 | 1.49e+00 | 0.2503 |
| 84864 | RIOX2 | S029 | Human | Liver | HCC | 7.85e-37 | 1.51e+00 | 0.2581 |
| 84864 | RIOX2 | male-WTA | Human | Thyroid | PTC | 3.77e-15 | 2.75e-01 | 0.1037 |
| 84864 | RIOX2 | nodule-WTA | Human | Thyroid | goiters | 6.05e-11 | 4.40e-01 | 0.0534 |
| 84864 | RIOX2 | PTC01 | Human | Thyroid | PTC | 5.45e-11 | 2.01e-01 | 0.1899 |
| 84864 | RIOX2 | PTC03 | Human | Thyroid | PTC | 6.94e-04 | 2.01e-01 | 0.1784 |
| 84864 | RIOX2 | PTC04 | Human | Thyroid | PTC | 1.28e-08 | 2.48e-01 | 0.1927 |
| 84864 | RIOX2 | PTC05 | Human | Thyroid | PTC | 2.38e-23 | 6.68e-01 | 0.2065 |
| 84864 | RIOX2 | PTC06 | Human | Thyroid | PTC | 2.00e-32 | 6.76e-01 | 0.2057 |
| Page: 1 2 |
| Tissue | Expression Dynamics | Abbreviation |
| Liver | 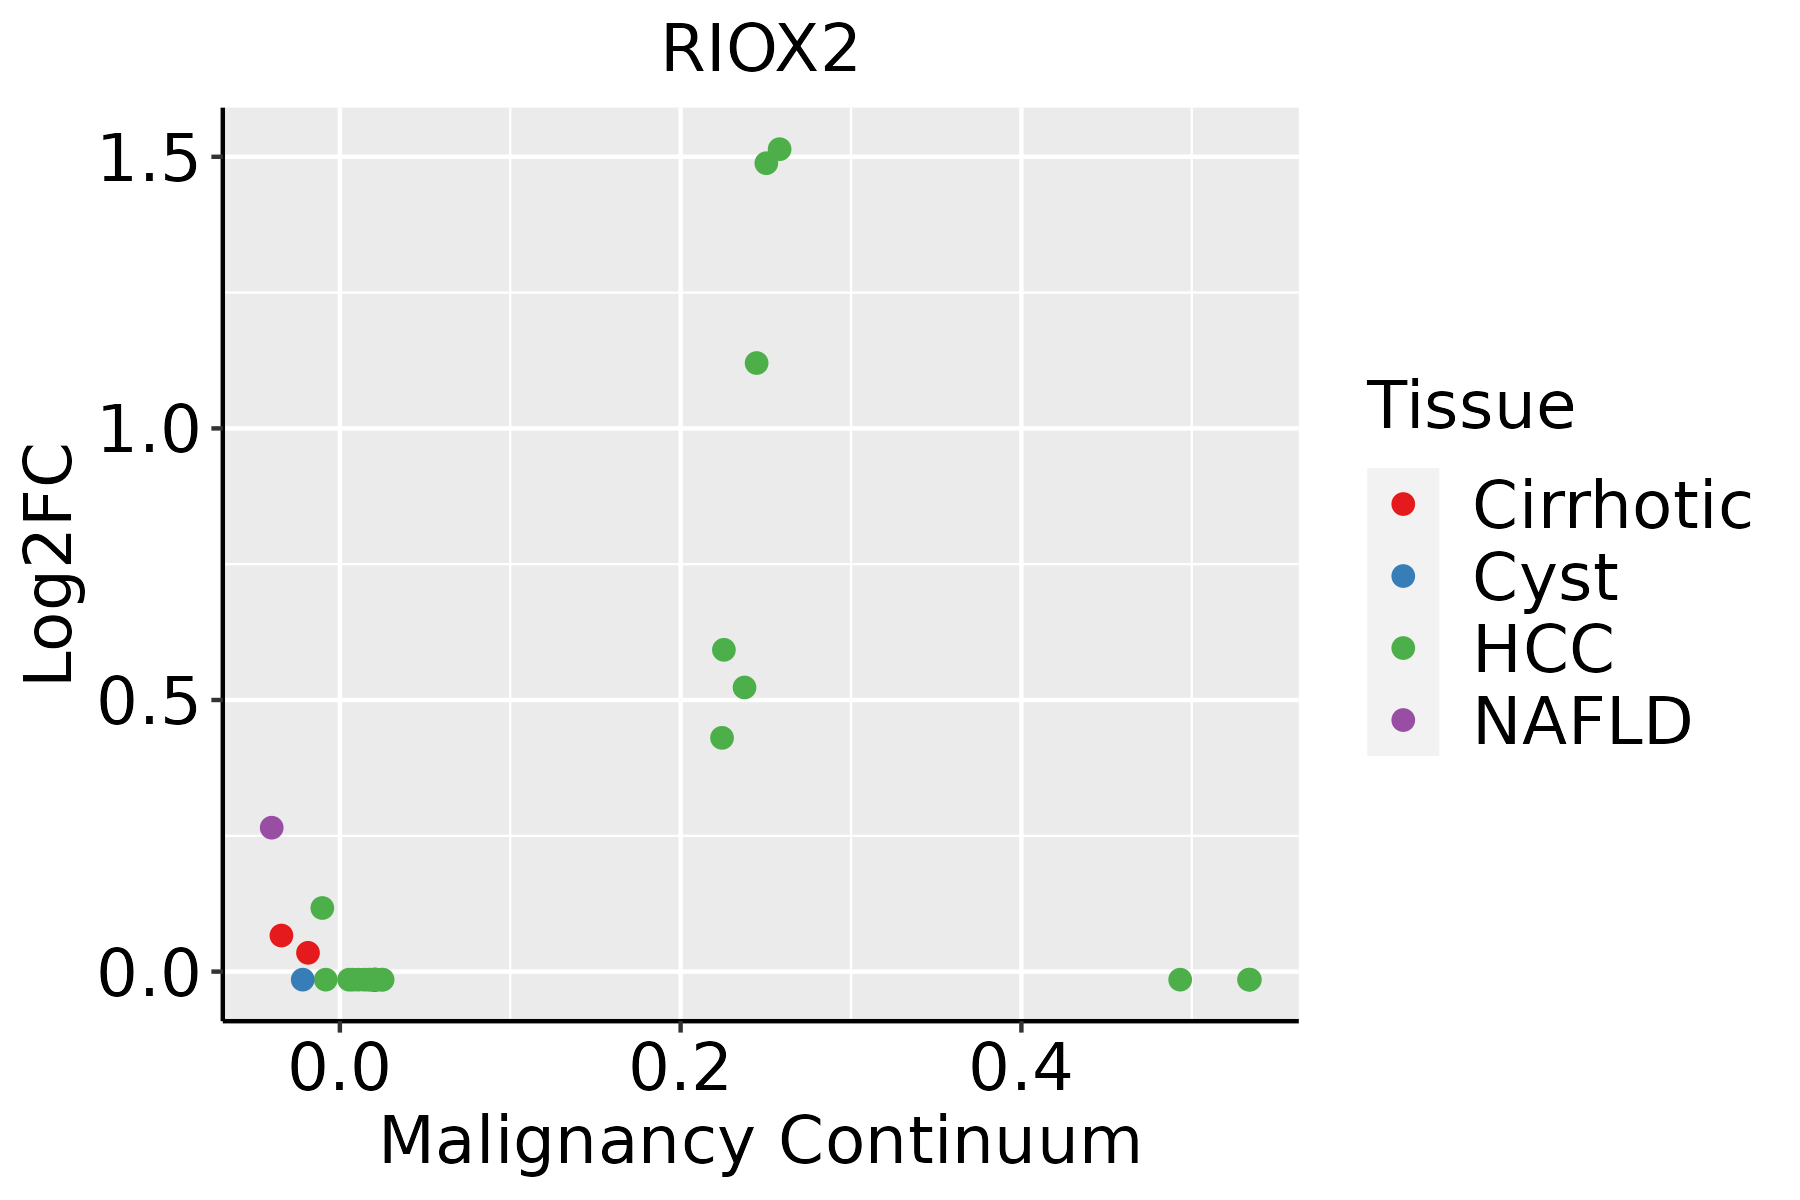 | HCC: Hepatocellular carcinoma |
| NAFLD: Non-alcoholic fatty liver disease | ||
| Thyroid |  | ATC: Anaplastic thyroid cancer |
| HT: Hashimoto's thyroiditis | ||
| PTC: Papillary thyroid cancer |
| ∗log2FC in expression of this searched gene in stem-like cells from each diseased tissue sample relative to stem-like cells in normal samples in each tissue plotted against the malignancy continuum. Samples are colored based on if they are from different disease stage. |
Top |
Malignant transformation related pathway analysis |
| Find out the enriched GO biological processes and KEGG pathways involved in transition from healthy to precancer to cancer |
| Tissue | Disease Stage | Enriched GO biological Processes |
| Colorectum | AD |  |
| Colorectum | SER |  |
| Colorectum | MSS |  |
| Colorectum | MSI-H |  |
| Colorectum | FAP |  |
| ∗Top 15 enriched GO BP terms are showed in the bar plot of each disease state in each tissue. Each row represents a significant GO biological process which is colored according to the -log10(p.adjust). |
| Page: 1 2 3 4 5 6 7 8 9 |
| GO ID | Tissue | Disease Stage | Description | Gene Ratio | Bg Ratio | pvalue | p.adjust | Count |
| GO:00165703 | Liver | NAFLD | histone modification | 90/1882 | 463/18723 | 5.74e-10 | 1.28e-07 | 90 |
| GO:00226137 | Liver | NAFLD | ribonucleoprotein complex biogenesis | 76/1882 | 463/18723 | 1.19e-05 | 3.67e-04 | 76 |
| GO:00422547 | Liver | NAFLD | ribosome biogenesis | 52/1882 | 299/18723 | 6.03e-05 | 1.32e-03 | 52 |
| GO:0070076 | Liver | NAFLD | histone lysine demethylation | 10/1882 | 28/18723 | 2.46e-04 | 4.09e-03 | 10 |
| GO:0016577 | Liver | NAFLD | histone demethylation | 10/1882 | 31/18723 | 6.28e-04 | 8.21e-03 | 10 |
| GO:0006482 | Liver | NAFLD | protein demethylation | 10/1882 | 33/18723 | 1.09e-03 | 1.27e-02 | 10 |
| GO:0008214 | Liver | NAFLD | protein dealkylation | 10/1882 | 33/18723 | 1.09e-03 | 1.27e-02 | 10 |
| GO:0070988 | Liver | NAFLD | demethylation | 16/1882 | 73/18723 | 2.09e-03 | 2.06e-02 | 16 |
| GO:002261322 | Liver | HCC | ribonucleoprotein complex biogenesis | 355/7958 | 463/18723 | 7.76e-52 | 4.92e-48 | 355 |
| GO:004225422 | Liver | HCC | ribosome biogenesis | 246/7958 | 299/18723 | 4.99e-46 | 1.58e-42 | 246 |
| GO:001657021 | Liver | HCC | histone modification | 283/7958 | 463/18723 | 2.68e-16 | 2.33e-14 | 283 |
| GO:0022613113 | Thyroid | PTC | ribonucleoprotein complex biogenesis | 292/5968 | 463/18723 | 3.24e-44 | 2.05e-40 | 292 |
| GO:0042254113 | Thyroid | PTC | ribosome biogenesis | 202/5968 | 299/18723 | 3.47e-37 | 5.47e-34 | 202 |
| GO:001657010 | Thyroid | PTC | histone modification | 235/5968 | 463/18723 | 1.17e-17 | 1.15e-15 | 235 |
| GO:0042254210 | Thyroid | goiters | ribosome biogenesis | 38/497 | 299/18723 | 1.07e-15 | 3.69e-13 | 38 |
| GO:0022613210 | Thyroid | goiters | ribonucleoprotein complex biogenesis | 47/497 | 463/18723 | 2.79e-15 | 8.90e-13 | 47 |
| GO:002261334 | Thyroid | ATC | ribonucleoprotein complex biogenesis | 292/6293 | 463/18723 | 3.05e-39 | 9.63e-36 | 292 |
| GO:004225434 | Thyroid | ATC | ribosome biogenesis | 203/6293 | 299/18723 | 3.63e-34 | 4.59e-31 | 203 |
| GO:001657017 | Thyroid | ATC | histone modification | 243/6293 | 463/18723 | 2.23e-17 | 2.27e-15 | 243 |
| Page: 1 |
| Pathway ID | Tissue | Disease Stage | Description | Gene Ratio | Bg Ratio | pvalue | p.adjust | qvalue | Count |
| Page: 1 |
Top |
Cell-cell communication analysis |
| Identification of potential cell-cell interactions between two cell types and their ligand-receptor pairs for different disease states |
| Ligand | Receptor | LRpair | Pathway | Tissue | Disease Stage |
| Page: 1 |
Top |
Single-cell gene regulatory network inference analysis |
| Find out the significant the regulons (TFs) and the target genes of each regulon across cell types for different disease states |
| TF | Cell Type | Tissue | Disease Stage | Target Gene | RSS | Regulon Activity |
| ∗The dot plots of a searched regulon are shown for all cell subpopulations in each disease state of each tissue based on the regulon specific score inferred using pySCENIC and by calculating the average expression. |
| Page: 1 |
Top |
Somatic mutation of malignant transformation related genes |
| Annotation of somatic variants for genes involved in malignant transformation |
| Hugo Symbol | Variant Class | Variant Classification | dbSNP RS | HGVSc | HGVSp | HGVSp Short | SWISSPROT | BIOTYPE | SIFT | PolyPhen | Tumor Sample Barcode | Tissue | Histology | Sex | Age | Stage | Therapy Types | Drugs | Outcome |
| RIOX2 | SNV | Missense_Mutation | novel | c.214N>A | p.Ala72Thr | p.A72T | Q8IUF8 | protein_coding | tolerated(0.37) | benign(0.018) | TCGA-AN-A0AK-01 | Breast | breast invasive carcinoma | Female | >=65 | I/II | Unknown | Unknown | SD |
| RIOX2 | SNV | Missense_Mutation | rs373581249 | c.631G>C | p.Val211Leu | p.V211L | Q8IUF8 | protein_coding | tolerated(0.16) | benign(0.112) | TCGA-B6-A0X1-01 | Breast | breast invasive carcinoma | Female | <65 | I/II | Unknown | Unknown | PD |
| RIOX2 | SNV | Missense_Mutation | novel | c.761N>C | p.Val254Ala | p.V254A | Q8IUF8 | protein_coding | deleterious(0) | possibly_damaging(0.458) | TCGA-D8-A1XK-01 | Breast | breast invasive carcinoma | Female | <65 | I/II | Chemotherapy | doxorubicine+cyclophosphamide | SD |
| RIOX2 | insertion | In_Frame_Ins | novel | c.1063_1064insAAG | p.Gly354_Gly355insGlu | p.G354_G355insE | Q8IUF8 | protein_coding | TCGA-A7-A26I-01 | Breast | breast invasive carcinoma | Female | >=65 | I/II | Chemotherapy | cytoxan | SD | ||
| RIOX2 | insertion | In_Frame_Ins | novel | c.1061_1062insGGA | p.Gly354_Gly355insAsp | p.G354_G355insD | Q8IUF8 | protein_coding | TCGA-A7-A26I-01 | Breast | breast invasive carcinoma | Female | >=65 | I/II | Chemotherapy | cytoxan | SD | ||
| RIOX2 | SNV | Missense_Mutation | novel | c.812C>T | p.Thr271Ile | p.T271I | Q8IUF8 | protein_coding | tolerated(0.5) | benign(0.006) | TCGA-2W-A8YY-01 | Cervix | cervical & endocervical cancer | Female | <65 | I/II | Chemotherapy | cisplatin | CR |
| RIOX2 | SNV | Missense_Mutation | c.849N>G | p.Asp283Glu | p.D283E | Q8IUF8 | protein_coding | tolerated(0.17) | benign(0.099) | TCGA-A6-2684-01 | Colorectum | colon adenocarcinoma | Female | >=65 | I/II | Unknown | Unknown | PD | |
| RIOX2 | SNV | Missense_Mutation | c.1167G>T | p.Lys389Asn | p.K389N | Q8IUF8 | protein_coding | tolerated(0.4) | benign(0.006) | TCGA-AA-A010-01 | Colorectum | colon adenocarcinoma | Female | <65 | I/II | Chemotherapy | folinic | CR | |
| RIOX2 | SNV | Missense_Mutation | novel | c.386N>G | p.Asp129Gly | p.D129G | Q8IUF8 | protein_coding | tolerated(0.09) | benign(0.092) | TCGA-F5-6814-01 | Colorectum | rectum adenocarcinoma | Male | <65 | I/II | Unknown | Unknown | SD |
| RIOX2 | insertion | Frame_Shift_Ins | novel | c.603_604insC | p.Thr202HisfsTer22 | p.T202Hfs*22 | Q8IUF8 | protein_coding | TCGA-AD-6895-01 | Colorectum | colon adenocarcinoma | Male | >=65 | III/IV | Unknown | Unknown | SD |
| Page: 1 2 3 4 5 6 |
Top |
Related drugs of malignant transformation related genes |
| Identification of chemicals and drugs interact with genes involved in malignant transfromation |
| (DGIdb 4.0) |
| Entrez ID | Symbol | Category | Interaction Types | Drug Claim Name | Drug Name | PMIDs |
| Page: 1 |

Copyright 2023-Present -The University of Texas Health Science Center at Houston |