
|
|||||
|
 | |
| |
| |
| |
| |
| |
|
Gene: RINT1 |
Gene summary for RINT1 |
| Gene information | Species | Human | Gene symbol | RINT1 | Gene ID | 60561 |
| Gene name | RAD50 interactor 1 | |
| Gene Alias | ILFS3 | |
| Cytomap | 7q22.3 | |
| Gene Type | protein-coding | GO ID | GO:0000075 | UniProtAcc | Q6NUQ1 |
Top |
Malignant transformation analysis |
| Identification of the aberrant gene expression in precancerous and cancerous lesions by comparing the gene expression of stem-like cells in diseased tissues with normal stem cells |
| Entrez ID | Symbol | Replicates | Species | Organ | Tissue | Adj P-value | Log2FC | Malignancy |
| 60561 | RINT1 | LZE4T | Human | Esophagus | ESCC | 1.68e-04 | 1.00e-01 | 0.0811 |
| 60561 | RINT1 | LZE24T | Human | Esophagus | ESCC | 2.69e-12 | 2.11e-01 | 0.0596 |
| 60561 | RINT1 | P1T-E | Human | Esophagus | ESCC | 3.46e-05 | 1.81e-01 | 0.0875 |
| 60561 | RINT1 | P2T-E | Human | Esophagus | ESCC | 1.29e-05 | 1.13e-01 | 0.1177 |
| 60561 | RINT1 | P4T-E | Human | Esophagus | ESCC | 3.11e-18 | 3.57e-01 | 0.1323 |
| 60561 | RINT1 | P5T-E | Human | Esophagus | ESCC | 1.87e-05 | 1.18e-01 | 0.1327 |
| 60561 | RINT1 | P8T-E | Human | Esophagus | ESCC | 1.96e-05 | 8.96e-02 | 0.0889 |
| 60561 | RINT1 | P9T-E | Human | Esophagus | ESCC | 1.62e-05 | 6.68e-02 | 0.1131 |
| 60561 | RINT1 | P10T-E | Human | Esophagus | ESCC | 1.62e-13 | 1.99e-01 | 0.116 |
| 60561 | RINT1 | P11T-E | Human | Esophagus | ESCC | 2.00e-07 | 3.61e-01 | 0.1426 |
| 60561 | RINT1 | P12T-E | Human | Esophagus | ESCC | 1.23e-20 | 3.20e-01 | 0.1122 |
| 60561 | RINT1 | P15T-E | Human | Esophagus | ESCC | 6.59e-12 | 4.02e-01 | 0.1149 |
| 60561 | RINT1 | P16T-E | Human | Esophagus | ESCC | 6.56e-15 | 2.69e-01 | 0.1153 |
| 60561 | RINT1 | P17T-E | Human | Esophagus | ESCC | 2.50e-02 | 3.74e-01 | 0.1278 |
| 60561 | RINT1 | P20T-E | Human | Esophagus | ESCC | 5.48e-28 | 5.72e-01 | 0.1124 |
| 60561 | RINT1 | P21T-E | Human | Esophagus | ESCC | 8.62e-15 | 2.54e-01 | 0.1617 |
| 60561 | RINT1 | P22T-E | Human | Esophagus | ESCC | 9.02e-11 | 1.77e-01 | 0.1236 |
| 60561 | RINT1 | P23T-E | Human | Esophagus | ESCC | 3.43e-21 | 6.16e-01 | 0.108 |
| 60561 | RINT1 | P24T-E | Human | Esophagus | ESCC | 2.02e-06 | 1.44e-01 | 0.1287 |
| 60561 | RINT1 | P26T-E | Human | Esophagus | ESCC | 5.79e-16 | 2.29e-01 | 0.1276 |
| Page: 1 2 3 |
| Tissue | Expression Dynamics | Abbreviation |
| Esophagus |  | ESCC: Esophageal squamous cell carcinoma |
| HGIN: High-grade intraepithelial neoplasias | ||
| LGIN: Low-grade intraepithelial neoplasias | ||
| Thyroid | 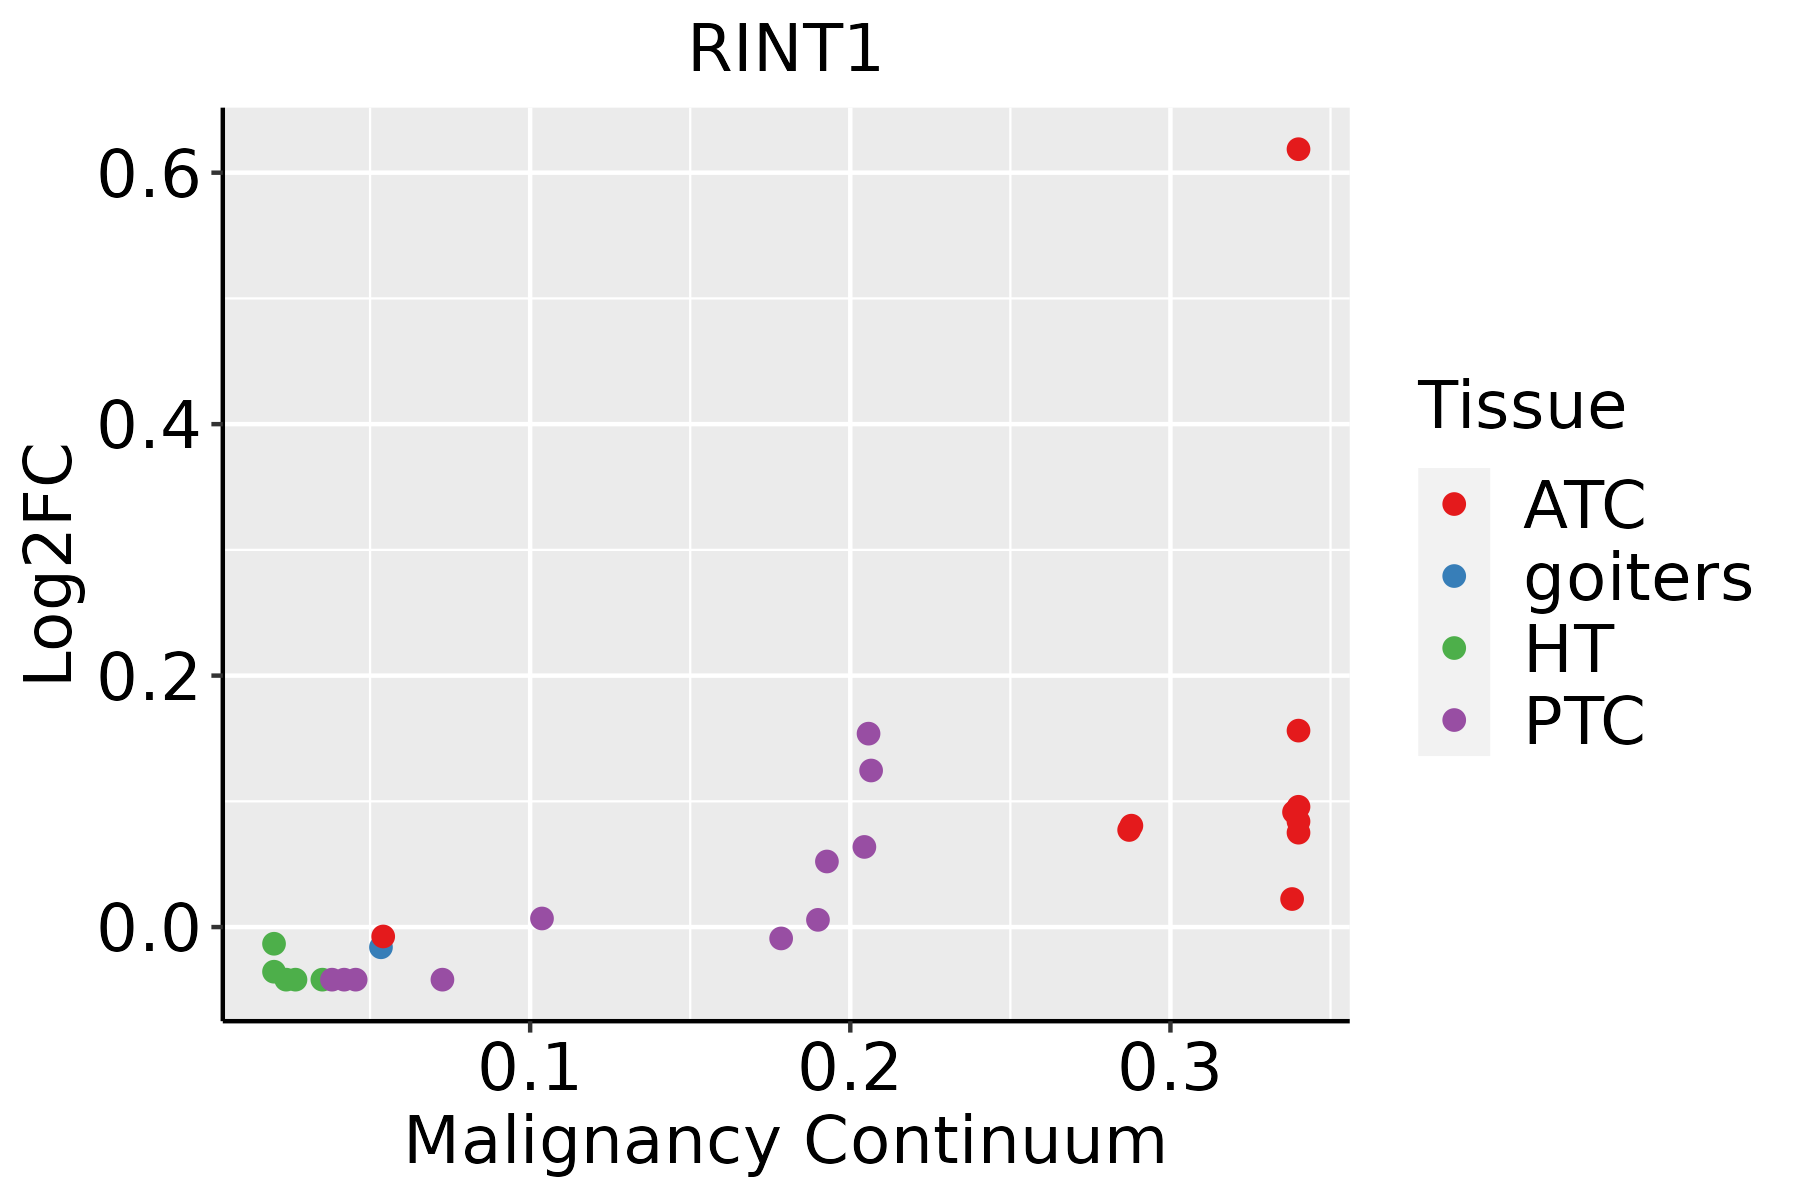 | ATC: Anaplastic thyroid cancer |
| HT: Hashimoto's thyroiditis | ||
| PTC: Papillary thyroid cancer |
| ∗log2FC in expression of this searched gene in stem-like cells from each diseased tissue sample relative to stem-like cells in normal samples in each tissue plotted against the malignancy continuum. Samples are colored based on if they are from different disease stage. |
Top |
Malignant transformation related pathway analysis |
| Find out the enriched GO biological processes and KEGG pathways involved in transition from healthy to precancer to cancer |
| Tissue | Disease Stage | Enriched GO biological Processes |
| Colorectum | AD |  |
| Colorectum | SER |  |
| Colorectum | MSS |  |
| Colorectum | MSI-H |  |
| Colorectum | FAP |  |
| ∗Top 15 enriched GO BP terms are showed in the bar plot of each disease state in each tissue. Each row represents a significant GO biological process which is colored according to the -log10(p.adjust). |
| Page: 1 2 3 4 5 6 7 8 9 |
| GO ID | Tissue | Disease Stage | Description | Gene Ratio | Bg Ratio | pvalue | p.adjust | Count |
| GO:004819318 | Esophagus | ESCC | Golgi vesicle transport | 231/8552 | 296/18723 | 1.82e-30 | 9.63e-28 | 231 |
| GO:003238618 | Esophagus | ESCC | regulation of intracellular transport | 243/8552 | 337/18723 | 3.20e-23 | 7.25e-21 | 243 |
| GO:004477216 | Esophagus | ESCC | mitotic cell cycle phase transition | 281/8552 | 424/18723 | 4.63e-18 | 4.45e-16 | 281 |
| GO:000734615 | Esophagus | ESCC | regulation of mitotic cell cycle | 293/8552 | 457/18723 | 8.00e-16 | 5.64e-14 | 293 |
| GO:000688815 | Esophagus | ESCC | endoplasmic reticulum to Golgi vesicle-mediated transport | 102/8552 | 130/18723 | 1.73e-14 | 9.22e-13 | 102 |
| GO:190198713 | Esophagus | ESCC | regulation of cell cycle phase transition | 242/8552 | 390/18723 | 3.86e-11 | 1.26e-09 | 242 |
| GO:000689017 | Esophagus | ESCC | retrograde vesicle-mediated transport, Golgi to endoplasmic reticulum | 46/8552 | 52/18723 | 1.23e-10 | 3.66e-09 | 46 |
| GO:190199013 | Esophagus | ESCC | regulation of mitotic cell cycle phase transition | 191/8552 | 299/18723 | 1.35e-10 | 3.94e-09 | 191 |
| GO:00457865 | Esophagus | ESCC | negative regulation of cell cycle | 236/8552 | 385/18723 | 3.62e-10 | 9.93e-09 | 236 |
| GO:00000754 | Esophagus | ESCC | cell cycle checkpoint | 117/8552 | 169/18723 | 4.47e-10 | 1.17e-08 | 117 |
| GO:004277014 | Esophagus | ESCC | signal transduction in response to DNA damage | 117/8552 | 172/18723 | 2.38e-09 | 5.32e-08 | 117 |
| GO:00448394 | Esophagus | ESCC | cell cycle G2/M phase transition | 103/8552 | 148/18723 | 3.09e-09 | 6.67e-08 | 103 |
| GO:00000864 | Esophagus | ESCC | G2/M transition of mitotic cell cycle | 96/8552 | 137/18723 | 6.00e-09 | 1.23e-07 | 96 |
| GO:00070934 | Esophagus | ESCC | mitotic cell cycle checkpoint | 90/8552 | 129/18723 | 2.49e-08 | 4.69e-07 | 90 |
| GO:00109484 | Esophagus | ESCC | negative regulation of cell cycle process | 177/8552 | 294/18723 | 3.26e-07 | 4.59e-06 | 177 |
| GO:00315705 | Esophagus | ESCC | DNA integrity checkpoint | 83/8552 | 123/18723 | 8.17e-07 | 1.06e-05 | 83 |
| GO:00000775 | Esophagus | ESCC | DNA damage checkpoint | 78/8552 | 115/18723 | 1.27e-06 | 1.56e-05 | 78 |
| GO:19019883 | Esophagus | ESCC | negative regulation of cell cycle phase transition | 151/8552 | 249/18723 | 1.28e-06 | 1.57e-05 | 151 |
| GO:004593013 | Esophagus | ESCC | negative regulation of mitotic cell cycle | 143/8552 | 235/18723 | 1.84e-06 | 2.15e-05 | 143 |
| GO:190199113 | Esophagus | ESCC | negative regulation of mitotic cell cycle phase transition | 112/8552 | 179/18723 | 3.69e-06 | 4.03e-05 | 112 |
| Page: 1 2 3 4 5 |
| Pathway ID | Tissue | Disease Stage | Description | Gene Ratio | Bg Ratio | pvalue | p.adjust | qvalue | Count |
| Page: 1 |
Top |
Cell-cell communication analysis |
| Identification of potential cell-cell interactions between two cell types and their ligand-receptor pairs for different disease states |
| Ligand | Receptor | LRpair | Pathway | Tissue | Disease Stage |
| Page: 1 |
Top |
Single-cell gene regulatory network inference analysis |
| Find out the significant the regulons (TFs) and the target genes of each regulon across cell types for different disease states |
| TF | Cell Type | Tissue | Disease Stage | Target Gene | RSS | Regulon Activity |
| ∗The dot plots of a searched regulon are shown for all cell subpopulations in each disease state of each tissue based on the regulon specific score inferred using pySCENIC and by calculating the average expression. |
| Page: 1 |
Top |
Somatic mutation of malignant transformation related genes |
| Annotation of somatic variants for genes involved in malignant transformation |
| Hugo Symbol | Variant Class | Variant Classification | dbSNP RS | HGVSc | HGVSp | HGVSp Short | SWISSPROT | BIOTYPE | SIFT | PolyPhen | Tumor Sample Barcode | Tissue | Histology | Sex | Age | Stage | Therapy Types | Drugs | Outcome |
| RINT1 | SNV | Missense_Mutation | c.666N>T | p.Lys222Asn | p.K222N | Q6NUQ1 | protein_coding | tolerated(0.13) | possibly_damaging(0.879) | TCGA-A8-A09A-01 | Breast | breast invasive carcinoma | Female | <65 | I/II | Hormone Therapy | tamoxiphen | SD | |
| RINT1 | SNV | Missense_Mutation | novel | c.305G>T | p.Arg102Ile | p.R102I | Q6NUQ1 | protein_coding | deleterious(0) | probably_damaging(0.929) | TCGA-AN-A046-01 | Breast | breast invasive carcinoma | Female | >=65 | I/II | Unknown | Unknown | SD |
| RINT1 | SNV | Missense_Mutation | novel | c.470N>T | p.Arg157Leu | p.R157L | Q6NUQ1 | protein_coding | deleterious(0) | possibly_damaging(0.493) | TCGA-E2-A3DX-01 | Breast | breast invasive carcinoma | Female | <65 | III/IV | Chemotherapy | doxorubicin | SD |
| RINT1 | SNV | Missense_Mutation | c.2060N>G | p.Tyr687Cys | p.Y687C | Q6NUQ1 | protein_coding | deleterious(0) | probably_damaging(0.995) | TCGA-E9-A22B-01 | Breast | breast invasive carcinoma | Female | >=65 | I/II | Hormone Therapy | tamoxiphen | SD | |
| RINT1 | insertion | Nonsense_Mutation | novel | c.777_778insTATGACACAAAACAGGTCTGTCAGGAGGAGTAGGAAGGGAAAG | p.Ala260TyrfsTer11 | p.A260Yfs*11 | Q6NUQ1 | protein_coding | TCGA-A8-A092-01 | Breast | breast invasive carcinoma | Female | <65 | III/IV | Chemotherapy | paclitaxel | CR | ||
| RINT1 | SNV | Missense_Mutation | c.1477N>C | p.Tyr493His | p.Y493H | Q6NUQ1 | protein_coding | deleterious(0) | probably_damaging(1) | TCGA-A6-6780-01 | Colorectum | colon adenocarcinoma | Male | >=65 | I/II | Unknown | Unknown | SD | |
| RINT1 | SNV | Missense_Mutation | c.1259N>A | p.Gly420Asp | p.G420D | Q6NUQ1 | protein_coding | tolerated(0.59) | benign(0.035) | TCGA-AZ-6598-01 | Colorectum | colon adenocarcinoma | Female | >=65 | I/II | Unknown | Unknown | SD | |
| RINT1 | SNV | Missense_Mutation | rs866948739 | c.311G>A | p.Arg104Gln | p.R104Q | Q6NUQ1 | protein_coding | tolerated(1) | benign(0) | TCGA-AG-A002-01 | Colorectum | rectum adenocarcinoma | Male | <65 | I/II | Unknown | Unknown | SD |
| RINT1 | SNV | Missense_Mutation | novel | c.1540G>T | p.Asp514Tyr | p.D514Y | Q6NUQ1 | protein_coding | deleterious(0) | probably_damaging(0.997) | TCGA-AG-A002-01 | Colorectum | rectum adenocarcinoma | Male | <65 | I/II | Unknown | Unknown | SD |
| RINT1 | SNV | Missense_Mutation | c.393T>G | p.Ile131Met | p.I131M | Q6NUQ1 | protein_coding | deleterious(0.01) | possibly_damaging(0.776) | TCGA-F5-6812-01 | Colorectum | rectum adenocarcinoma | Male | >=65 | I/II | Unknown | Unknown | SD |
| Page: 1 2 3 4 5 6 |
Top |
Related drugs of malignant transformation related genes |
| Identification of chemicals and drugs interact with genes involved in malignant transfromation |
| (DGIdb 4.0) |
| Entrez ID | Symbol | Category | Interaction Types | Drug Claim Name | Drug Name | PMIDs |
| Page: 1 |

Copyright 2023-Present -The University of Texas Health Science Center at Houston |