
|
|||||
|
 | |
| |
| |
| |
| |
| |
|
Gene: RING1 |
Gene summary for RING1 |
| Gene information | Species | Human | Gene symbol | RING1 | Gene ID | 6015 |
| Gene name | ring finger protein 1 | |
| Gene Alias | RING1A | |
| Cytomap | 6p21.32 | |
| Gene Type | protein-coding | GO ID | GO:0001654 | UniProtAcc | A0A1U9X8F2 |
Top |
Malignant transformation analysis |
| Identification of the aberrant gene expression in precancerous and cancerous lesions by comparing the gene expression of stem-like cells in diseased tissues with normal stem cells |
| Entrez ID | Symbol | Replicates | Species | Organ | Tissue | Adj P-value | Log2FC | Malignancy |
| 6015 | RING1 | LZE2T | Human | Esophagus | ESCC | 3.30e-03 | 3.00e-01 | 0.082 |
| 6015 | RING1 | LZE4T | Human | Esophagus | ESCC | 8.40e-17 | 3.51e-01 | 0.0811 |
| 6015 | RING1 | LZE7T | Human | Esophagus | ESCC | 2.29e-18 | 4.06e-01 | 0.0667 |
| 6015 | RING1 | LZE20T | Human | Esophagus | ESCC | 1.77e-09 | 3.22e-01 | 0.0662 |
| 6015 | RING1 | LZE22D1 | Human | Esophagus | HGIN | 2.55e-05 | 1.59e-01 | 0.0595 |
| 6015 | RING1 | LZE22T | Human | Esophagus | ESCC | 1.49e-05 | 5.80e-01 | 0.068 |
| 6015 | RING1 | LZE24T | Human | Esophagus | ESCC | 9.74e-26 | 7.40e-01 | 0.0596 |
| 6015 | RING1 | LZE22D3 | Human | Esophagus | HGIN | 1.39e-03 | 3.26e-01 | 0.0653 |
| 6015 | RING1 | LZE21T | Human | Esophagus | ESCC | 3.39e-12 | 5.77e-01 | 0.0655 |
| 6015 | RING1 | P1T-E | Human | Esophagus | ESCC | 2.44e-17 | 5.96e-01 | 0.0875 |
| 6015 | RING1 | P2T-E | Human | Esophagus | ESCC | 4.61e-55 | 9.78e-01 | 0.1177 |
| 6015 | RING1 | P4T-E | Human | Esophagus | ESCC | 2.76e-38 | 8.24e-01 | 0.1323 |
| 6015 | RING1 | P5T-E | Human | Esophagus | ESCC | 4.60e-31 | 4.62e-01 | 0.1327 |
| 6015 | RING1 | P8T-E | Human | Esophagus | ESCC | 2.91e-47 | 6.75e-01 | 0.0889 |
| 6015 | RING1 | P9T-E | Human | Esophagus | ESCC | 9.57e-23 | 4.17e-01 | 0.1131 |
| 6015 | RING1 | P10T-E | Human | Esophagus | ESCC | 1.21e-31 | 5.66e-01 | 0.116 |
| 6015 | RING1 | P11T-E | Human | Esophagus | ESCC | 5.12e-24 | 8.33e-01 | 0.1426 |
| 6015 | RING1 | P12T-E | Human | Esophagus | ESCC | 7.84e-37 | 6.66e-01 | 0.1122 |
| 6015 | RING1 | P15T-E | Human | Esophagus | ESCC | 1.24e-26 | 6.18e-01 | 0.1149 |
| 6015 | RING1 | P16T-E | Human | Esophagus | ESCC | 8.98e-35 | 6.30e-01 | 0.1153 |
| Page: 1 2 3 4 5 6 7 |
| Tissue | Expression Dynamics | Abbreviation |
| Esophagus | 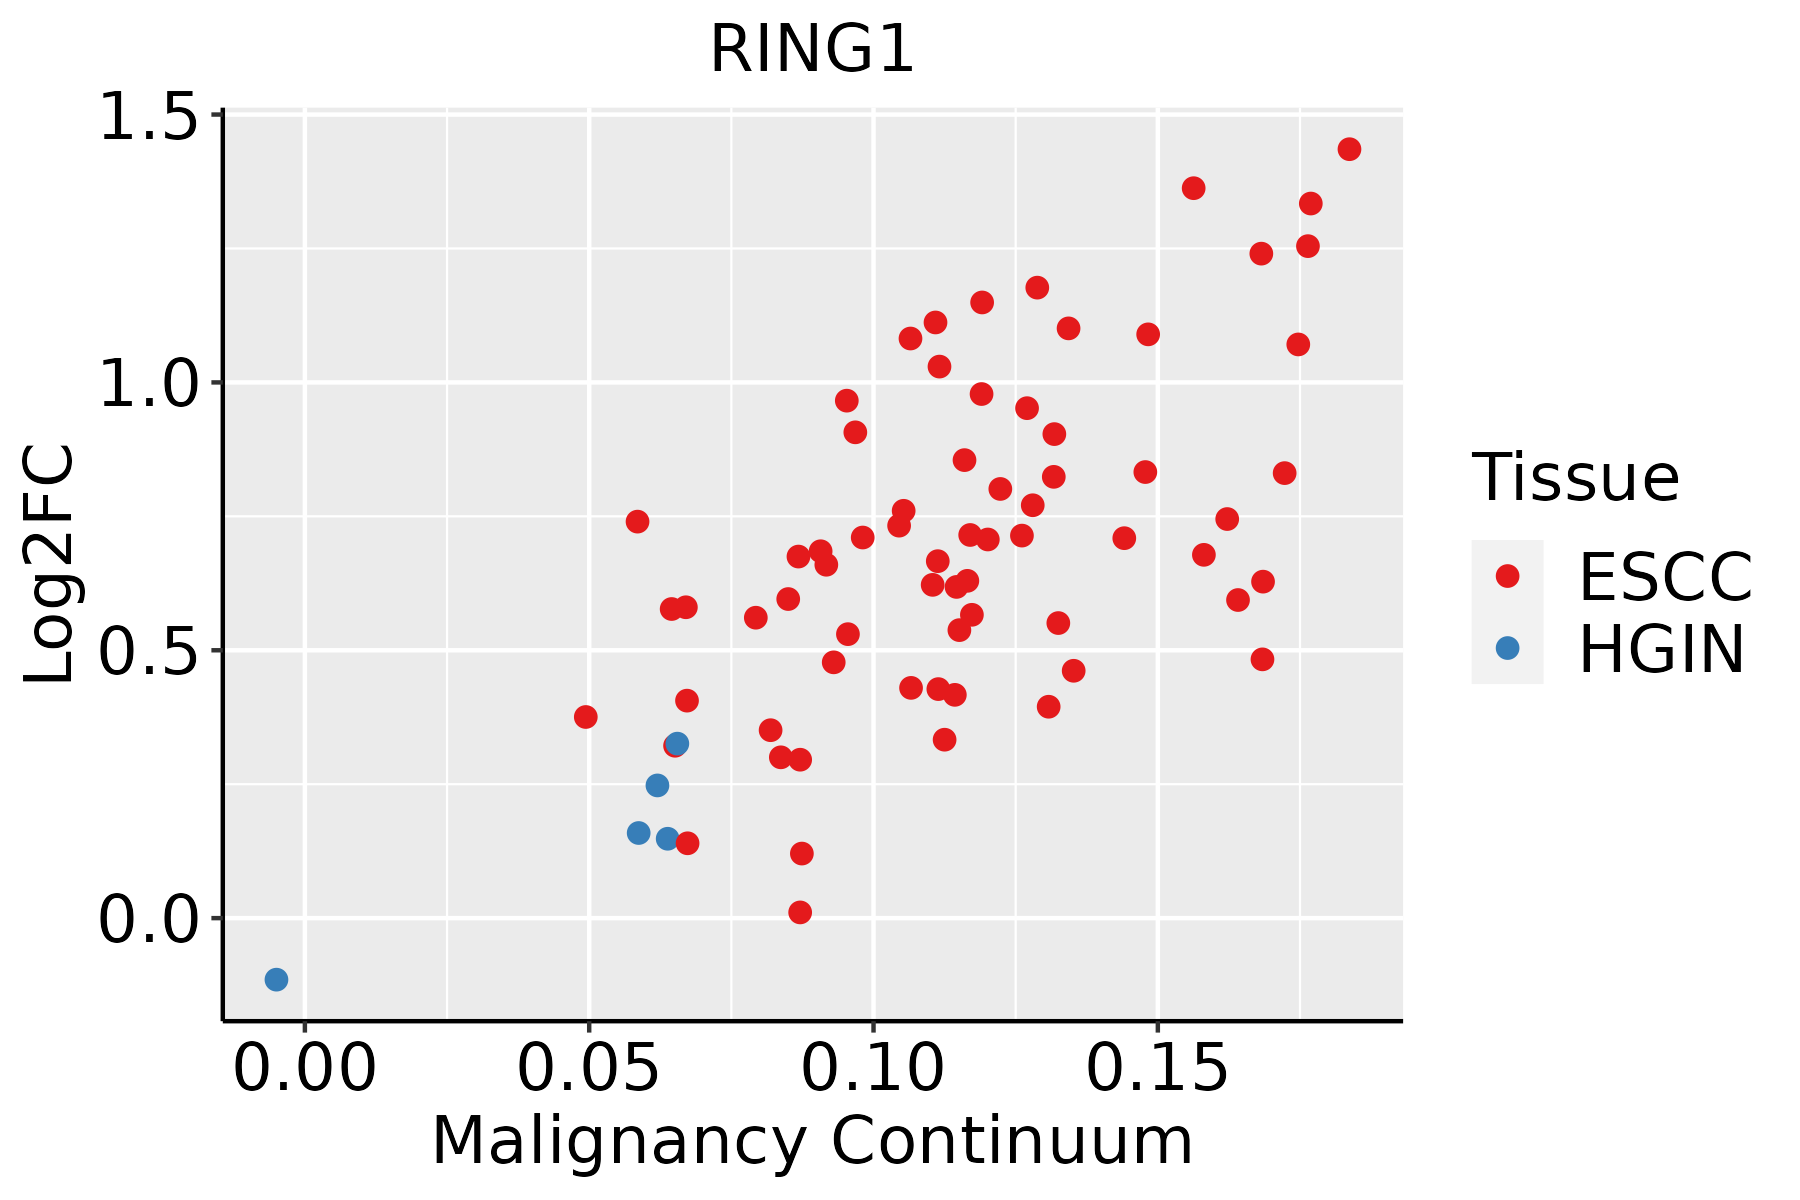 | ESCC: Esophageal squamous cell carcinoma |
| HGIN: High-grade intraepithelial neoplasias | ||
| LGIN: Low-grade intraepithelial neoplasias | ||
| Liver | 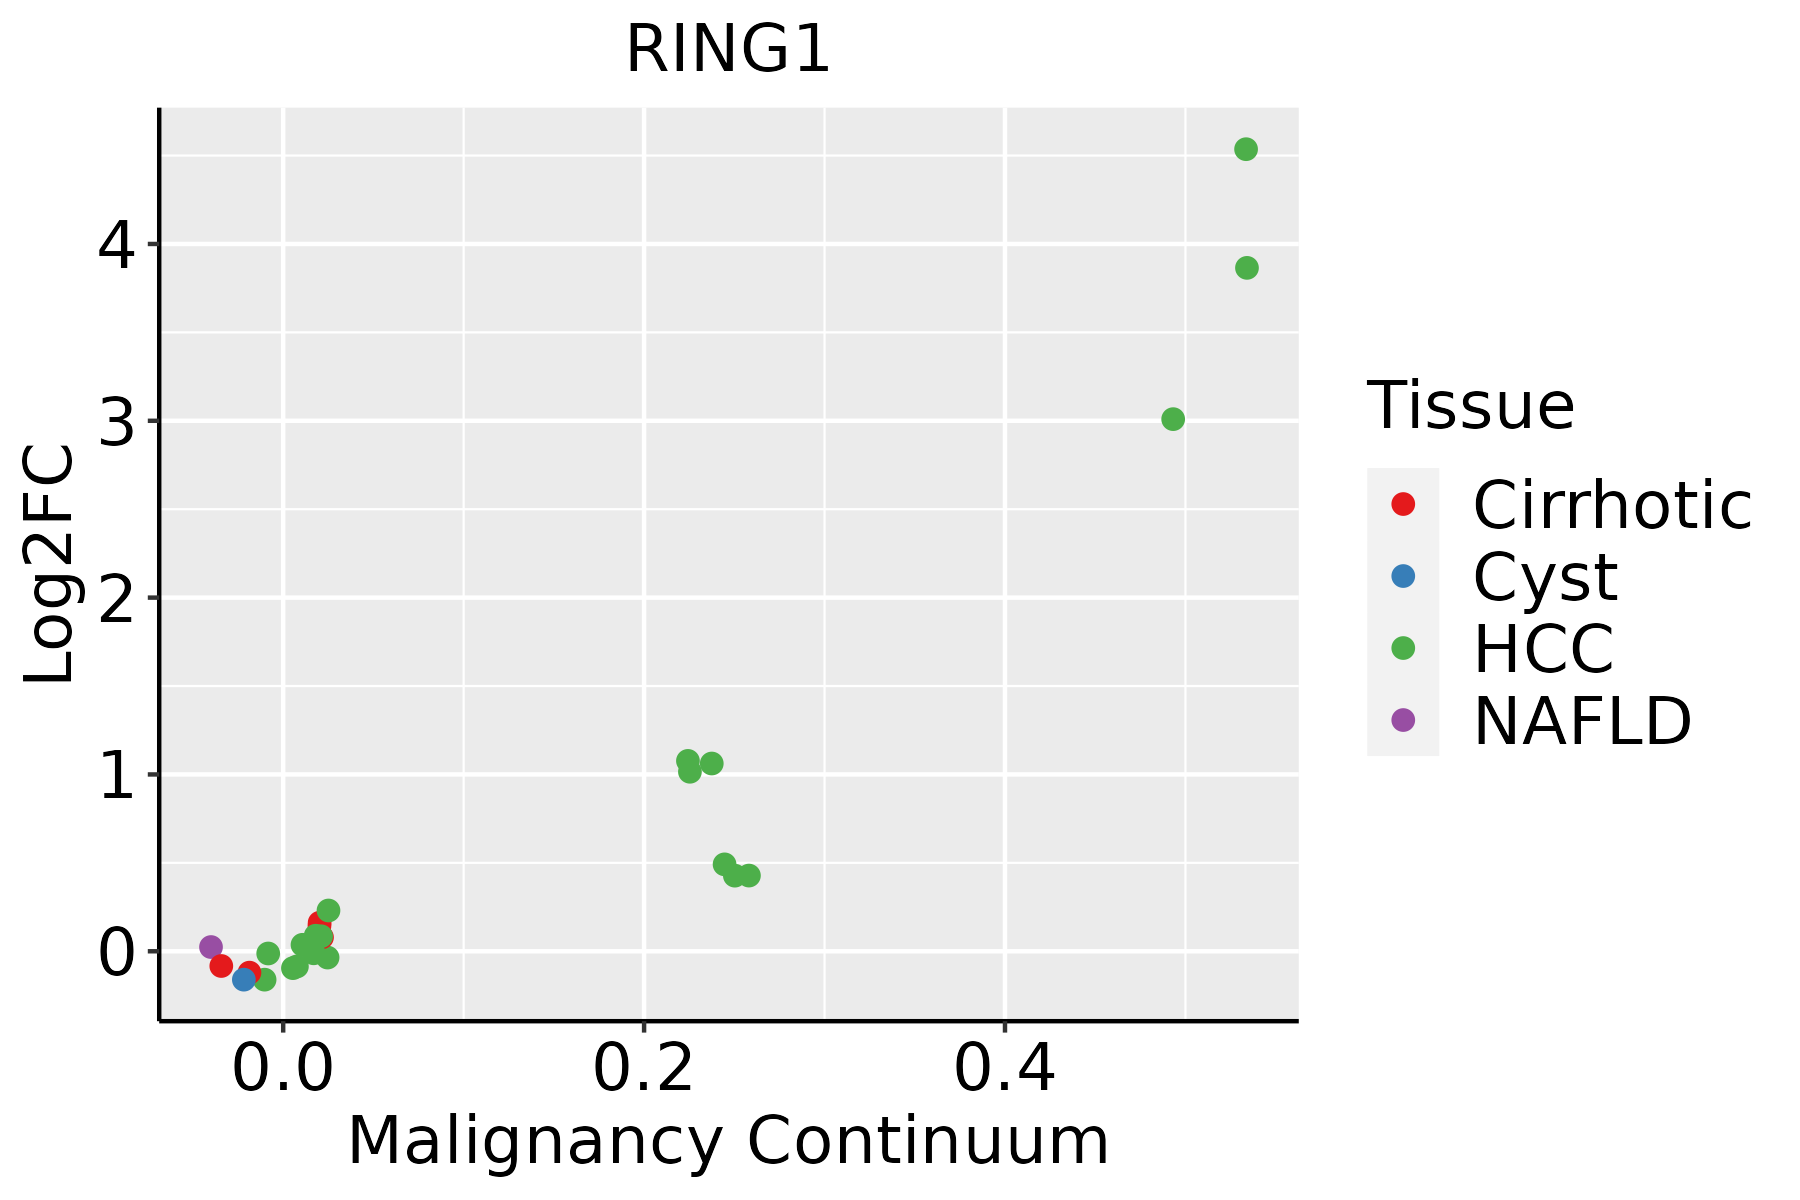 | HCC: Hepatocellular carcinoma |
| NAFLD: Non-alcoholic fatty liver disease | ||
| Oral Cavity | 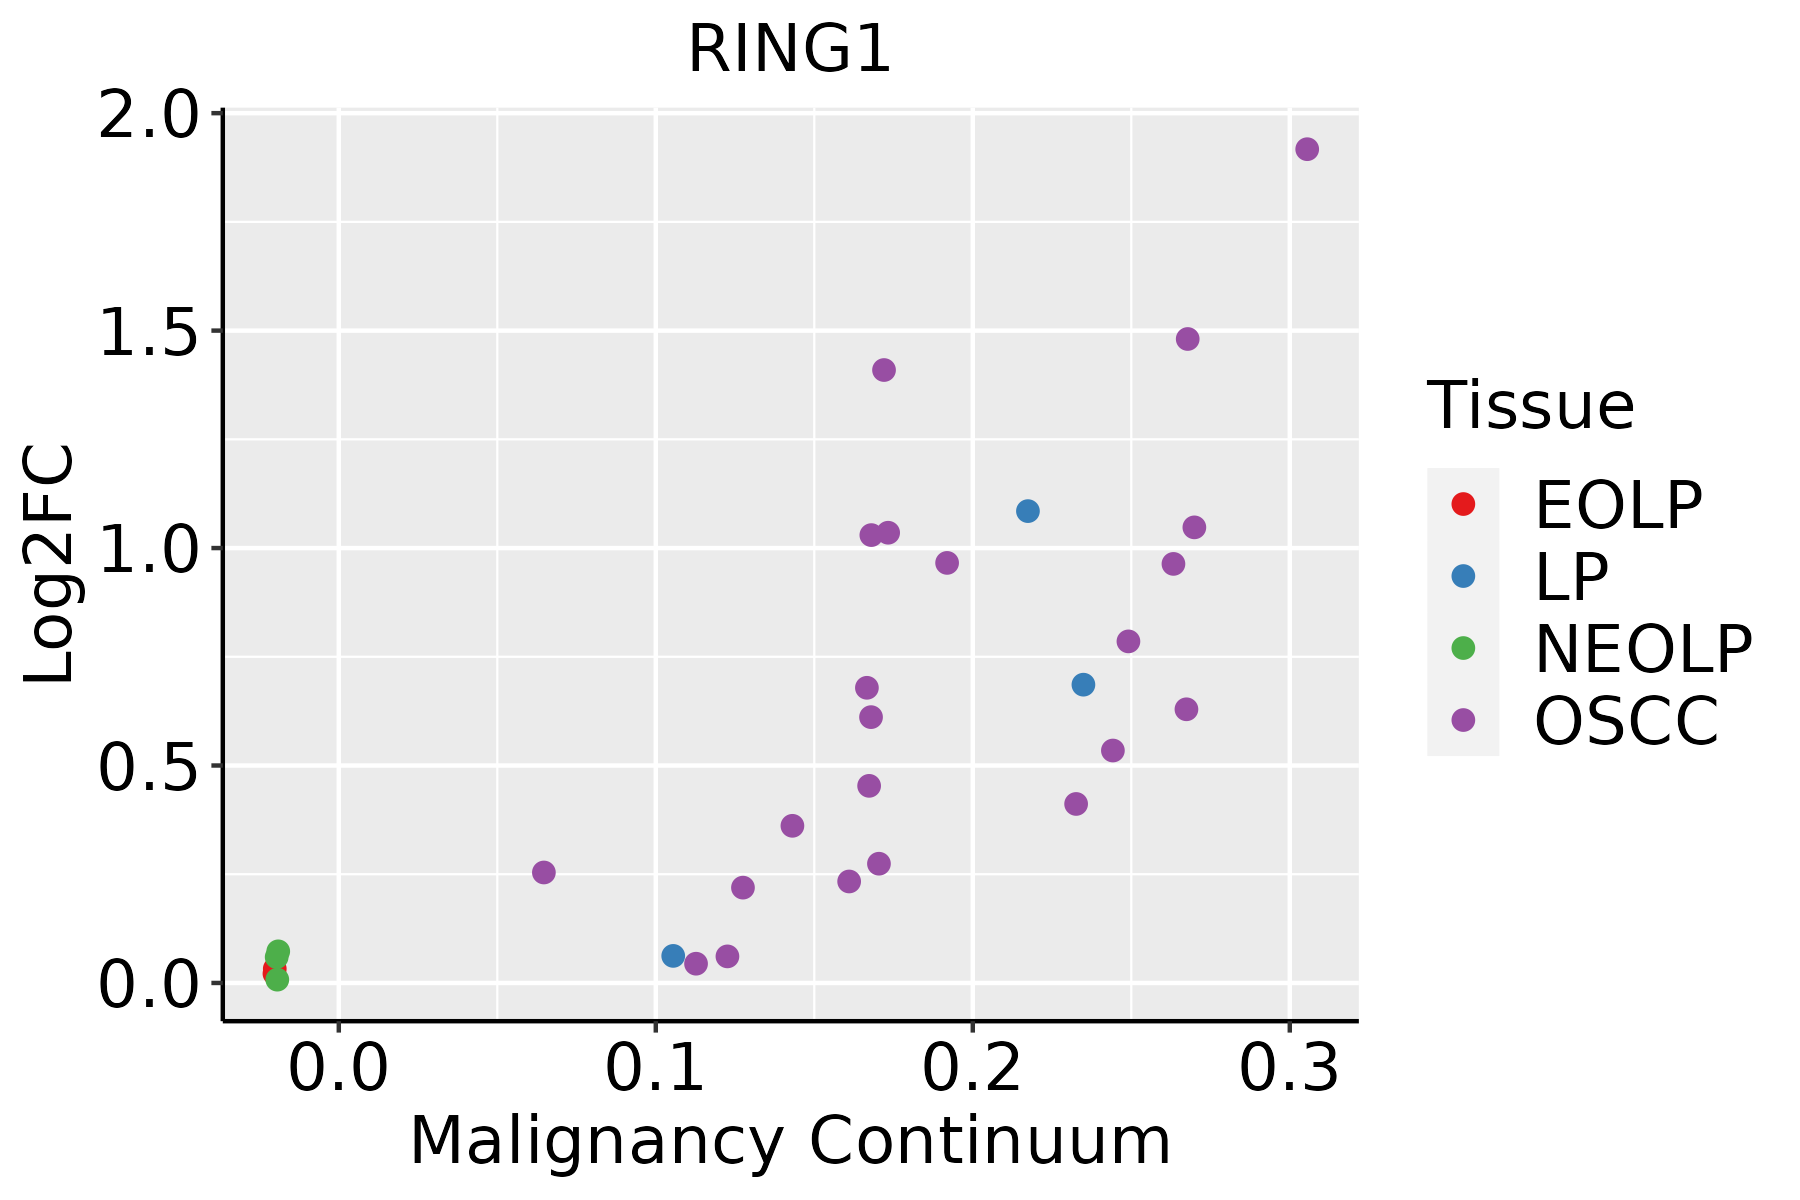 | EOLP: Erosive Oral lichen planus |
| LP: leukoplakia | ||
| NEOLP: Non-erosive oral lichen planus | ||
| OSCC: Oral squamous cell carcinoma | ||
| Skin | 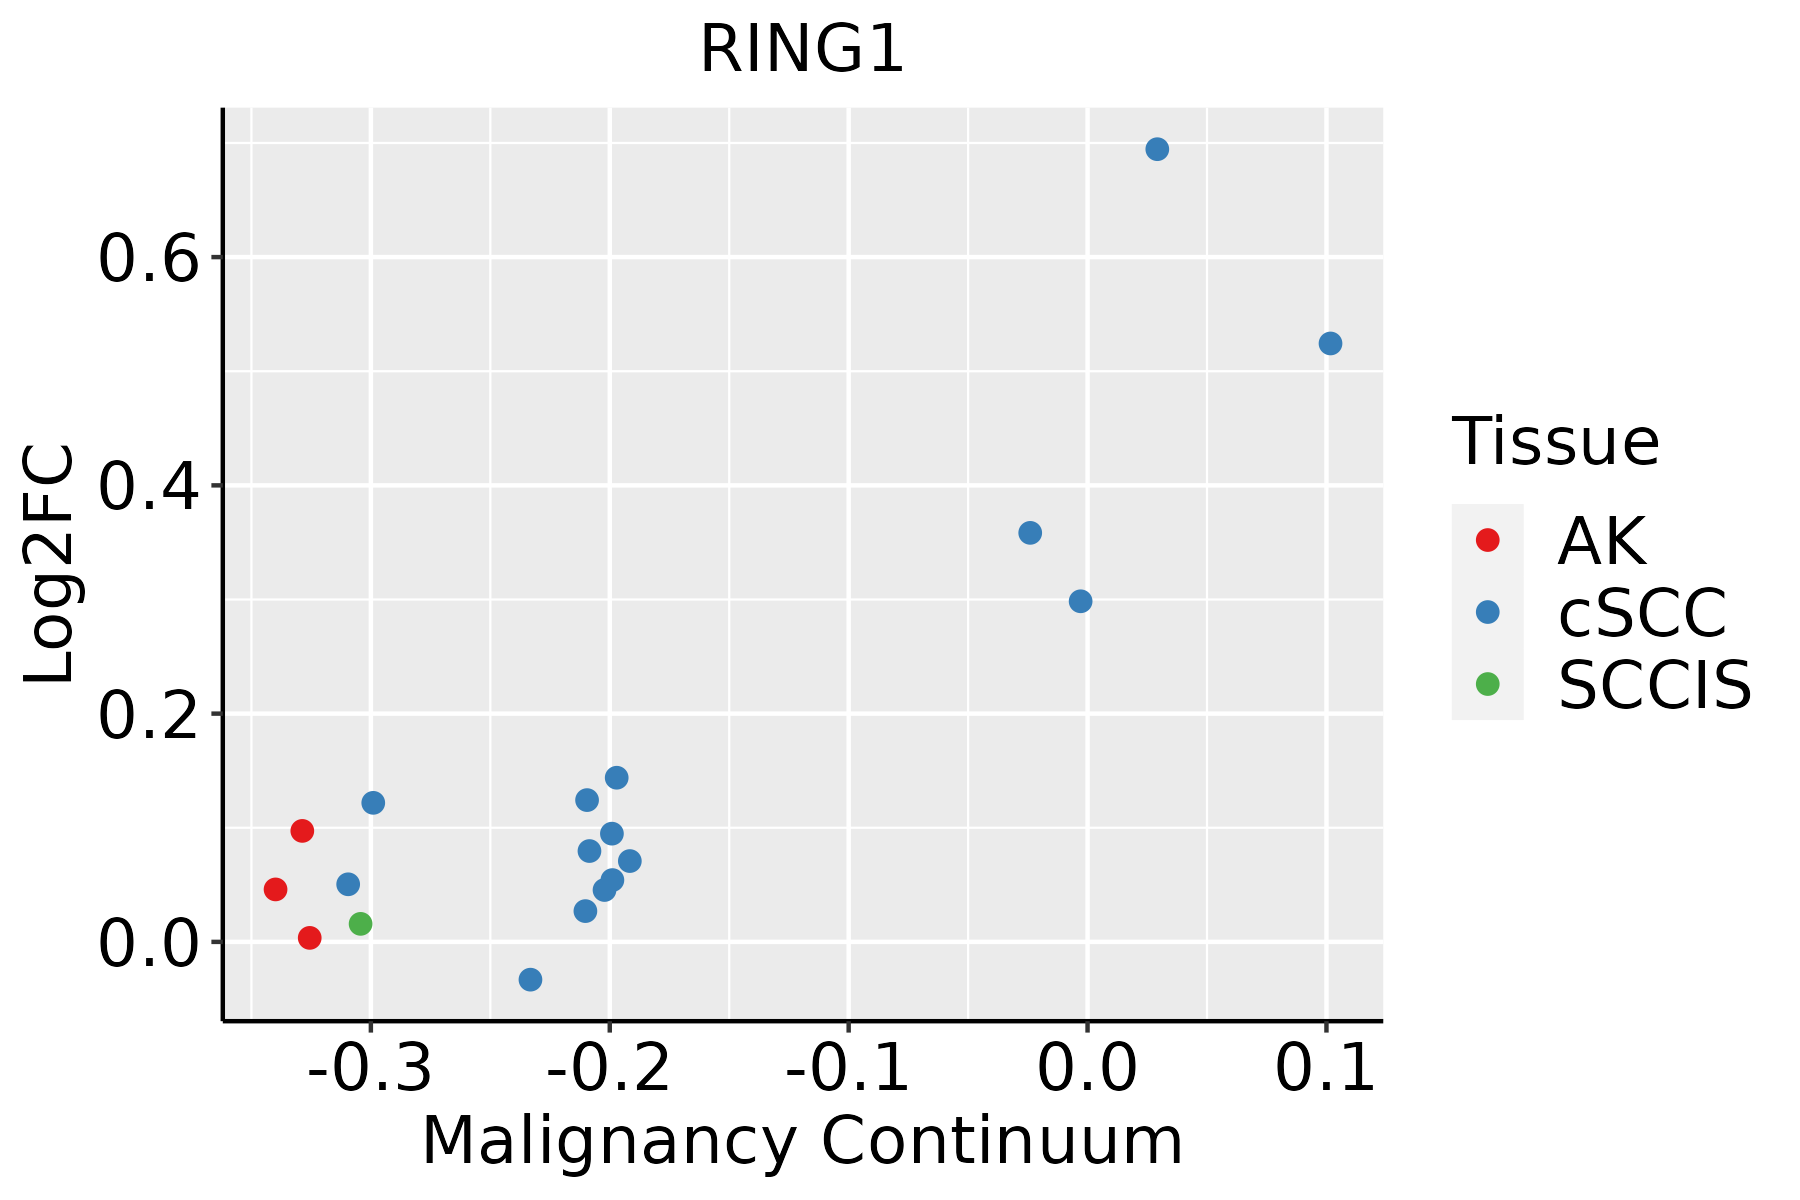 | AK: Actinic keratosis |
| cSCC: Cutaneous squamous cell carcinoma | ||
| SCCIS:squamous cell carcinoma in situ | ||
| Thyroid | 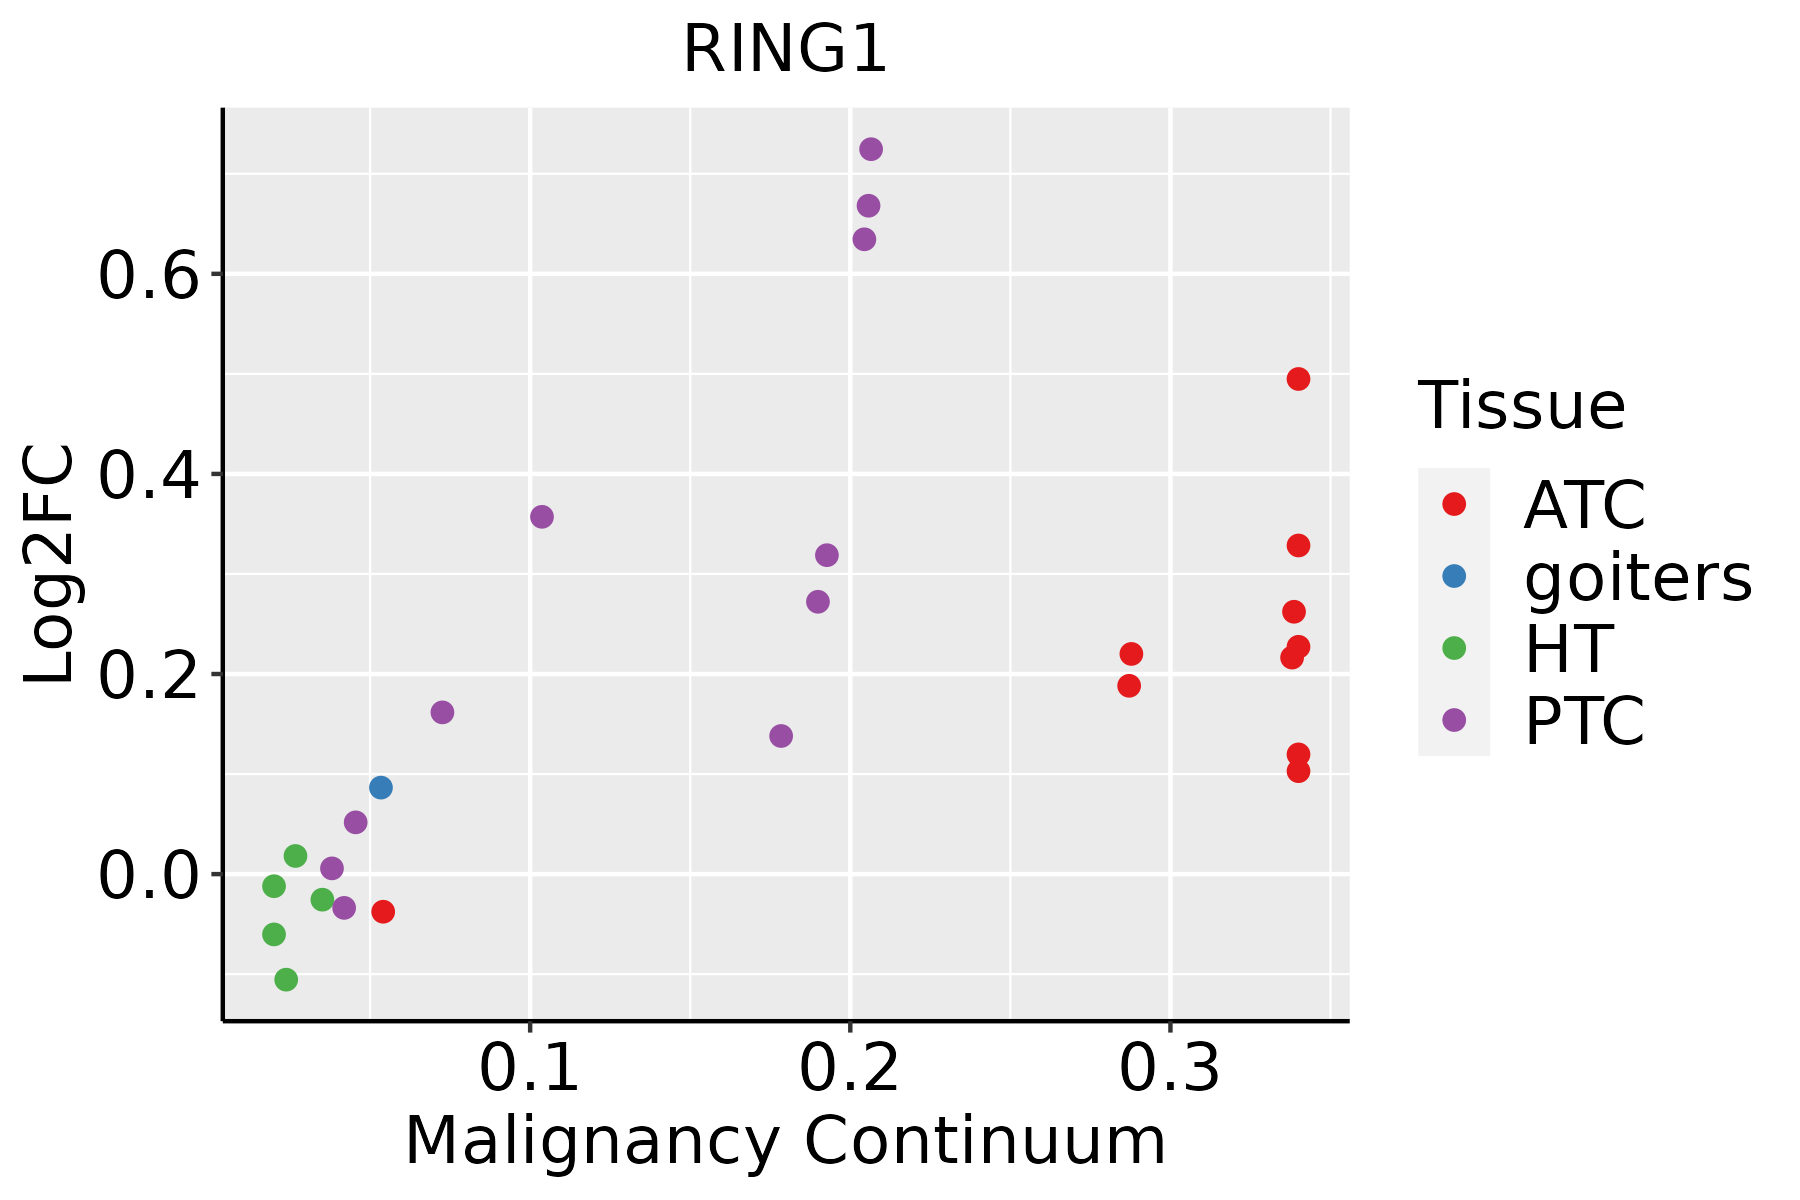 | ATC: Anaplastic thyroid cancer |
| HT: Hashimoto's thyroiditis | ||
| PTC: Papillary thyroid cancer |
| ∗log2FC in expression of this searched gene in stem-like cells from each diseased tissue sample relative to stem-like cells in normal samples in each tissue plotted against the malignancy continuum. Samples are colored based on if they are from different disease stage. |
Top |
Malignant transformation related pathway analysis |
| Find out the enriched GO biological processes and KEGG pathways involved in transition from healthy to precancer to cancer |
| Tissue | Disease Stage | Enriched GO biological Processes |
| Colorectum | AD |  |
| Colorectum | SER |  |
| Colorectum | MSS |  |
| Colorectum | MSI-H |  |
| Colorectum | FAP |  |
| ∗Top 15 enriched GO BP terms are showed in the bar plot of each disease state in each tissue. Each row represents a significant GO biological process which is colored according to the -log10(p.adjust). |
| Page: 1 2 3 4 5 6 7 8 9 |
| GO ID | Tissue | Disease Stage | Description | Gene Ratio | Bg Ratio | pvalue | p.adjust | Count |
| GO:0006984 | Colorectum | AD | ER-nucleus signaling pathway | 21/3918 | 46/18723 | 1.47e-04 | 2.08e-03 | 21 |
| GO:0032933 | Colorectum | AD | SREBP signaling pathway | 9/3918 | 15/18723 | 1.11e-03 | 1.01e-02 | 9 |
| GO:0071501 | Colorectum | AD | cellular response to sterol depletion | 9/3918 | 16/18723 | 2.06e-03 | 1.64e-02 | 9 |
| GO:0006991 | Colorectum | AD | response to sterol depletion | 9/3918 | 18/18723 | 5.82e-03 | 3.67e-02 | 9 |
| GO:00069841 | Colorectum | SER | ER-nucleus signaling pathway | 15/2897 | 46/18723 | 2.92e-03 | 2.59e-02 | 15 |
| GO:00329331 | Colorectum | SER | SREBP signaling pathway | 7/2897 | 15/18723 | 4.30e-03 | 3.45e-02 | 7 |
| GO:00715011 | Colorectum | SER | cellular response to sterol depletion | 7/2897 | 16/18723 | 6.63e-03 | 4.69e-02 | 7 |
| GO:00165708 | Esophagus | HGIN | histone modification | 92/2587 | 463/18723 | 1.70e-04 | 3.30e-03 | 92 |
| GO:00165747 | Esophagus | HGIN | histone ubiquitination | 16/2587 | 47/18723 | 3.61e-04 | 5.68e-03 | 16 |
| GO:00335225 | Esophagus | HGIN | histone H2A ubiquitination | 10/2587 | 26/18723 | 1.60e-03 | 1.79e-02 | 10 |
| GO:001657015 | Esophagus | ESCC | histone modification | 323/8552 | 463/18723 | 2.61e-26 | 7.88e-24 | 323 |
| GO:00065136 | Esophagus | ESCC | protein monoubiquitination | 53/8552 | 67/18723 | 2.11e-08 | 4.03e-07 | 53 |
| GO:001657414 | Esophagus | ESCC | histone ubiquitination | 40/8552 | 47/18723 | 2.40e-08 | 4.55e-07 | 40 |
| GO:003352213 | Esophagus | ESCC | histone H2A ubiquitination | 23/8552 | 26/18723 | 6.82e-06 | 6.90e-05 | 23 |
| GO:00103904 | Esophagus | ESCC | histone monoubiquitination | 25/8552 | 29/18723 | 7.24e-06 | 7.20e-05 | 25 |
| GO:00355182 | Esophagus | ESCC | histone H2A monoubiquitination | 15/8552 | 17/18723 | 3.48e-04 | 2.03e-03 | 15 |
| GO:001657011 | Liver | Cirrhotic | histone modification | 154/4634 | 463/18723 | 1.92e-05 | 2.57e-04 | 154 |
| GO:001657411 | Liver | Cirrhotic | histone ubiquitination | 21/4634 | 47/18723 | 2.24e-03 | 1.36e-02 | 21 |
| GO:00335223 | Liver | Cirrhotic | histone H2A ubiquitination | 13/4634 | 26/18723 | 4.72e-03 | 2.48e-02 | 13 |
| GO:00065133 | Liver | Cirrhotic | protein monoubiquitination | 26/4634 | 67/18723 | 7.53e-03 | 3.57e-02 | 26 |
| Page: 1 2 3 |
| Pathway ID | Tissue | Disease Stage | Description | Gene Ratio | Bg Ratio | pvalue | p.adjust | qvalue | Count |
| Page: 1 |
Top |
Cell-cell communication analysis |
| Identification of potential cell-cell interactions between two cell types and their ligand-receptor pairs for different disease states |
| Ligand | Receptor | LRpair | Pathway | Tissue | Disease Stage |
| Page: 1 |
Top |
Single-cell gene regulatory network inference analysis |
| Find out the significant the regulons (TFs) and the target genes of each regulon across cell types for different disease states |
| TF | Cell Type | Tissue | Disease Stage | Target Gene | RSS | Regulon Activity |
| ∗The dot plots of a searched regulon are shown for all cell subpopulations in each disease state of each tissue based on the regulon specific score inferred using pySCENIC and by calculating the average expression. |
| Page: 1 |
Top |
Somatic mutation of malignant transformation related genes |
| Annotation of somatic variants for genes involved in malignant transformation |
| Hugo Symbol | Variant Class | Variant Classification | dbSNP RS | HGVSc | HGVSp | HGVSp Short | SWISSPROT | BIOTYPE | SIFT | PolyPhen | Tumor Sample Barcode | Tissue | Histology | Sex | Age | Stage | Therapy Types | Drugs | Outcome |
| RING1 | SNV | Missense_Mutation | rs73741545 | c.1004N>G | p.Glu335Gly | p.E335G | Q06587 | protein_coding | tolerated_low_confidence(0.15) | benign(0.001) | TCGA-A2-A1G4-01 | Breast | breast invasive carcinoma | Female | >=65 | III/IV | Chemotherapy | adriamycin | SD |
| RING1 | SNV | Missense_Mutation | rs536553738 | c.967N>A | p.Ala323Thr | p.A323T | Q06587 | protein_coding | tolerated(0.73) | benign(0) | TCGA-A7-A6VX-01 | Breast | breast invasive carcinoma | Female | >=65 | I/II | Chemotherapy | docetaxel | CR |
| RING1 | insertion | In_Frame_Ins | novel | c.553_554insGATCTATCCTAGCCGGGAGGAATACGAGGCCCATCA | p.Asp185delinsGlySerIleLeuAlaGlyArgAsnThrArgProIleAsn | p.D185delinsGSILAGRNTRPIN | Q06587 | protein_coding | TCGA-A8-A09B-01 | Breast | breast invasive carcinoma | Female | <65 | III/IV | Chemotherapy | 5-fluorouracil | SD | ||
| RING1 | SNV | Missense_Mutation | c.1193G>A | p.Cys398Tyr | p.C398Y | Q06587 | protein_coding | tolerated(1) | benign(0) | TCGA-MU-A51Y-01 | Cervix | cervical & endocervical cancer | Female | <65 | I/II | Unknown | Unknown | SD | |
| RING1 | SNV | Missense_Mutation | c.221N>C | p.Val74Ala | p.V74A | Q06587 | protein_coding | deleterious(0) | benign(0.298) | TCGA-A6-6141-01 | Colorectum | colon adenocarcinoma | Male | <65 | I/II | Chemotherapy | 5-fu | SD | |
| RING1 | SNV | Missense_Mutation | novel | c.674N>T | p.Gly225Val | p.G225V | Q06587 | protein_coding | tolerated(0.29) | possibly_damaging(0.514) | TCGA-AA-3526-01 | Colorectum | colon adenocarcinoma | Male | <65 | I/II | Unknown | Unknown | SD |
| RING1 | SNV | Missense_Mutation | rs748416763 | c.1112N>T | p.Ala371Val | p.A371V | Q06587 | protein_coding | tolerated(0.07) | benign(0.119) | TCGA-AA-3984-01 | Colorectum | colon adenocarcinoma | Female | <65 | I/II | Unknown | Unknown | SD |
| RING1 | SNV | Missense_Mutation | novel | c.53N>G | p.Leu18Arg | p.L18R | Q06587 | protein_coding | deleterious(0) | possibly_damaging(0.87) | TCGA-AZ-4315-01 | Colorectum | colon adenocarcinoma | Male | <65 | I/II | Unknown | Unknown | SD |
| RING1 | SNV | Missense_Mutation | c.1121N>T | p.Thr374Met | p.T374M | Q06587 | protein_coding | tolerated(0.09) | possibly_damaging(0.57) | TCGA-CK-4951-01 | Colorectum | colon adenocarcinoma | Female | >=65 | I/II | Unknown | Unknown | PD | |
| RING1 | SNV | Missense_Mutation | c.743G>T | p.Ser248Ile | p.S248I | Q06587 | protein_coding | tolerated(0.15) | possibly_damaging(0.5) | TCGA-DM-A1HA-01 | Colorectum | colon adenocarcinoma | Male | >=65 | III/IV | Unknown | Unknown | SD |
| Page: 1 2 3 4 5 6 7 |
Top |
Related drugs of malignant transformation related genes |
| Identification of chemicals and drugs interact with genes involved in malignant transfromation |
| (DGIdb 4.0) |
| Entrez ID | Symbol | Category | Interaction Types | Drug Claim Name | Drug Name | PMIDs |
| Page: 1 |

Copyright 2023-Present -The University of Texas Health Science Center at Houston |