
|
|||||
|
 | |
| |
| |
| |
| |
| |
|
Gene: RIMS2 |
Gene summary for RIMS2 |
| Gene information | Species | Human | Gene symbol | RIMS2 | Gene ID | 9699 |
| Gene name | regulating synaptic membrane exocytosis 2 | |
| Gene Alias | CRSDS | |
| Cytomap | 8q22.3 | |
| Gene Type | protein-coding | GO ID | GO:0000902 | UniProtAcc | Q9UQ26 |
Top |
Malignant transformation analysis |
| Identification of the aberrant gene expression in precancerous and cancerous lesions by comparing the gene expression of stem-like cells in diseased tissues with normal stem cells |
| Entrez ID | Symbol | Replicates | Species | Organ | Tissue | Adj P-value | Log2FC | Malignancy |
| 9699 | RIMS2 | CA_HPV_1 | Human | Cervix | CC | 3.40e-02 | -1.29e-01 | 0.0264 |
| 9699 | RIMS2 | CCI_1 | Human | Cervix | CC | 8.51e-26 | 2.19e+00 | 0.528 |
| 9699 | RIMS2 | CCI_3 | Human | Cervix | CC | 2.82e-10 | 1.06e+00 | 0.516 |
| 9699 | RIMS2 | CCII_1 | Human | Cervix | CC | 1.31e-05 | 4.17e-01 | 0.3249 |
| 9699 | RIMS2 | HTA12-15-2 | Human | Pancreas | PDAC | 1.28e-15 | 1.17e+00 | 0.2315 |
| 9699 | RIMS2 | HTA12-16-2 | Human | Pancreas | PDAC | 1.71e-02 | 8.77e-01 | 0.0535 |
| 9699 | RIMS2 | HTA12-23-1 | Human | Pancreas | PDAC | 7.33e-25 | 1.75e+00 | 0.3405 |
| 9699 | RIMS2 | HTA12-25-1 | Human | Pancreas | PDAC | 1.53e-25 | 1.71e+00 | 0.313 |
| 9699 | RIMS2 | HTA12-26-1 | Human | Pancreas | PDAC | 3.74e-57 | 2.11e+00 | 0.3728 |
| 9699 | RIMS2 | HTA12-29-1 | Human | Pancreas | PDAC | 6.88e-123 | 2.08e+00 | 0.3722 |
| 9699 | RIMS2 | HTA12-30-1 | Human | Pancreas | PDAC | 5.68e-12 | 2.00e+00 | 0.3671 |
| 9699 | RIMS2 | HTA12-32-1 | Human | Pancreas | PDAC | 1.71e-15 | 1.92e+00 | 0.3624 |
| 9699 | RIMS2 | HTA12-9-1 | Human | Pancreas | PDAC | 7.97e-06 | 4.76e-01 | 0.1532 |
| 9699 | RIMS2 | HTA12-9-2 | Human | Pancreas | PDAC | 4.88e-07 | 4.91e-01 | 0.0835 |
| 9699 | RIMS2 | HTA12-9-3 | Human | Pancreas | PDAC | 3.02e-08 | 8.61e-01 | 0.2045 |
| Page: 1 |
| Tissue | Expression Dynamics | Abbreviation |
| Cervix | 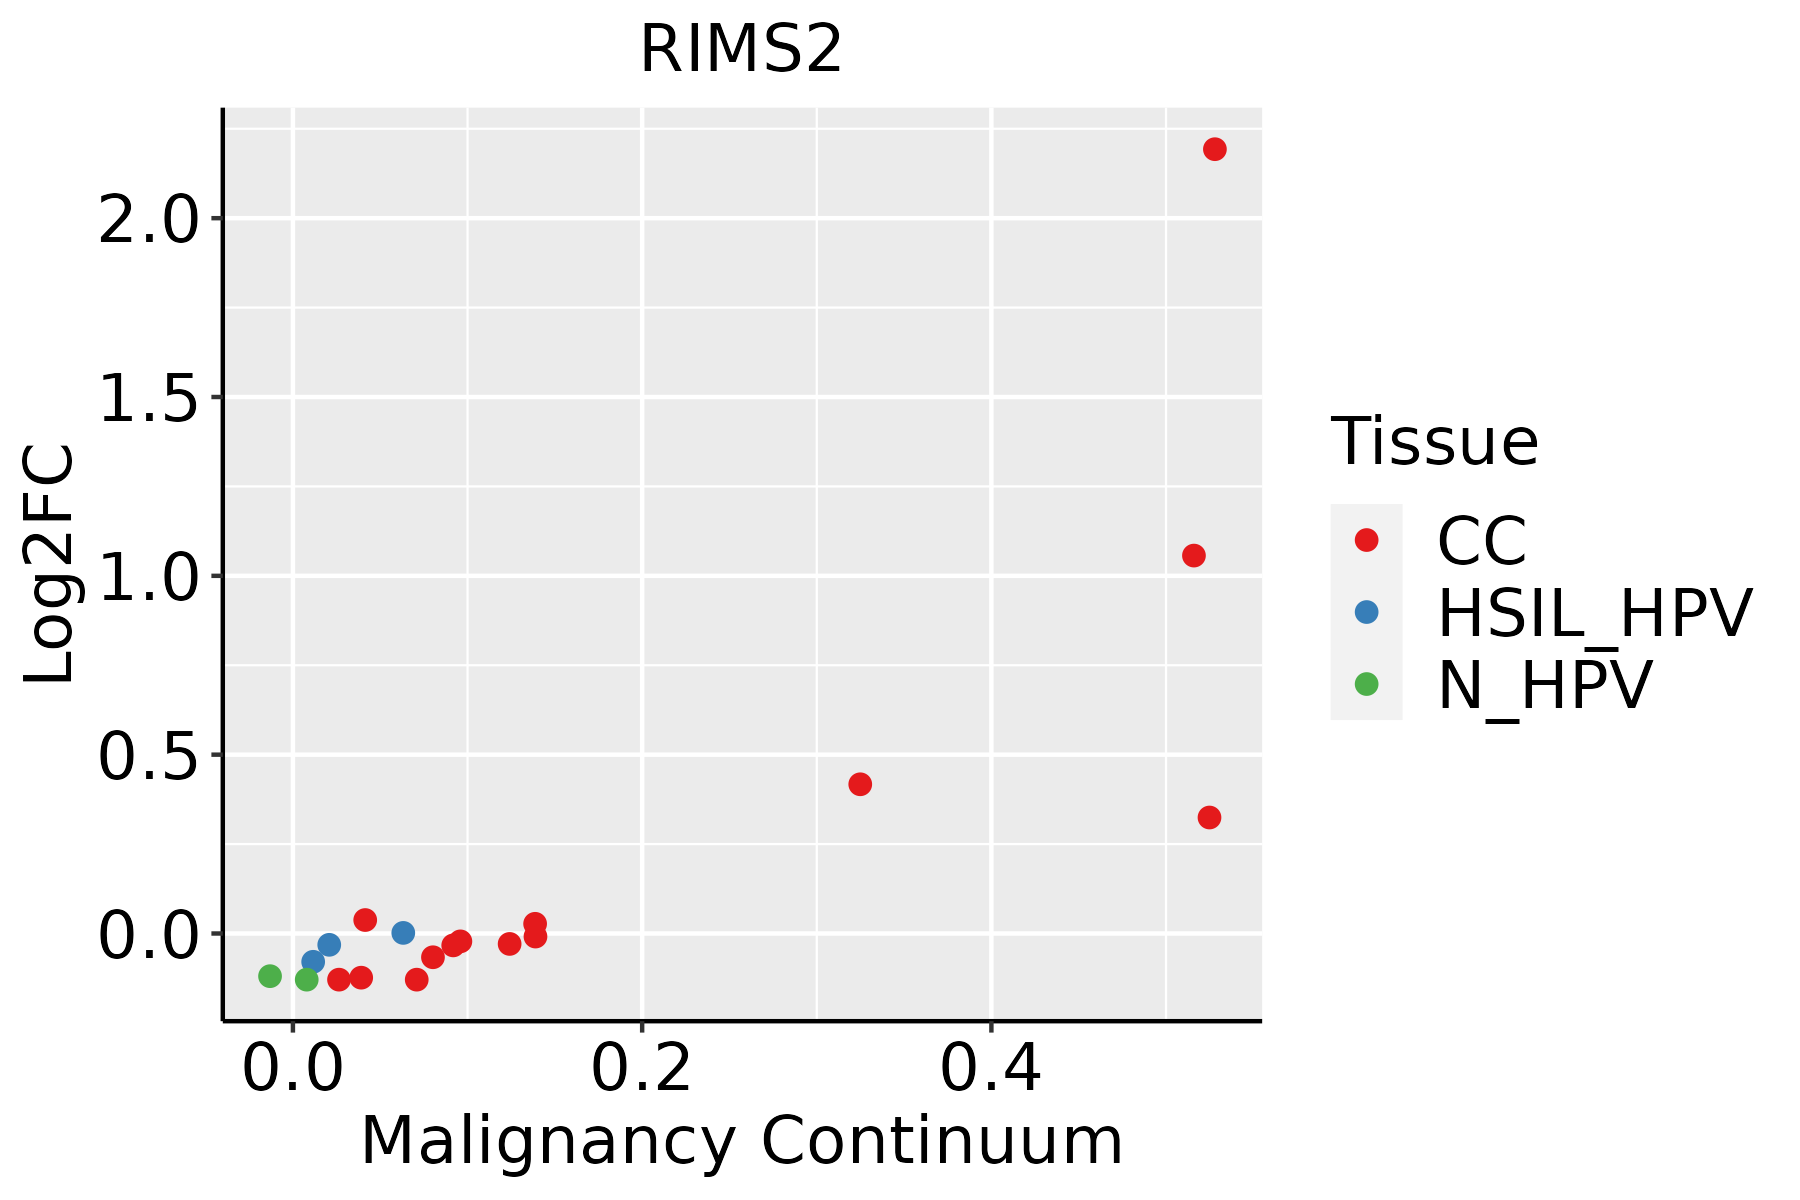 | CC: Cervix cancer |
| HSIL_HPV: HPV-infected high-grade squamous intraepithelial lesions | ||
| N_HPV: HPV-infected normal cervix |
| ∗log2FC in expression of this searched gene in stem-like cells from each diseased tissue sample relative to stem-like cells in normal samples in each tissue plotted against the malignancy continuum. Samples are colored based on if they are from different disease stage. |
Top |
Malignant transformation related pathway analysis |
| Find out the enriched GO biological processes and KEGG pathways involved in transition from healthy to precancer to cancer |
| Tissue | Disease Stage | Enriched GO biological Processes |
| Colorectum | AD |  |
| Colorectum | SER |  |
| Colorectum | MSS |  |
| Colorectum | MSI-H |  |
| Colorectum | FAP |  |
| ∗Top 15 enriched GO BP terms are showed in the bar plot of each disease state in each tissue. Each row represents a significant GO biological process which is colored according to the -log10(p.adjust). |
| Page: 1 2 3 4 5 6 7 8 9 |
| GO ID | Tissue | Disease Stage | Description | Gene Ratio | Bg Ratio | pvalue | p.adjust | Count |
| GO:002260410 | Cervix | CC | regulation of cell morphogenesis | 84/2311 | 309/18723 | 1.00e-12 | 4.29e-10 | 84 |
| GO:00160498 | Cervix | CC | cell growth | 92/2311 | 482/18723 | 1.16e-05 | 2.49e-04 | 92 |
| GO:00459277 | Cervix | CC | positive regulation of growth | 53/2311 | 259/18723 | 1.33e-04 | 1.64e-03 | 53 |
| GO:00015588 | Cervix | CC | regulation of cell growth | 77/2311 | 414/18723 | 1.40e-04 | 1.70e-03 | 77 |
| GO:00303077 | Cervix | CC | positive regulation of cell growth | 36/2311 | 166/18723 | 4.84e-04 | 4.75e-03 | 36 |
| GO:00486386 | Cervix | CC | regulation of developmental growth | 61/2311 | 330/18723 | 7.69e-04 | 6.85e-03 | 61 |
| GO:00605606 | Cervix | CC | developmental growth involved in morphogenesis | 46/2311 | 234/18723 | 8.82e-04 | 7.63e-03 | 46 |
| GO:00171574 | Cervix | CC | regulation of exocytosis | 39/2311 | 202/18723 | 2.90e-03 | 1.93e-02 | 39 |
| GO:19901385 | Cervix | CC | neuron projection extension | 34/2311 | 172/18723 | 3.52e-03 | 2.27e-02 | 34 |
| GO:00486395 | Cervix | CC | positive regulation of developmental growth | 33/2311 | 174/18723 | 7.65e-03 | 4.07e-02 | 33 |
| GO:00485886 | Cervix | CC | developmental cell growth | 42/2311 | 234/18723 | 7.88e-03 | 4.15e-02 | 42 |
| GO:00068873 | Cervix | CC | exocytosis | 59/2311 | 352/18723 | 8.74e-03 | 4.48e-02 | 59 |
| GO:00158337 | Cervix | CC | peptide transport | 46/2311 | 264/18723 | 9.69e-03 | 4.78e-02 | 46 |
| Page: 1 |
| Pathway ID | Tissue | Disease Stage | Description | Gene Ratio | Bg Ratio | pvalue | p.adjust | qvalue | Count |
| Page: 1 |
Top |
Cell-cell communication analysis |
| Identification of potential cell-cell interactions between two cell types and their ligand-receptor pairs for different disease states |
| Ligand | Receptor | LRpair | Pathway | Tissue | Disease Stage |
| Page: 1 |
Top |
Single-cell gene regulatory network inference analysis |
| Find out the significant the regulons (TFs) and the target genes of each regulon across cell types for different disease states |
| TF | Cell Type | Tissue | Disease Stage | Target Gene | RSS | Regulon Activity |
| ∗The dot plots of a searched regulon are shown for all cell subpopulations in each disease state of each tissue based on the regulon specific score inferred using pySCENIC and by calculating the average expression. |
| Page: 1 |
Top |
Somatic mutation of malignant transformation related genes |
| Annotation of somatic variants for genes involved in malignant transformation |
| Hugo Symbol | Variant Class | Variant Classification | dbSNP RS | HGVSc | HGVSp | HGVSp Short | SWISSPROT | BIOTYPE | SIFT | PolyPhen | Tumor Sample Barcode | Tissue | Histology | Sex | Age | Stage | Therapy Types | Drugs | Outcome |
| RIMS2 | SNV | Missense_Mutation | c.928N>T | p.Asp310Tyr | p.D310Y | Q9UQ26 | protein_coding | deleterious_low_confidence(0) | possibly_damaging(0.844) | TCGA-A2-A04Q-01 | Breast | breast invasive carcinoma | Female | <65 | I/II | Chemotherapy | adriamycin | SD | |
| RIMS2 | SNV | Missense_Mutation | c.2719G>T | p.Asp907Tyr | p.D907Y | Q9UQ26 | protein_coding | deleterious_low_confidence(0) | probably_damaging(0.999) | TCGA-A2-A0YH-01 | Breast | breast invasive carcinoma | Female | <65 | III/IV | Chemotherapy | adriamycin | SD | |
| RIMS2 | SNV | Missense_Mutation | c.2562A>C | p.Leu854Phe | p.L854F | Q9UQ26 | protein_coding | deleterious_low_confidence(0) | probably_damaging(0.995) | TCGA-A8-A076-01 | Breast | breast invasive carcinoma | Female | >=65 | I/II | Hormone Therapy | anastrozole | SD | |
| RIMS2 | SNV | Missense_Mutation | c.2756N>C | p.Ile919Thr | p.I919T | Q9UQ26 | protein_coding | tolerated_low_confidence(0.06) | benign(0.189) | TCGA-A8-A08R-01 | Breast | breast invasive carcinoma | Female | <65 | I/II | Unknown | Unknown | SD | |
| RIMS2 | SNV | Missense_Mutation | rs747545747 | c.2993N>A | p.Arg998Gln | p.R998Q | Q9UQ26 | protein_coding | tolerated_low_confidence(0.18) | benign(0.433) | TCGA-A8-A08R-01 | Breast | breast invasive carcinoma | Female | <65 | I/II | Unknown | Unknown | SD |
| RIMS2 | SNV | Missense_Mutation | rs375138135 | c.1760G>A | p.Arg587His | p.R587H | Q9UQ26 | protein_coding | deleterious_low_confidence(0) | probably_damaging(0.994) | TCGA-A8-A09E-01 | Breast | breast invasive carcinoma | Female | >=65 | III/IV | Hormone Therapy | anastrozole | SD |
| RIMS2 | SNV | Missense_Mutation | rs748264099 | c.1759C>T | p.Arg587Cys | p.R587C | Q9UQ26 | protein_coding | deleterious_low_confidence(0) | probably_damaging(0.997) | TCGA-AN-A0AK-01 | Breast | breast invasive carcinoma | Female | >=65 | I/II | Unknown | Unknown | SD |
| RIMS2 | SNV | Missense_Mutation | c.947N>A | p.Ser316Asn | p.S316N | Q9UQ26 | protein_coding | tolerated_low_confidence(0.52) | benign(0) | TCGA-AO-A1KR-01 | Breast | breast invasive carcinoma | Female | <65 | I/II | Chemotherapy | cyclophosphamide | SD | |
| RIMS2 | SNV | Missense_Mutation | c.2134A>G | p.Thr712Ala | p.T712A | Q9UQ26 | protein_coding | deleterious_low_confidence(0.02) | probably_damaging(0.914) | TCGA-BH-A0DS-01 | Breast | breast invasive carcinoma | Female | >=65 | III/IV | Chemotherapy | cyclophosphamide | SD | |
| RIMS2 | SNV | Missense_Mutation | c.214N>A | p.Val72Ile | p.V72I | Q9UQ26 | protein_coding | deleterious_low_confidence(0.01) | probably_damaging(0.99) | TCGA-BH-A0H9-01 | Breast | breast invasive carcinoma | Female | >=65 | I/II | Hormone Therapy | arimidex | SD |
| Page: 1 2 3 4 5 6 7 8 9 10 11 12 13 14 15 16 17 18 19 20 21 22 23 24 25 26 27 28 29 30 31 32 33 34 35 36 |
Top |
Related drugs of malignant transformation related genes |
| Identification of chemicals and drugs interact with genes involved in malignant transfromation |
| (DGIdb 4.0) |
| Entrez ID | Symbol | Category | Interaction Types | Drug Claim Name | Drug Name | PMIDs |
| Page: 1 |

Copyright 2023-Present -The University of Texas Health Science Center at Houston |