
|
|||||
|
 | |
| |
| |
| |
| |
| |
|
Gene: RIMS1 |
Gene summary for RIMS1 |
| Gene information | Species | Human | Gene symbol | RIMS1 | Gene ID | 22999 |
| Gene name | regulating synaptic membrane exocytosis 1 | |
| Gene Alias | CORD7 | |
| Cytomap | 6q13 | |
| Gene Type | protein-coding | GO ID | GO:0000003 | UniProtAcc | Q3ZCW0 |
Top |
Malignant transformation analysis |
| Identification of the aberrant gene expression in precancerous and cancerous lesions by comparing the gene expression of stem-like cells in diseased tissues with normal stem cells |
| Entrez ID | Symbol | Replicates | Species | Organ | Tissue | Adj P-value | Log2FC | Malignancy |
| 22999 | RIMS1 | RNA-P5T2-P5T2-1 | Human | Lung | MIAC | 1.16e-02 | 1.11e+00 | -0.0135 |
| 22999 | RIMS1 | RNA-P5T2-P5T2-3 | Human | Lung | MIAC | 7.36e-03 | 1.08e+00 | 0.0176 |
| 22999 | RIMS1 | RNA-P7T1-P7T1-1 | Human | Lung | AIS | 1.36e-03 | 5.43e-01 | -0.0961 |
| 22999 | RIMS1 | RNA-P7T1-P7T1-2 | Human | Lung | AIS | 1.46e-05 | 6.12e-01 | -0.0876 |
| 22999 | RIMS1 | RNA-P7T1-P7T1-3 | Human | Lung | AIS | 1.74e-03 | 5.11e-01 | -0.0822 |
| 22999 | RIMS1 | RNA-P7T1-P7T1-4 | Human | Lung | AIS | 4.67e-04 | 5.74e-01 | -0.0809 |
| Page: 1 |
| Tissue | Expression Dynamics | Abbreviation |
| Lung | 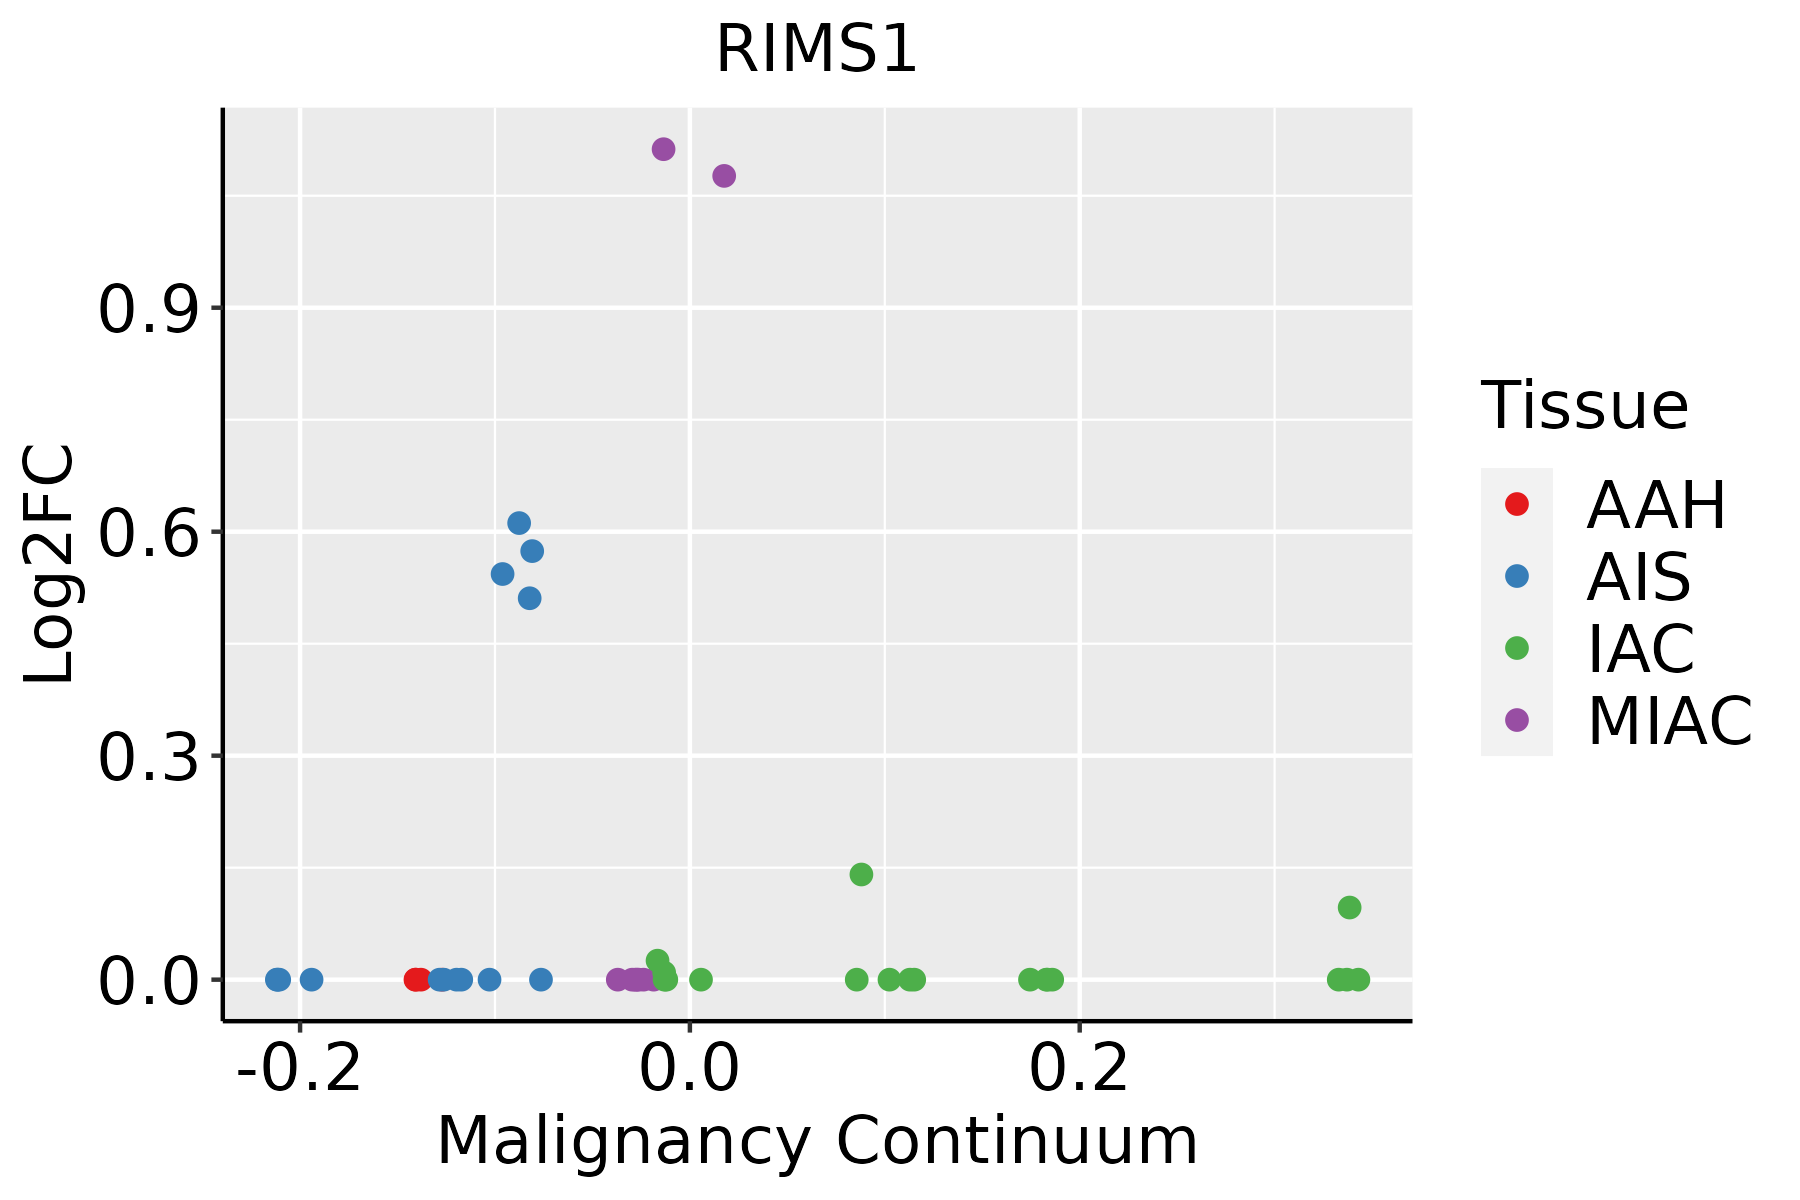 | AAH: Atypical adenomatous hyperplasia |
| AIS: Adenocarcinoma in situ | ||
| IAC: Invasive lung adenocarcinoma | ||
| MIA: Minimally invasive adenocarcinoma |
| ∗log2FC in expression of this searched gene in stem-like cells from each diseased tissue sample relative to stem-like cells in normal samples in each tissue plotted against the malignancy continuum. Samples are colored based on if they are from different disease stage. |
Top |
Malignant transformation related pathway analysis |
| Find out the enriched GO biological processes and KEGG pathways involved in transition from healthy to precancer to cancer |
| Tissue | Disease Stage | Enriched GO biological Processes |
| Colorectum | AD |  |
| Colorectum | SER |  |
| Colorectum | MSS |  |
| Colorectum | MSI-H |  |
| Colorectum | FAP |  |
| ∗Top 15 enriched GO BP terms are showed in the bar plot of each disease state in each tissue. Each row represents a significant GO biological process which is colored according to the -log10(p.adjust). |
| Page: 1 2 3 4 5 6 7 8 9 |
| GO ID | Tissue | Disease Stage | Description | Gene Ratio | Bg Ratio | pvalue | p.adjust | Count |
| GO:002260413 | Lung | AIS | regulation of cell morphogenesis | 65/1849 | 309/18723 | 2.97e-09 | 5.09e-07 | 65 |
| GO:006056012 | Lung | AIS | developmental growth involved in morphogenesis | 51/1849 | 234/18723 | 4.43e-08 | 5.24e-06 | 51 |
| GO:001604912 | Lung | AIS | cell growth | 83/1849 | 482/18723 | 3.26e-07 | 2.79e-05 | 83 |
| GO:199013812 | Lung | AIS | neuron projection extension | 38/1849 | 172/18723 | 1.57e-06 | 9.85e-05 | 38 |
| GO:004858812 | Lung | AIS | developmental cell growth | 47/1849 | 234/18723 | 1.77e-06 | 1.05e-04 | 47 |
| GO:009900311 | Lung | AIS | vesicle-mediated transport in synapse | 42/1849 | 200/18723 | 1.87e-06 | 1.10e-04 | 42 |
| GO:009950411 | Lung | AIS | synaptic vesicle cycle | 36/1849 | 181/18723 | 3.42e-05 | 1.05e-03 | 36 |
| GO:004863811 | Lung | AIS | regulation of developmental growth | 55/1849 | 330/18723 | 7.63e-05 | 1.95e-03 | 55 |
| GO:004863911 | Lung | AIS | positive regulation of developmental growth | 34/1849 | 174/18723 | 8.08e-05 | 2.02e-03 | 34 |
| GO:004592712 | Lung | AIS | positive regulation of growth | 44/1849 | 259/18723 | 2.48e-04 | 4.83e-03 | 44 |
| GO:000155812 | Lung | AIS | regulation of cell growth | 62/1849 | 414/18723 | 5.85e-04 | 9.03e-03 | 62 |
| GO:003030712 | Lung | AIS | positive regulation of cell growth | 29/1849 | 166/18723 | 1.70e-03 | 1.93e-02 | 29 |
| GO:002260432 | Lung | MIAC | regulation of cell morphogenesis | 38/967 | 309/18723 | 6.47e-07 | 9.76e-05 | 38 |
| GO:006056021 | Lung | MIAC | developmental growth involved in morphogenesis | 26/967 | 234/18723 | 1.99e-04 | 7.15e-03 | 26 |
| GO:199013821 | Lung | MIAC | neuron projection extension | 21/967 | 172/18723 | 2.21e-04 | 7.66e-03 | 21 |
| GO:004858821 | Lung | MIAC | developmental cell growth | 25/967 | 234/18723 | 4.75e-04 | 1.29e-02 | 25 |
| GO:001604922 | Lung | MIAC | cell growth | 42/967 | 482/18723 | 6.66e-04 | 1.59e-02 | 42 |
| GO:004863931 | Lung | MIAC | positive regulation of developmental growth | 19/967 | 174/18723 | 1.68e-03 | 2.83e-02 | 19 |
| GO:0051588 | Lung | MIAC | regulation of neurotransmitter transport | 13/967 | 100/18723 | 1.89e-03 | 3.02e-02 | 13 |
| GO:004863821 | Lung | MIAC | regulation of developmental growth | 30/967 | 330/18723 | 1.96e-03 | 3.12e-02 | 30 |
| Page: 1 2 |
| Pathway ID | Tissue | Disease Stage | Description | Gene Ratio | Bg Ratio | pvalue | p.adjust | qvalue | Count |
| Page: 1 |
Top |
Cell-cell communication analysis |
| Identification of potential cell-cell interactions between two cell types and their ligand-receptor pairs for different disease states |
| Ligand | Receptor | LRpair | Pathway | Tissue | Disease Stage |
| Page: 1 |
Top |
Single-cell gene regulatory network inference analysis |
| Find out the significant the regulons (TFs) and the target genes of each regulon across cell types for different disease states |
| TF | Cell Type | Tissue | Disease Stage | Target Gene | RSS | Regulon Activity |
| ∗The dot plots of a searched regulon are shown for all cell subpopulations in each disease state of each tissue based on the regulon specific score inferred using pySCENIC and by calculating the average expression. |
| Page: 1 |
Top |
Somatic mutation of malignant transformation related genes |
| Annotation of somatic variants for genes involved in malignant transformation |
| Hugo Symbol | Variant Class | Variant Classification | dbSNP RS | HGVSc | HGVSp | HGVSp Short | SWISSPROT | BIOTYPE | SIFT | PolyPhen | Tumor Sample Barcode | Tissue | Histology | Sex | Age | Stage | Therapy Types | Drugs | Outcome |
| RIMS1 | SNV | Missense_Mutation | c.4876N>A | p.Asp1626Asn | p.D1626N | Q86UR5 | protein_coding | deleterious(0) | probably_damaging(0.994) | TCGA-A8-A076-01 | Breast | breast invasive carcinoma | Female | >=65 | I/II | Hormone Therapy | anastrozole | SD | |
| RIMS1 | SNV | Missense_Mutation | novel | c.4095N>T | p.Met1365Ile | p.M1365I | Q86UR5 | protein_coding | deleterious(0.04) | benign(0.006) | TCGA-A8-A08S-01 | Breast | breast invasive carcinoma | Female | >=65 | I/II | Hormone Therapy | anastrozole | SD |
| RIMS1 | SNV | Missense_Mutation | c.2845C>A | p.His949Asn | p.H949N | Q86UR5 | protein_coding | deleterious(0) | probably_damaging(0.985) | TCGA-AC-A23H-01 | Breast | breast invasive carcinoma | Female | >=65 | I/II | Unknown | Unknown | PD | |
| RIMS1 | SNV | Missense_Mutation | c.1387N>C | p.Glu463Gln | p.E463Q | Q86UR5 | protein_coding | deleterious(0.01) | benign(0.142) | TCGA-AC-A5XS-01 | Breast | breast invasive carcinoma | Female | >=65 | I/II | Hormone Therapy | femara | SD | |
| RIMS1 | SNV | Missense_Mutation | novel | c.2458C>T | p.Arg820Cys | p.R820C | Q86UR5 | protein_coding | deleterious(0) | benign(0.031) | TCGA-AN-A046-01 | Breast | breast invasive carcinoma | Female | >=65 | I/II | Unknown | Unknown | SD |
| RIMS1 | SNV | Missense_Mutation | c.86C>G | p.Thr29Ser | p.T29S | Q86UR5 | protein_coding | deleterious(0) | probably_damaging(0.989) | TCGA-AN-A0FL-01 | Breast | breast invasive carcinoma | Female | <65 | I/II | Unknown | Unknown | SD | |
| RIMS1 | SNV | Missense_Mutation | rs376554507 | c.2608C>T | p.His870Tyr | p.H870Y | Q86UR5 | protein_coding | deleterious(0) | probably_damaging(0.976) | TCGA-AO-A0J6-01 | Breast | breast invasive carcinoma | Female | <65 | I/II | Chemotherapy | doxorubicin | SD |
| RIMS1 | SNV | Missense_Mutation | c.193G>T | p.Ala65Ser | p.A65S | Q86UR5 | protein_coding | tolerated(0.5) | benign(0.1) | TCGA-AR-A0TQ-01 | Breast | breast invasive carcinoma | Female | <65 | III/IV | Chemotherapy | doxorubicin | SD | |
| RIMS1 | SNV | Missense_Mutation | c.758N>A | p.Gly253Glu | p.G253E | Q86UR5 | protein_coding | tolerated(0.27) | benign(0.164) | TCGA-AR-A1AI-01 | Breast | breast invasive carcinoma | Female | <65 | I/II | Chemotherapy | cytoxan | PD | |
| RIMS1 | SNV | Missense_Mutation | c.3019N>A | p.Asp1007Asn | p.D1007N | Q86UR5 | protein_coding | tolerated(0.1) | benign(0.219) | TCGA-B6-A0IK-01 | Breast | breast invasive carcinoma | Female | <65 | III/IV | Unknown | Unknown | PD |
| Page: 1 2 3 4 5 6 7 8 9 10 11 12 13 14 15 16 17 18 19 20 21 22 23 24 25 26 27 28 29 30 31 |
Top |
Related drugs of malignant transformation related genes |
| Identification of chemicals and drugs interact with genes involved in malignant transfromation |
| (DGIdb 4.0) |
| Entrez ID | Symbol | Category | Interaction Types | Drug Claim Name | Drug Name | PMIDs |
| Page: 1 |

Copyright 2023-Present -The University of Texas Health Science Center at Houston |