
|
|||||
|
 | |
| |
| |
| |
| |
| |
|
Gene: RIMKLB |
Gene summary for RIMKLB |
| Gene information | Species | Human | Gene symbol | RIMKLB | Gene ID | 57494 |
| Gene name | ribosomal modification protein rimK like family member B | |
| Gene Alias | FAM80B | |
| Cytomap | 12p13.31 | |
| Gene Type | protein-coding | GO ID | GO:0006082 | UniProtAcc | Q9ULI2 |
Top |
Malignant transformation analysis |
| Identification of the aberrant gene expression in precancerous and cancerous lesions by comparing the gene expression of stem-like cells in diseased tissues with normal stem cells |
| Entrez ID | Symbol | Replicates | Species | Organ | Tissue | Adj P-value | Log2FC | Malignancy |
| 57494 | RIMKLB | CCI_3 | Human | Cervix | CC | 8.87e-09 | 5.99e-01 | 0.516 |
| 57494 | RIMKLB | H2 | Human | Cervix | HSIL_HPV | 2.57e-06 | 3.16e-01 | 0.0632 |
| 57494 | RIMKLB | AEH-subject1 | Human | Endometrium | AEH | 4.80e-07 | 5.75e-01 | -0.3059 |
| 57494 | RIMKLB | GSM6177622_NYU_UCEC3_lib1_lib1 | Human | Endometrium | EEC | 3.92e-02 | -9.55e-02 | -0.1917 |
| 57494 | RIMKLB | LZE7T | Human | Esophagus | ESCC | 7.30e-03 | 3.37e-01 | 0.0667 |
| 57494 | RIMKLB | LZE24T | Human | Esophagus | ESCC | 2.39e-04 | 2.45e-01 | 0.0596 |
| 57494 | RIMKLB | P2T-E | Human | Esophagus | ESCC | 3.20e-30 | 6.19e-01 | 0.1177 |
| 57494 | RIMKLB | P4T-E | Human | Esophagus | ESCC | 5.26e-05 | 2.38e-01 | 0.1323 |
| 57494 | RIMKLB | P5T-E | Human | Esophagus | ESCC | 6.52e-11 | 2.42e-01 | 0.1327 |
| 57494 | RIMKLB | P8T-E | Human | Esophagus | ESCC | 5.28e-13 | 2.27e-01 | 0.0889 |
| 57494 | RIMKLB | P9T-E | Human | Esophagus | ESCC | 1.40e-02 | 1.59e-02 | 0.1131 |
| 57494 | RIMKLB | P10T-E | Human | Esophagus | ESCC | 2.19e-17 | 2.47e-01 | 0.116 |
| 57494 | RIMKLB | P11T-E | Human | Esophagus | ESCC | 3.46e-05 | 1.88e-01 | 0.1426 |
| 57494 | RIMKLB | P12T-E | Human | Esophagus | ESCC | 2.63e-15 | 3.66e-01 | 0.1122 |
| 57494 | RIMKLB | P15T-E | Human | Esophagus | ESCC | 4.77e-19 | 2.88e-01 | 0.1149 |
| 57494 | RIMKLB | P16T-E | Human | Esophagus | ESCC | 4.68e-50 | 9.87e-01 | 0.1153 |
| 57494 | RIMKLB | P20T-E | Human | Esophagus | ESCC | 2.58e-08 | 8.71e-02 | 0.1124 |
| 57494 | RIMKLB | P22T-E | Human | Esophagus | ESCC | 9.70e-21 | 5.71e-01 | 0.1236 |
| 57494 | RIMKLB | P23T-E | Human | Esophagus | ESCC | 1.32e-07 | 1.50e-01 | 0.108 |
| 57494 | RIMKLB | P24T-E | Human | Esophagus | ESCC | 3.81e-14 | 2.89e-01 | 0.1287 |
| Page: 1 2 3 4 5 |
| Tissue | Expression Dynamics | Abbreviation |
| Cervix |  | CC: Cervix cancer |
| HSIL_HPV: HPV-infected high-grade squamous intraepithelial lesions | ||
| N_HPV: HPV-infected normal cervix | ||
| Endometrium | 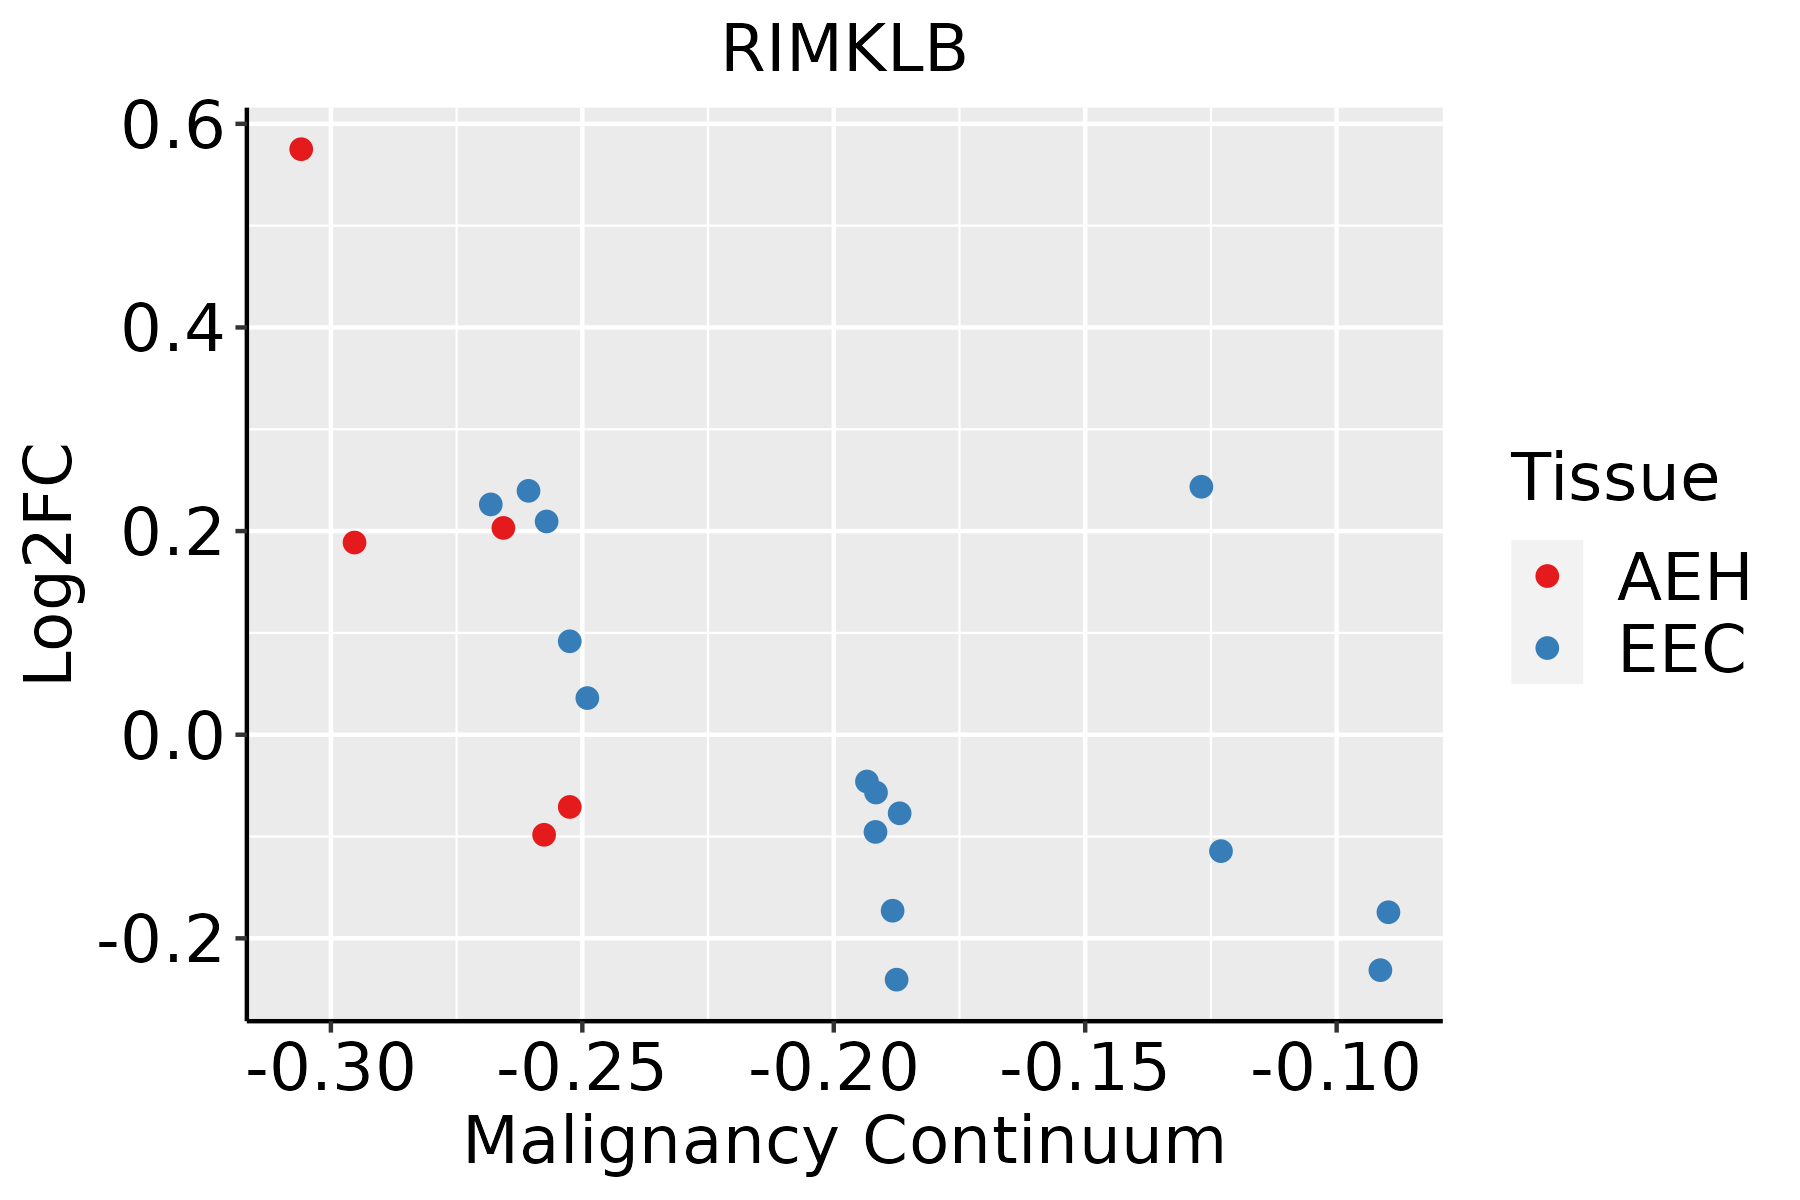 | AEH: Atypical endometrial hyperplasia |
| EEC: Endometrioid Cancer | ||
| Esophagus | 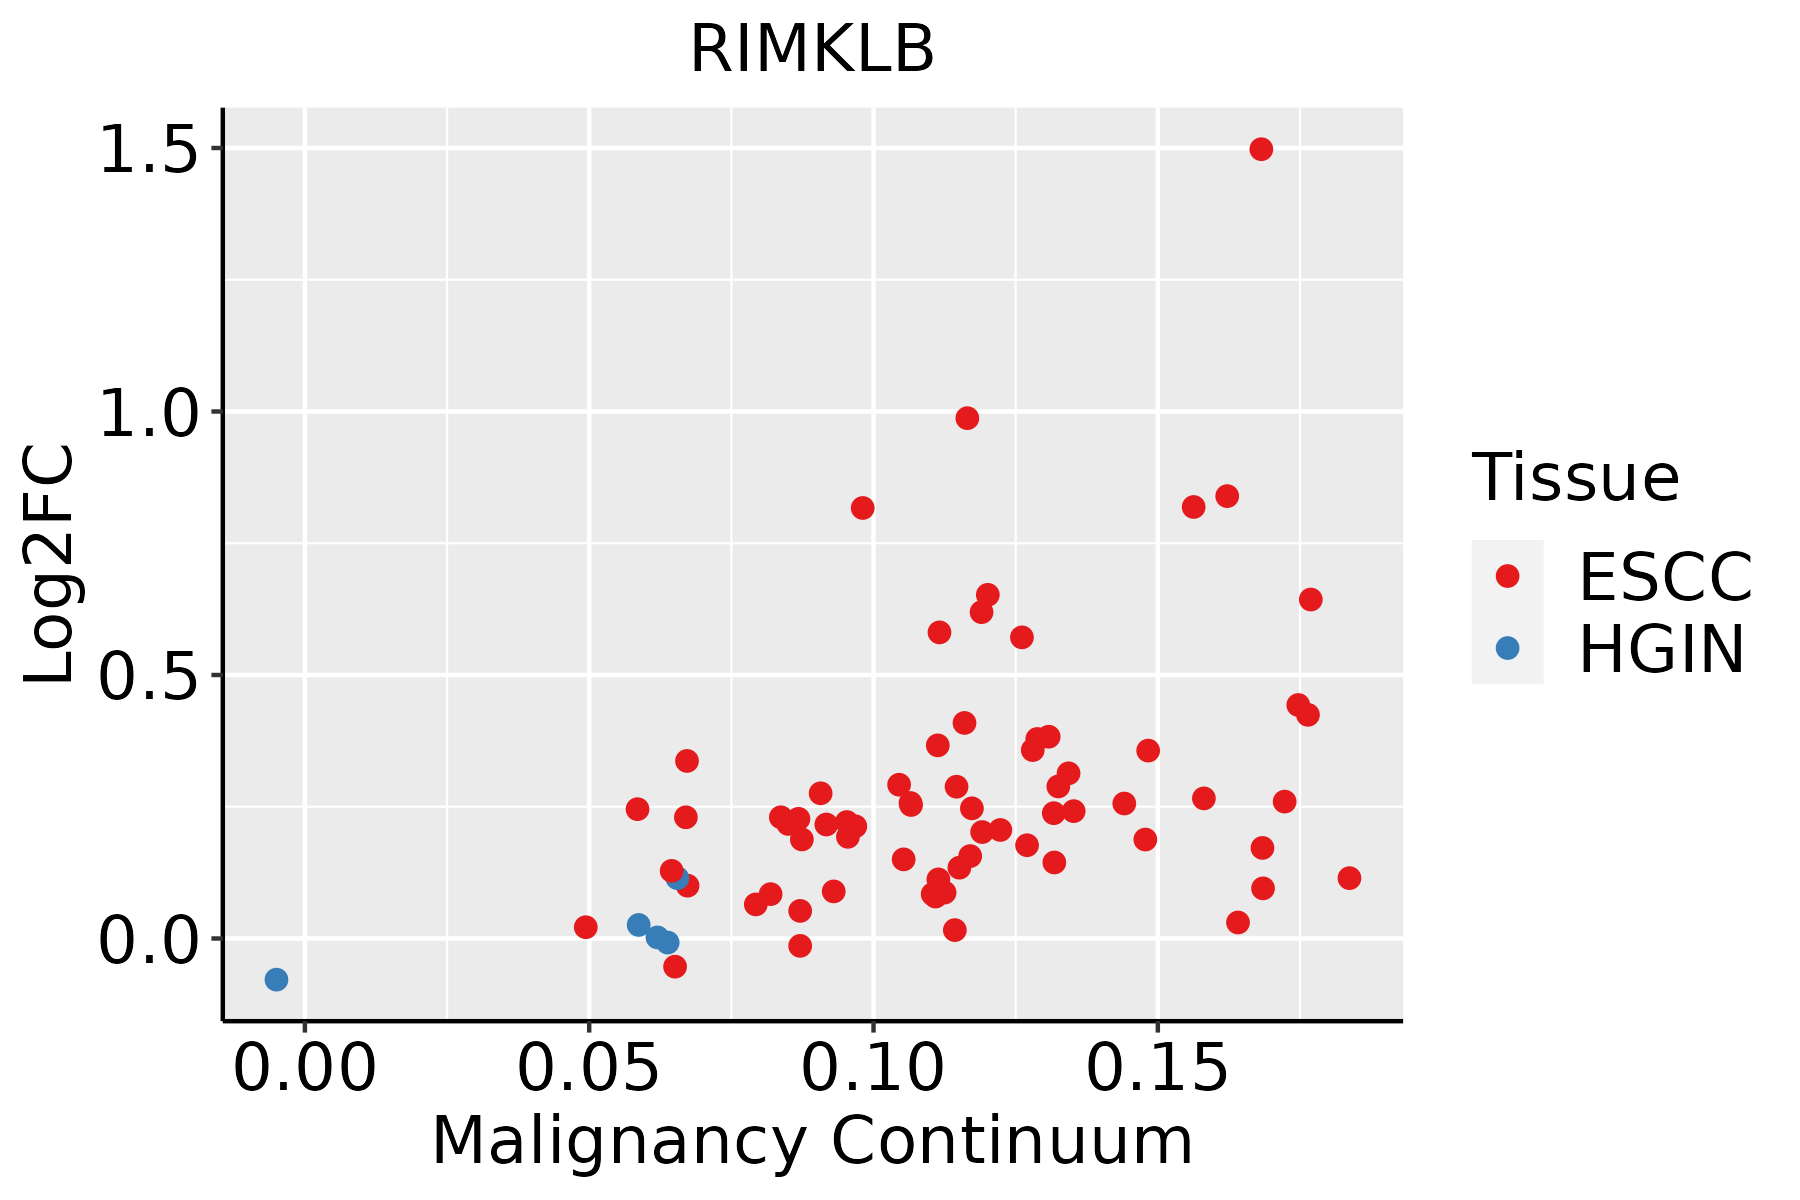 | ESCC: Esophageal squamous cell carcinoma |
| HGIN: High-grade intraepithelial neoplasias | ||
| LGIN: Low-grade intraepithelial neoplasias | ||
| Lung |  | AAH: Atypical adenomatous hyperplasia |
| AIS: Adenocarcinoma in situ | ||
| IAC: Invasive lung adenocarcinoma | ||
| MIA: Minimally invasive adenocarcinoma | ||
| Oral Cavity |  | EOLP: Erosive Oral lichen planus |
| LP: leukoplakia | ||
| NEOLP: Non-erosive oral lichen planus | ||
| OSCC: Oral squamous cell carcinoma | ||
| Thyroid |  | ATC: Anaplastic thyroid cancer |
| HT: Hashimoto's thyroiditis | ||
| PTC: Papillary thyroid cancer |
| ∗log2FC in expression of this searched gene in stem-like cells from each diseased tissue sample relative to stem-like cells in normal samples in each tissue plotted against the malignancy continuum. Samples are colored based on if they are from different disease stage. |
Top |
Malignant transformation related pathway analysis |
| Find out the enriched GO biological processes and KEGG pathways involved in transition from healthy to precancer to cancer |
| Tissue | Disease Stage | Enriched GO biological Processes |
| Colorectum | AD |  |
| Colorectum | SER |  |
| Colorectum | MSS |  |
| Colorectum | MSI-H |  |
| Colorectum | FAP |  |
| ∗Top 15 enriched GO BP terms are showed in the bar plot of each disease state in each tissue. Each row represents a significant GO biological process which is colored according to the -log10(p.adjust). |
| Page: 1 2 3 4 5 6 7 8 9 |
| GO ID | Tissue | Disease Stage | Description | Gene Ratio | Bg Ratio | pvalue | p.adjust | Count |
| Page: 1 |
| Pathway ID | Tissue | Disease Stage | Description | Gene Ratio | Bg Ratio | pvalue | p.adjust | qvalue | Count |
| Page: 1 |
Top |
Cell-cell communication analysis |
| Identification of potential cell-cell interactions between two cell types and their ligand-receptor pairs for different disease states |
| Ligand | Receptor | LRpair | Pathway | Tissue | Disease Stage |
| Page: 1 |
Top |
Single-cell gene regulatory network inference analysis |
| Find out the significant the regulons (TFs) and the target genes of each regulon across cell types for different disease states |
| TF | Cell Type | Tissue | Disease Stage | Target Gene | RSS | Regulon Activity |
| ∗The dot plots of a searched regulon are shown for all cell subpopulations in each disease state of each tissue based on the regulon specific score inferred using pySCENIC and by calculating the average expression. |
| Page: 1 |
Top |
Somatic mutation of malignant transformation related genes |
| Annotation of somatic variants for genes involved in malignant transformation |
| Hugo Symbol | Variant Class | Variant Classification | dbSNP RS | HGVSc | HGVSp | HGVSp Short | SWISSPROT | BIOTYPE | SIFT | PolyPhen | Tumor Sample Barcode | Tissue | Histology | Sex | Age | Stage | Therapy Types | Drugs | Outcome |
| RIMKLB | SNV | Missense_Mutation | c.479C>T | p.Thr160Met | p.T160M | Q9ULI2 | protein_coding | deleterious(0.02) | benign(0.019) | TCGA-BH-A0BL-01 | Breast | breast invasive carcinoma | Female | <65 | I/II | Chemotherapy | adriamycin | CR | |
| RIMKLB | SNV | Missense_Mutation | novel | c.902N>G | p.Asp301Gly | p.D301G | Q9ULI2 | protein_coding | deleterious(0.01) | probably_damaging(0.915) | TCGA-EW-A6SA-01 | Breast | breast invasive carcinoma | Male | <65 | I/II | Unknown | Unknown | SD |
| RIMKLB | insertion | Frame_Shift_Ins | novel | c.1159_1160insTCCTTATACTTGGTTTATATTATTGCAA | p.Ter387PhefsTer31 | p.*387Ffs*31 | Q9ULI2 | protein_coding | TCGA-A2-A0CP-01 | Breast | breast invasive carcinoma | Female | <65 | I/II | Chemotherapy | cytoxan | SD | ||
| RIMKLB | SNV | Missense_Mutation | c.515N>C | p.Arg172Pro | p.R172P | Q9ULI2 | protein_coding | tolerated(0.32) | probably_damaging(0.915) | TCGA-DR-A0ZM-01 | Cervix | cervical & endocervical cancer | Female | <65 | III/IV | Unspecific | Cisplatin | SD | |
| RIMKLB | SNV | Missense_Mutation | novel | c.319C>G | p.Gln107Glu | p.Q107E | Q9ULI2 | protein_coding | tolerated(0.27) | benign(0.018) | TCGA-VS-A94X-01 | Cervix | cervical & endocervical cancer | Female | <65 | I/II | Chemotherapy | cisplatin | PD |
| RIMKLB | SNV | Missense_Mutation | novel | c.184N>G | p.Ile62Val | p.I62V | Q9ULI2 | protein_coding | tolerated(1) | benign(0) | TCGA-A6-3808-01 | Colorectum | colon adenocarcinoma | Male | >=65 | I/II | Unknown | Unknown | SD |
| RIMKLB | SNV | Missense_Mutation | novel | c.94G>A | p.Ala32Thr | p.A32T | Q9ULI2 | protein_coding | tolerated(0.37) | benign(0.045) | TCGA-AA-3845-01 | Colorectum | colon adenocarcinoma | Female | >=65 | I/II | Unknown | Unknown | PD |
| RIMKLB | SNV | Missense_Mutation | novel | c.128N>T | p.Ala43Val | p.A43V | Q9ULI2 | protein_coding | tolerated(0.5) | benign(0.014) | TCGA-AA-3984-01 | Colorectum | colon adenocarcinoma | Female | <65 | I/II | Unknown | Unknown | SD |
| RIMKLB | SNV | Missense_Mutation | novel | c.460N>T | p.Pro154Ser | p.P154S | Q9ULI2 | protein_coding | deleterious(0) | probably_damaging(0.997) | TCGA-AA-3984-01 | Colorectum | colon adenocarcinoma | Female | <65 | I/II | Unknown | Unknown | SD |
| RIMKLB | SNV | Missense_Mutation | c.291N>T | p.Lys97Asn | p.K97N | Q9ULI2 | protein_coding | tolerated(0.07) | benign(0.013) | TCGA-AA-3986-01 | Colorectum | colon adenocarcinoma | Male | >=65 | I/II | Unknown | Unknown | SD |
| Page: 1 2 3 4 5 6 7 |
Top |
Related drugs of malignant transformation related genes |
| Identification of chemicals and drugs interact with genes involved in malignant transfromation |
| (DGIdb 4.0) |
| Entrez ID | Symbol | Category | Interaction Types | Drug Claim Name | Drug Name | PMIDs |
| Page: 1 |

Copyright 2023-Present -The University of Texas Health Science Center at Houston |