
|
|||||
|
 | |
| |
| |
| |
| |
| |
|
Gene: RIMKLA |
Gene summary for RIMKLA |
| Gene information | Species | Human | Gene symbol | RIMKLA | Gene ID | 284716 |
| Gene name | ribosomal modification protein rimK like family member A | |
| Gene Alias | FAM80A | |
| Cytomap | 1p34.2 | |
| Gene Type | protein-coding | GO ID | GO:0006082 | UniProtAcc | Q8IXN7 |
Top |
Malignant transformation analysis |
| Identification of the aberrant gene expression in precancerous and cancerous lesions by comparing the gene expression of stem-like cells in diseased tissues with normal stem cells |
| Entrez ID | Symbol | Replicates | Species | Organ | Tissue | Adj P-value | Log2FC | Malignancy |
| 284716 | RIMKLA | HCC1 | Human | Liver | HCC | 2.89e-04 | 7.86e-01 | 0.5336 |
| 284716 | RIMKLA | HCC2 | Human | Liver | HCC | 5.73e-23 | 2.54e+00 | 0.5341 |
| 284716 | RIMKLA | HCC5 | Human | Liver | HCC | 9.75e-18 | 9.10e-01 | 0.4932 |
| 284716 | RIMKLA | S014 | Human | Liver | HCC | 1.89e-27 | 1.14e+00 | 0.2254 |
| 284716 | RIMKLA | S015 | Human | Liver | HCC | 1.16e-28 | 1.55e+00 | 0.2375 |
| 284716 | RIMKLA | S016 | Human | Liver | HCC | 1.65e-46 | 1.76e+00 | 0.2243 |
| Page: 1 |
| Tissue | Expression Dynamics | Abbreviation |
| Liver | 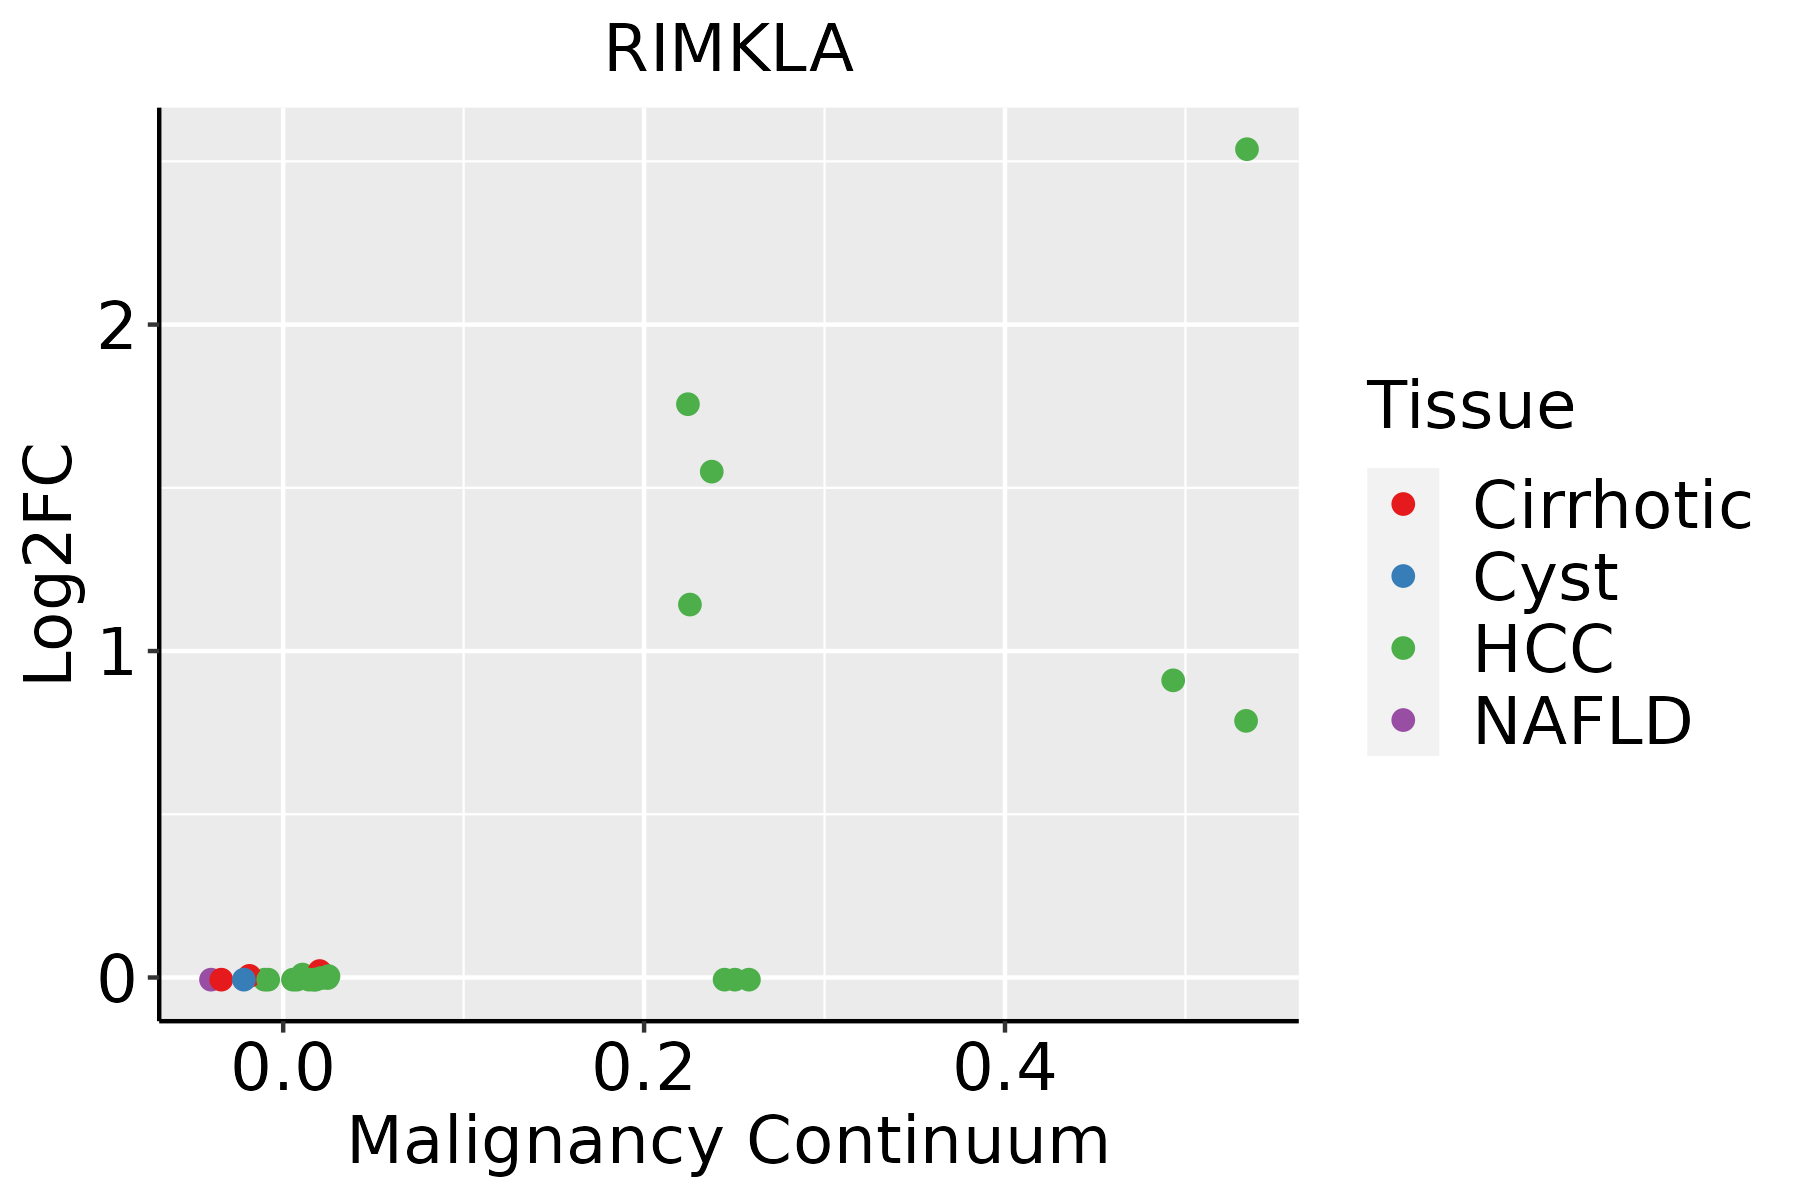 | HCC: Hepatocellular carcinoma |
| NAFLD: Non-alcoholic fatty liver disease |
| ∗log2FC in expression of this searched gene in stem-like cells from each diseased tissue sample relative to stem-like cells in normal samples in each tissue plotted against the malignancy continuum. Samples are colored based on if they are from different disease stage. |
Top |
Malignant transformation related pathway analysis |
| Find out the enriched GO biological processes and KEGG pathways involved in transition from healthy to precancer to cancer |
| Tissue | Disease Stage | Enriched GO biological Processes |
| Colorectum | AD |  |
| Colorectum | SER |  |
| Colorectum | MSS |  |
| Colorectum | MSI-H |  |
| Colorectum | FAP |  |
| ∗Top 15 enriched GO BP terms are showed in the bar plot of each disease state in each tissue. Each row represents a significant GO biological process which is colored according to the -log10(p.adjust). |
| Page: 1 2 3 4 5 6 7 8 9 |
| GO ID | Tissue | Disease Stage | Description | Gene Ratio | Bg Ratio | pvalue | p.adjust | Count |
| GO:19016052 | Liver | HCC | alpha-amino acid metabolic process | 124/7958 | 195/18723 | 2.07e-09 | 5.79e-08 | 124 |
| GO:00065202 | Liver | HCC | cellular amino acid metabolic process | 167/7958 | 284/18723 | 1.91e-08 | 4.56e-07 | 167 |
| GO:0009064 | Liver | HCC | glutamine family amino acid metabolic process | 47/7958 | 78/18723 | 1.17e-03 | 6.54e-03 | 47 |
| Page: 1 |
| Pathway ID | Tissue | Disease Stage | Description | Gene Ratio | Bg Ratio | pvalue | p.adjust | qvalue | Count |
| Page: 1 |
Top |
Cell-cell communication analysis |
| Identification of potential cell-cell interactions between two cell types and their ligand-receptor pairs for different disease states |
| Ligand | Receptor | LRpair | Pathway | Tissue | Disease Stage |
| Page: 1 |
Top |
Single-cell gene regulatory network inference analysis |
| Find out the significant the regulons (TFs) and the target genes of each regulon across cell types for different disease states |
| TF | Cell Type | Tissue | Disease Stage | Target Gene | RSS | Regulon Activity |
| ∗The dot plots of a searched regulon are shown for all cell subpopulations in each disease state of each tissue based on the regulon specific score inferred using pySCENIC and by calculating the average expression. |
| Page: 1 |
Top |
Somatic mutation of malignant transformation related genes |
| Annotation of somatic variants for genes involved in malignant transformation |
| Hugo Symbol | Variant Class | Variant Classification | dbSNP RS | HGVSc | HGVSp | HGVSp Short | SWISSPROT | BIOTYPE | SIFT | PolyPhen | Tumor Sample Barcode | Tissue | Histology | Sex | Age | Stage | Therapy Types | Drugs | Outcome |
| RIMKLA | SNV | Missense_Mutation | rs766060680 | c.638N>C | p.Met213Thr | p.M213T | Q8IXN7 | protein_coding | deleterious(0.04) | possibly_damaging(0.9) | TCGA-E2-A14N-01 | Breast | breast invasive carcinoma | Female | <65 | I/II | Chemotherapy | cyclophosphamide | SD |
| RIMKLA | SNV | Missense_Mutation | c.470G>A | p.Arg157Gln | p.R157Q | Q8IXN7 | protein_coding | tolerated(0.06) | probably_damaging(0.937) | TCGA-2W-A8YY-01 | Cervix | cervical & endocervical cancer | Female | <65 | I/II | Chemotherapy | cisplatin | CR | |
| RIMKLA | SNV | Missense_Mutation | c.242C>T | p.Ser81Leu | p.S81L | Q8IXN7 | protein_coding | tolerated(0.21) | possibly_damaging(0.576) | TCGA-Q1-A73O-01 | Cervix | cervical & endocervical cancer | Female | <65 | I/II | Chemotherapy | cisplatin | CR | |
| RIMKLA | SNV | Missense_Mutation | rs751209721 | c.643N>T | p.Arg215Cys | p.R215C | Q8IXN7 | protein_coding | deleterious(0.03) | probably_damaging(0.993) | TCGA-VS-A8EK-01 | Cervix | cervical & endocervical cancer | Female | >=65 | I/II | Chemotherapy | cisplatin | PD |
| RIMKLA | SNV | Missense_Mutation | rs746132310 | c.574G>A | p.Val192Met | p.V192M | Q8IXN7 | protein_coding | deleterious(0) | probably_damaging(0.975) | TCGA-AA-A022-01 | Colorectum | colon adenocarcinoma | Female | >=65 | I/II | Unknown | Unknown | SD |
| RIMKLA | SNV | Missense_Mutation | novel | c.893A>G | p.Tyr298Cys | p.Y298C | Q8IXN7 | protein_coding | deleterious(0) | probably_damaging(0.968) | TCGA-AG-3726-01 | Colorectum | rectum adenocarcinoma | Female | <65 | I/II | Unknown | Unknown | SD |
| RIMKLA | SNV | Missense_Mutation | rs536295712 | c.697N>A | p.Val233Ile | p.V233I | Q8IXN7 | protein_coding | tolerated(0.36) | benign(0.227) | TCGA-AG-A01L-01 | Colorectum | rectum adenocarcinoma | Male | <65 | III/IV | Chemotherapy | 5-fluorouracil | CR |
| RIMKLA | SNV | Missense_Mutation | c.946N>C | p.Gly316Arg | p.G316R | Q8IXN7 | protein_coding | tolerated_low_confidence(0.1) | benign(0.391) | TCGA-A5-A0GJ-01 | Endometrium | uterine corpus endometrioid carcinoma | Female | <65 | I/II | Chemotherapy | carboplatin | SD | |
| RIMKLA | SNV | Missense_Mutation | c.470G>A | p.Arg157Gln | p.R157Q | Q8IXN7 | protein_coding | tolerated(0.06) | probably_damaging(0.937) | TCGA-A5-A1OF-01 | Endometrium | uterine corpus endometrioid carcinoma | Female | <65 | I/II | Unknown | Unknown | SD | |
| RIMKLA | SNV | Missense_Mutation | novel | c.790N>G | p.Met264Val | p.M264V | Q8IXN7 | protein_coding | tolerated(0.28) | benign(0.029) | TCGA-A5-A2K7-01 | Endometrium | uterine corpus endometrioid carcinoma | Female | <65 | I/II | Chemotherapy | taxol | SD |
| Page: 1 2 3 4 5 |
Top |
Related drugs of malignant transformation related genes |
| Identification of chemicals and drugs interact with genes involved in malignant transfromation |
| (DGIdb 4.0) |
| Entrez ID | Symbol | Category | Interaction Types | Drug Claim Name | Drug Name | PMIDs |
| Page: 1 |

Copyright 2023-Present -The University of Texas Health Science Center at Houston |