
|
|||||
|
 | |
| |
| |
| |
| |
| |
|
Gene: RILPL1 |
Gene summary for RILPL1 |
| Gene information | Species | Human | Gene symbol | RILPL1 | Gene ID | 353116 |
| Gene name | Rab interacting lysosomal protein like 1 | |
| Gene Alias | GOSPEL | |
| Cytomap | 12q24.31 | |
| Gene Type | protein-coding | GO ID | GO:0000902 | UniProtAcc | A0A1B0GVV3 |
Top |
Malignant transformation analysis |
| Identification of the aberrant gene expression in precancerous and cancerous lesions by comparing the gene expression of stem-like cells in diseased tissues with normal stem cells |
| Entrez ID | Symbol | Replicates | Species | Organ | Tissue | Adj P-value | Log2FC | Malignancy |
| 353116 | RILPL1 | male-WTA | Human | Thyroid | PTC | 2.14e-13 | 1.04e-01 | 0.1037 |
| 353116 | RILPL1 | PTC01 | Human | Thyroid | PTC | 1.02e-06 | -8.78e-03 | 0.1899 |
| 353116 | RILPL1 | PTC04 | Human | Thyroid | PTC | 6.39e-03 | 1.93e-02 | 0.1927 |
| 353116 | RILPL1 | PTC05 | Human | Thyroid | PTC | 8.78e-07 | 1.82e-01 | 0.2065 |
| 353116 | RILPL1 | PTC06 | Human | Thyroid | PTC | 4.86e-08 | 2.85e-01 | 0.2057 |
| 353116 | RILPL1 | PTC07 | Human | Thyroid | PTC | 8.84e-26 | 2.08e-01 | 0.2044 |
| 353116 | RILPL1 | ATC12 | Human | Thyroid | ATC | 9.00e-14 | 1.63e-01 | 0.34 |
| 353116 | RILPL1 | ATC13 | Human | Thyroid | ATC | 4.87e-22 | 4.10e-01 | 0.34 |
| 353116 | RILPL1 | ATC4 | Human | Thyroid | ATC | 2.37e-12 | 2.39e-01 | 0.34 |
| 353116 | RILPL1 | ATC5 | Human | Thyroid | ATC | 1.14e-20 | 4.45e-01 | 0.34 |
| Page: 1 |
| Tissue | Expression Dynamics | Abbreviation |
| Thyroid | 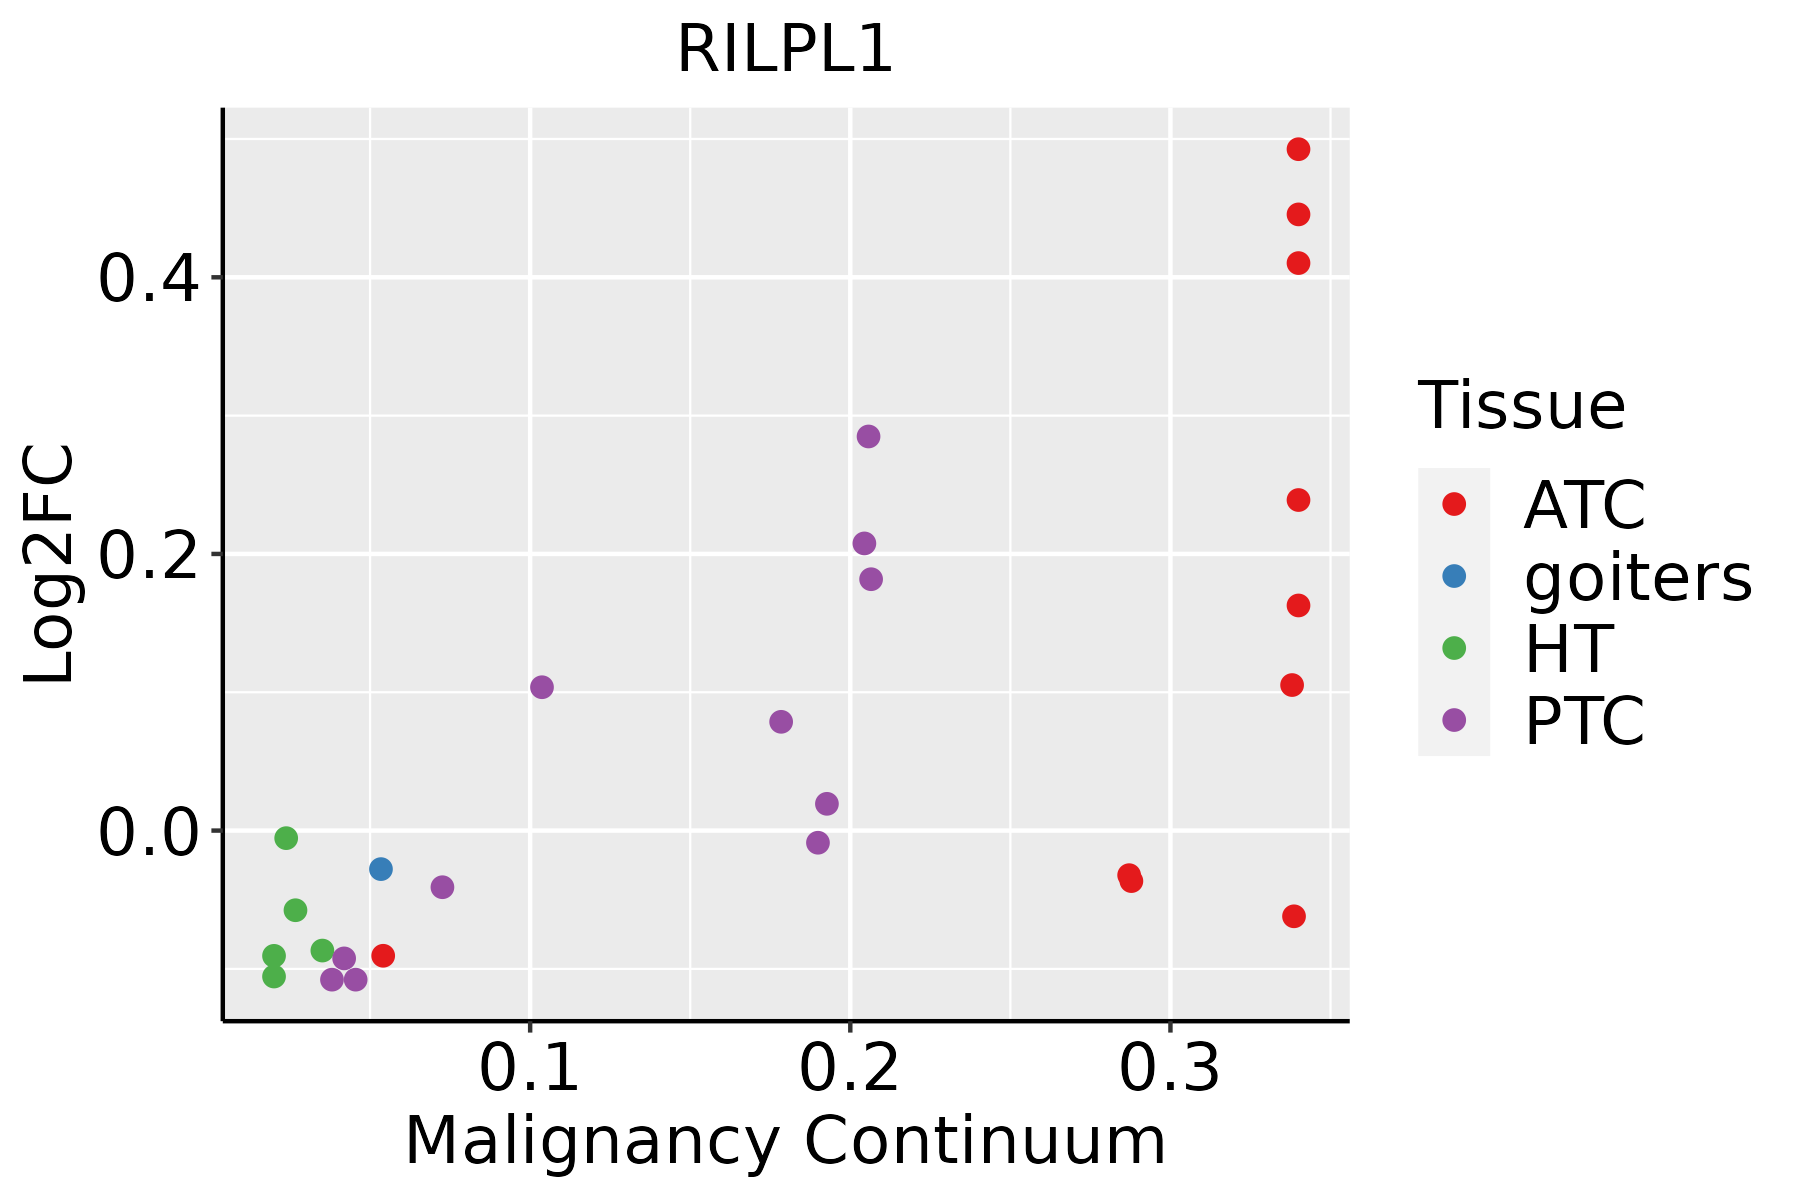 | ATC: Anaplastic thyroid cancer |
| HT: Hashimoto's thyroiditis | ||
| PTC: Papillary thyroid cancer |
| ∗log2FC in expression of this searched gene in stem-like cells from each diseased tissue sample relative to stem-like cells in normal samples in each tissue plotted against the malignancy continuum. Samples are colored based on if they are from different disease stage. |
Top |
Malignant transformation related pathway analysis |
| Find out the enriched GO biological processes and KEGG pathways involved in transition from healthy to precancer to cancer |
| Tissue | Disease Stage | Enriched GO biological Processes |
| Colorectum | AD |  |
| Colorectum | SER |  |
| Colorectum | MSS |  |
| Colorectum | MSI-H |  |
| Colorectum | FAP |  |
| ∗Top 15 enriched GO BP terms are showed in the bar plot of each disease state in each tissue. Each row represents a significant GO biological process which is colored according to the -log10(p.adjust). |
| Page: 1 2 3 4 5 6 7 8 9 |
| GO ID | Tissue | Disease Stage | Description | Gene Ratio | Bg Ratio | pvalue | p.adjust | Count |
| GO:0090150112 | Thyroid | PTC | establishment of protein localization to membrane | 149/5968 | 260/18723 | 1.64e-17 | 1.59e-15 | 149 |
| GO:0072659112 | Thyroid | PTC | protein localization to plasma membrane | 153/5968 | 284/18723 | 9.90e-15 | 6.50e-13 | 153 |
| GO:1990778111 | Thyroid | PTC | protein localization to cell periphery | 172/5968 | 333/18723 | 3.71e-14 | 2.30e-12 | 172 |
| GO:0070997113 | Thyroid | PTC | neuron death | 171/5968 | 361/18723 | 4.32e-10 | 1.38e-08 | 171 |
| GO:1901214113 | Thyroid | PTC | regulation of neuron death | 151/5968 | 319/18723 | 4.74e-09 | 1.24e-07 | 151 |
| GO:006195117 | Thyroid | PTC | establishment of protein localization to plasma membrane | 40/5968 | 60/18723 | 3.26e-08 | 7.20e-07 | 40 |
| GO:0002064112 | Thyroid | PTC | epithelial cell development | 101/5968 | 220/18723 | 8.53e-06 | 9.74e-05 | 101 |
| GO:007265928 | Thyroid | ATC | protein localization to plasma membrane | 161/6293 | 284/18723 | 8.45e-16 | 6.52e-14 | 161 |
| GO:009015031 | Thyroid | ATC | establishment of protein localization to membrane | 150/6293 | 260/18723 | 1.05e-15 | 7.96e-14 | 150 |
| GO:199077826 | Thyroid | ATC | protein localization to cell periphery | 181/6293 | 333/18723 | 3.72e-15 | 2.56e-13 | 181 |
| GO:0070997210 | Thyroid | ATC | neuron death | 176/6293 | 361/18723 | 1.43e-09 | 3.57e-08 | 176 |
| GO:190121428 | Thyroid | ATC | regulation of neuron death | 156/6293 | 319/18723 | 9.30e-09 | 1.96e-07 | 156 |
| GO:006195123 | Thyroid | ATC | establishment of protein localization to plasma membrane | 41/6293 | 60/18723 | 4.02e-08 | 7.37e-07 | 41 |
| GO:000206428 | Thyroid | ATC | epithelial cell development | 103/6293 | 220/18723 | 3.06e-05 | 2.55e-04 | 103 |
| Page: 1 |
| Pathway ID | Tissue | Disease Stage | Description | Gene Ratio | Bg Ratio | pvalue | p.adjust | qvalue | Count |
| Page: 1 |
Top |
Cell-cell communication analysis |
| Identification of potential cell-cell interactions between two cell types and their ligand-receptor pairs for different disease states |
| Ligand | Receptor | LRpair | Pathway | Tissue | Disease Stage |
| Page: 1 |
Top |
Single-cell gene regulatory network inference analysis |
| Find out the significant the regulons (TFs) and the target genes of each regulon across cell types for different disease states |
| TF | Cell Type | Tissue | Disease Stage | Target Gene | RSS | Regulon Activity |
| ∗The dot plots of a searched regulon are shown for all cell subpopulations in each disease state of each tissue based on the regulon specific score inferred using pySCENIC and by calculating the average expression. |
| Page: 1 |
Top |
Somatic mutation of malignant transformation related genes |
| Annotation of somatic variants for genes involved in malignant transformation |
| Hugo Symbol | Variant Class | Variant Classification | dbSNP RS | HGVSc | HGVSp | HGVSp Short | SWISSPROT | BIOTYPE | SIFT | PolyPhen | Tumor Sample Barcode | Tissue | Histology | Sex | Age | Stage | Therapy Types | Drugs | Outcome |
| RILPL1 | SNV | Missense_Mutation | rs757812224 | c.1074N>A | p.Ser358Arg | p.S358R | Q5EBL4 | protein_coding | deleterious(0.01) | probably_damaging(0.997) | TCGA-A2-A0CS-01 | Breast | breast invasive carcinoma | Female | >=65 | III/IV | Hormone Therapy | anastrozole | SD |
| RILPL1 | SNV | Missense_Mutation | rs757812224 | c.1074C>A | p.Ser358Arg | p.S358R | Q5EBL4 | protein_coding | deleterious(0.01) | probably_damaging(0.997) | TCGA-A2-A1G4-01 | Breast | breast invasive carcinoma | Female | >=65 | III/IV | Chemotherapy | adriamycin | SD |
| RILPL1 | SNV | Missense_Mutation | rs757812224 | c.1074N>A | p.Ser358Arg | p.S358R | Q5EBL4 | protein_coding | deleterious(0.01) | probably_damaging(0.997) | TCGA-AN-A0XR-01 | Breast | breast invasive carcinoma | Female | <65 | III/IV | Unknown | Unknown | SD |
| RILPL1 | SNV | Missense_Mutation | rs757812224 | c.1074N>A | p.Ser358Arg | p.S358R | Q5EBL4 | protein_coding | deleterious(0.01) | probably_damaging(0.997) | TCGA-D8-A1JG-01 | Breast | breast invasive carcinoma | Female | <65 | I/II | Chemotherapy | doxorubicin | SD |
| RILPL1 | SNV | Missense_Mutation | rs757812224 | c.1074N>A | p.Ser358Arg | p.S358R | Q5EBL4 | protein_coding | deleterious(0.01) | probably_damaging(0.997) | TCGA-E9-A295-01 | Breast | breast invasive carcinoma | Female | >=65 | I/II | Hormone Therapy | tamoxiphen | SD |
| RILPL1 | SNV | Missense_Mutation | c.756N>C | p.Glu252Asp | p.E252D | Q5EBL4 | protein_coding | tolerated(0.19) | benign(0.006) | TCGA-EW-A1J5-01 | Breast | breast invasive carcinoma | Female | <65 | I/II | Chemotherapy | adriamycin | SD | |
| RILPL1 | SNV | Missense_Mutation | rs199741406 | c.526G>A | p.Glu176Lys | p.E176K | Q5EBL4 | protein_coding | deleterious(0.01) | probably_damaging(0.995) | TCGA-DG-A2KJ-01 | Cervix | cervical & endocervical cancer | Female | <65 | III/IV | Chemotherapy | cisplatin | SD |
| RILPL1 | SNV | Missense_Mutation | c.619N>C | p.Asp207His | p.D207H | Q5EBL4 | protein_coding | deleterious(0) | probably_damaging(0.953) | TCGA-IR-A3LH-01 | Cervix | cervical & endocervical cancer | Female | <65 | I/II | Chemotherapy | cisplatin | CR | |
| RILPL1 | SNV | Missense_Mutation | rs757812224 | c.1074C>A | p.Ser358Arg | p.S358R | Q5EBL4 | protein_coding | deleterious(0.01) | probably_damaging(0.997) | TCGA-JX-A5QV-01 | Cervix | cervical & endocervical cancer | Female | <65 | I/II | Unknown | Unknown | SD |
| RILPL1 | SNV | Missense_Mutation | rs200694798 | c.1046C>T | p.Pro349Leu | p.P349L | Q5EBL4 | protein_coding | deleterious(0.01) | benign(0.34) | TCGA-VS-A94Z-01 | Cervix | cervical & endocervical cancer | Female | <65 | I/II | Chemotherapy | cisplatin | CR |
| Page: 1 2 3 4 |
Top |
Related drugs of malignant transformation related genes |
| Identification of chemicals and drugs interact with genes involved in malignant transfromation |
| (DGIdb 4.0) |
| Entrez ID | Symbol | Category | Interaction Types | Drug Claim Name | Drug Name | PMIDs |
| Page: 1 |

Copyright 2023-Present -The University of Texas Health Science Center at Houston |