
|
|||||
|
 | |
| |
| |
| |
| |
| |
|
Gene: RILP |
Gene summary for RILP |
| Gene information | Species | Human | Gene symbol | RILP | Gene ID | 83547 |
| Gene name | Rab interacting lysosomal protein | |
| Gene Alias | PP10141 | |
| Cytomap | 17p13.3 | |
| Gene Type | protein-coding | GO ID | GO:0006807 | UniProtAcc | Q96NA2 |
Top |
Malignant transformation analysis |
| Identification of the aberrant gene expression in precancerous and cancerous lesions by comparing the gene expression of stem-like cells in diseased tissues with normal stem cells |
| Entrez ID | Symbol | Replicates | Species | Organ | Tissue | Adj P-value | Log2FC | Malignancy |
| 83547 | RILP | HTA11_2487_2000001011 | Human | Colorectum | SER | 6.38e-06 | 3.44e-01 | -0.1808 |
| 83547 | RILP | HTA11_347_2000001011 | Human | Colorectum | AD | 4.34e-09 | 2.82e-01 | -0.1954 |
| 83547 | RILP | HTA11_411_2000001011 | Human | Colorectum | SER | 5.85e-05 | 6.68e-01 | -0.2602 |
| 83547 | RILP | HTA11_2112_2000001011 | Human | Colorectum | SER | 6.69e-04 | 3.74e-01 | -0.2196 |
| 83547 | RILP | HTA11_696_2000001011 | Human | Colorectum | AD | 1.51e-02 | 1.81e-01 | -0.1464 |
| 83547 | RILP | HTA11_866_2000001011 | Human | Colorectum | AD | 1.43e-03 | 1.54e-01 | -0.1001 |
| 83547 | RILP | HTA11_1391_2000001011 | Human | Colorectum | AD | 8.29e-04 | 2.11e-01 | -0.059 |
| 83547 | RILP | HTA11_2992_2000001011 | Human | Colorectum | SER | 2.21e-02 | 2.83e-01 | -0.1706 |
| 83547 | RILP | HTA11_5212_2000001011 | Human | Colorectum | AD | 5.93e-03 | 3.32e-01 | -0.2061 |
| 83547 | RILP | LZE24T | Human | Esophagus | ESCC | 4.90e-04 | 1.74e-01 | 0.0596 |
| 83547 | RILP | P1T-E | Human | Esophagus | ESCC | 1.72e-02 | 1.34e-01 | 0.0875 |
| 83547 | RILP | P2T-E | Human | Esophagus | ESCC | 2.03e-09 | 1.79e-01 | 0.1177 |
| 83547 | RILP | P4T-E | Human | Esophagus | ESCC | 2.06e-31 | 6.23e-01 | 0.1323 |
| 83547 | RILP | P8T-E | Human | Esophagus | ESCC | 4.17e-05 | 1.17e-01 | 0.0889 |
| 83547 | RILP | P9T-E | Human | Esophagus | ESCC | 5.72e-12 | 2.17e-01 | 0.1131 |
| 83547 | RILP | P11T-E | Human | Esophagus | ESCC | 7.50e-06 | 1.66e-01 | 0.1426 |
| 83547 | RILP | P12T-E | Human | Esophagus | ESCC | 8.56e-12 | 2.30e-01 | 0.1122 |
| 83547 | RILP | P15T-E | Human | Esophagus | ESCC | 1.55e-02 | 1.06e-01 | 0.1149 |
| 83547 | RILP | P16T-E | Human | Esophagus | ESCC | 1.85e-18 | 3.12e-01 | 0.1153 |
| 83547 | RILP | P19T-E | Human | Esophagus | ESCC | 7.36e-06 | 3.34e-01 | 0.1662 |
| Page: 1 2 3 4 |
| Tissue | Expression Dynamics | Abbreviation |
| Colorectum (GSE201348) |  | FAP: Familial adenomatous polyposis |
| CRC: Colorectal cancer | ||
| Colorectum (HTA11) |  | AD: Adenomas |
| SER: Sessile serrated lesions | ||
| MSI-H: Microsatellite-high colorectal cancer | ||
| MSS: Microsatellite stable colorectal cancer | ||
| Esophagus | 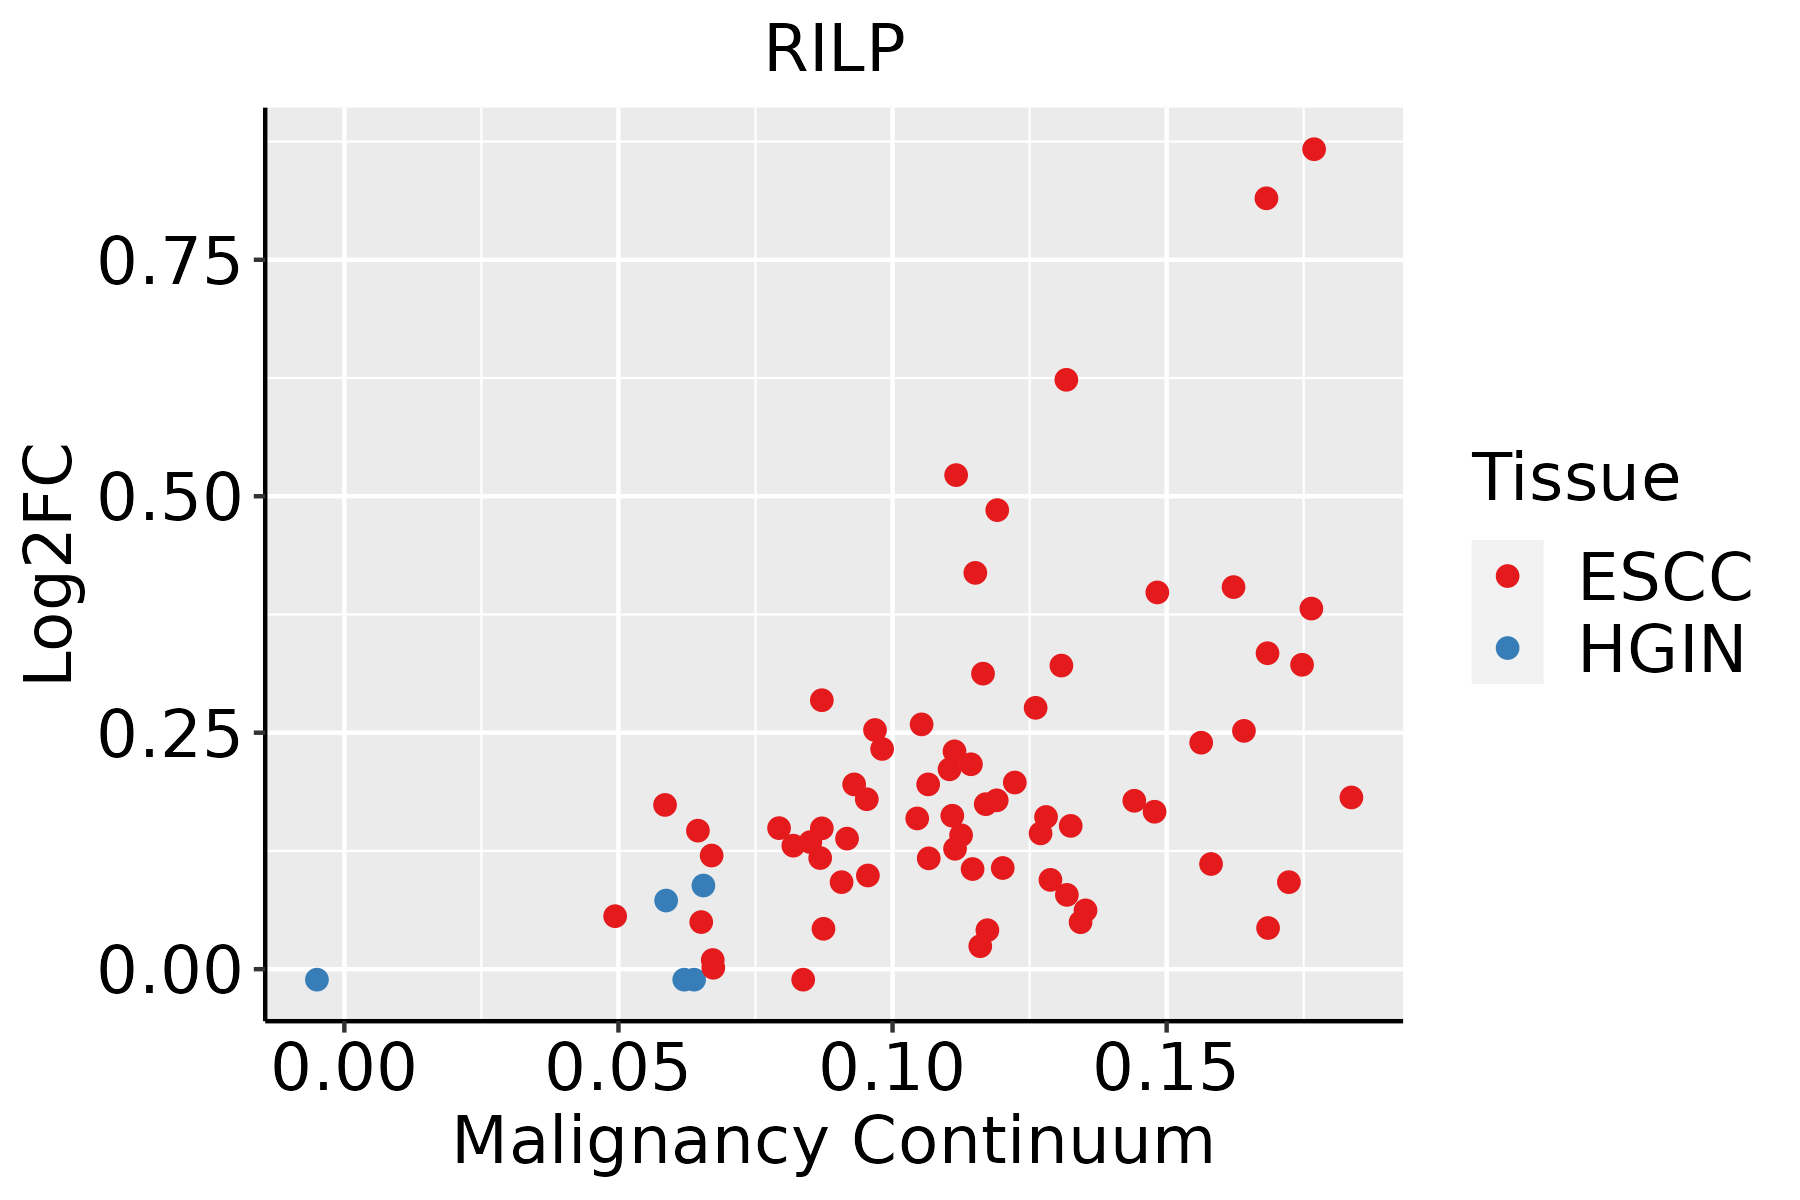 | ESCC: Esophageal squamous cell carcinoma |
| HGIN: High-grade intraepithelial neoplasias | ||
| LGIN: Low-grade intraepithelial neoplasias | ||
| Liver | 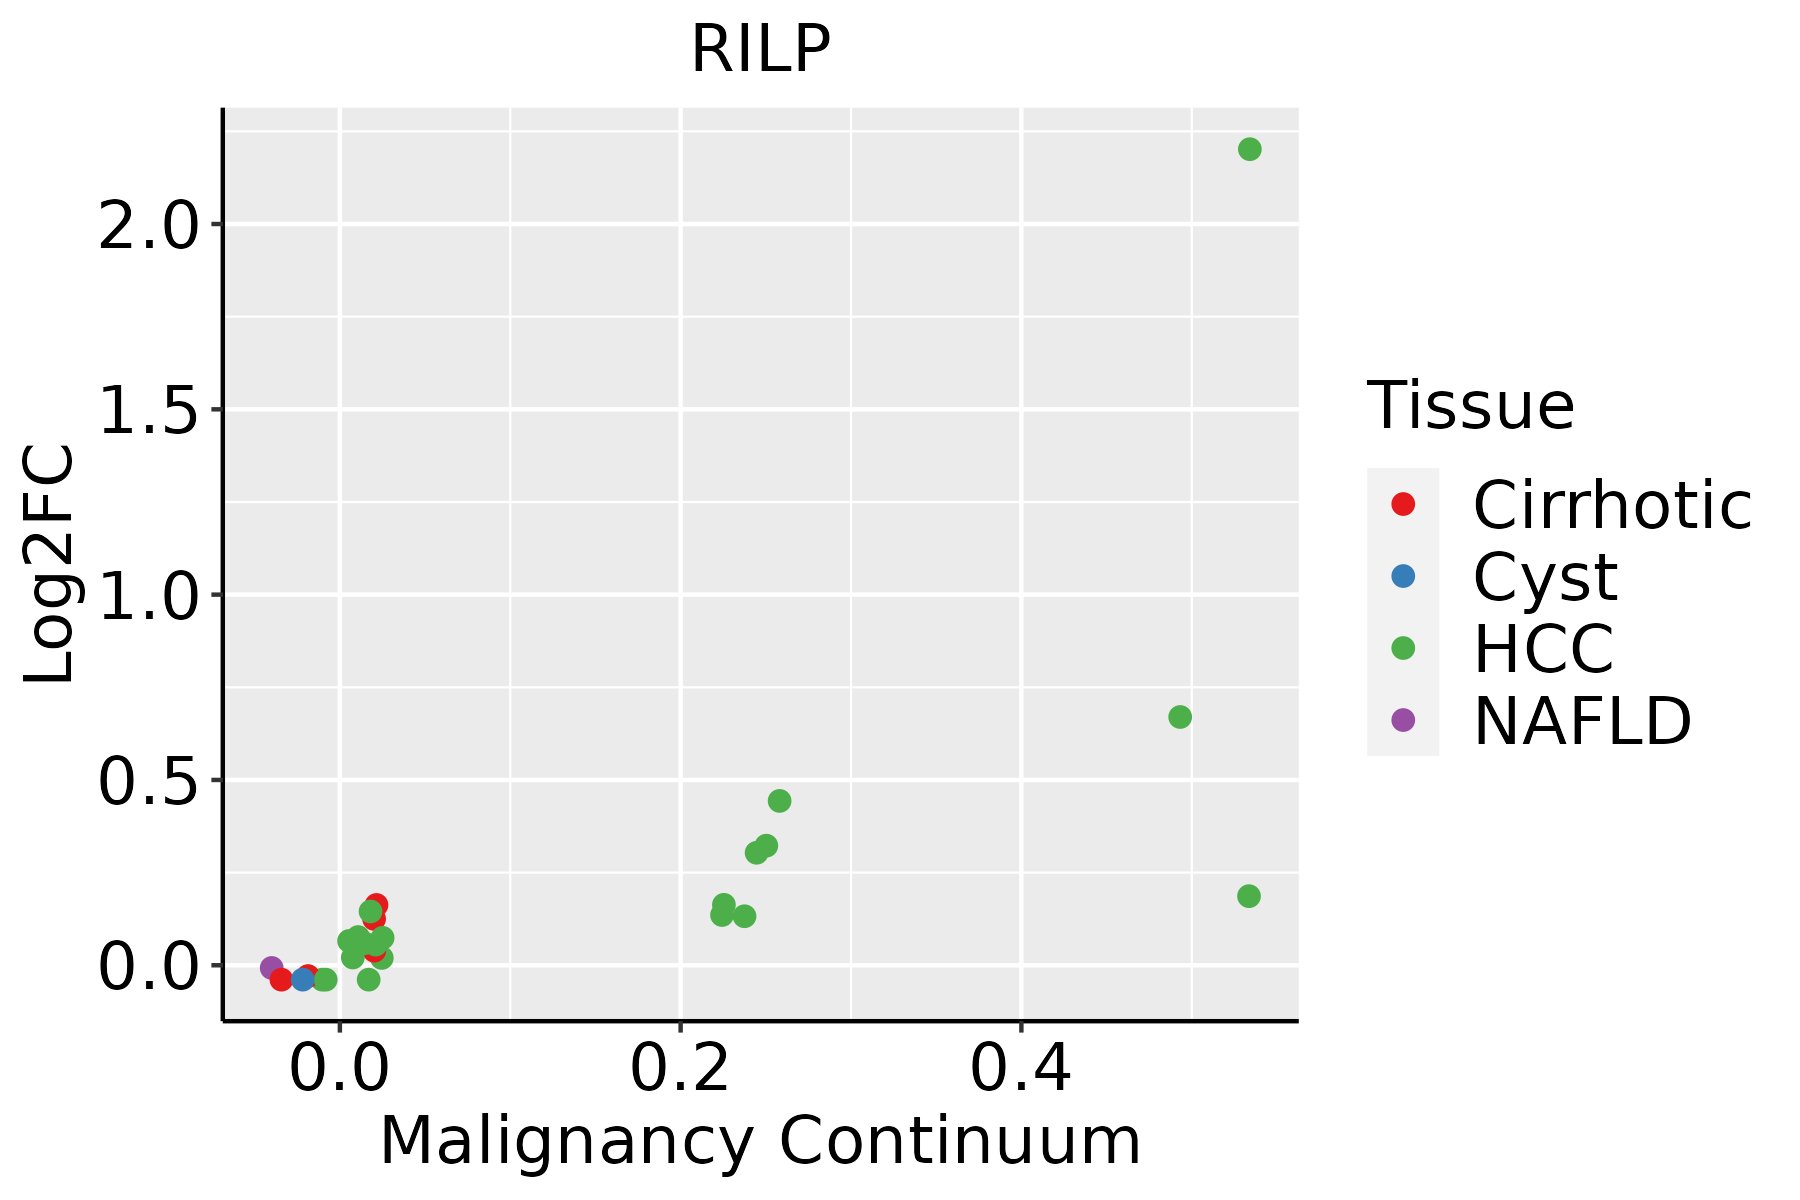 | HCC: Hepatocellular carcinoma |
| NAFLD: Non-alcoholic fatty liver disease |
| ∗log2FC in expression of this searched gene in stem-like cells from each diseased tissue sample relative to stem-like cells in normal samples in each tissue plotted against the malignancy continuum. Samples are colored based on if they are from different disease stage. |
Top |
Malignant transformation related pathway analysis |
| Find out the enriched GO biological processes and KEGG pathways involved in transition from healthy to precancer to cancer |
| Tissue | Disease Stage | Enriched GO biological Processes |
| Colorectum | AD |  |
| Colorectum | SER |  |
| Colorectum | MSS |  |
| Colorectum | MSI-H |  |
| Colorectum | FAP |  |
| ∗Top 15 enriched GO BP terms are showed in the bar plot of each disease state in each tissue. Each row represents a significant GO biological process which is colored according to the -log10(p.adjust). |
| Page: 1 2 3 4 5 6 7 8 9 |
| GO ID | Tissue | Disease Stage | Description | Gene Ratio | Bg Ratio | pvalue | p.adjust | Count |
| GO:0042176 | Colorectum | AD | regulation of protein catabolic process | 160/3918 | 391/18723 | 1.06e-19 | 7.34e-17 | 160 |
| GO:0009896 | Colorectum | AD | positive regulation of catabolic process | 180/3918 | 492/18723 | 4.33e-16 | 1.94e-13 | 180 |
| GO:0009895 | Colorectum | AD | negative regulation of catabolic process | 124/3918 | 320/18723 | 1.66e-13 | 3.35e-11 | 124 |
| GO:0032535 | Colorectum | AD | regulation of cellular component size | 142/3918 | 383/18723 | 1.74e-13 | 3.41e-11 | 142 |
| GO:0045732 | Colorectum | AD | positive regulation of protein catabolic process | 92/3918 | 231/18723 | 3.85e-11 | 4.47e-09 | 92 |
| GO:0016197 | Colorectum | AD | endosomal transport | 90/3918 | 230/18723 | 1.88e-10 | 1.73e-08 | 90 |
| GO:0042177 | Colorectum | AD | negative regulation of protein catabolic process | 55/3918 | 121/18723 | 1.19e-09 | 8.85e-08 | 55 |
| GO:0016482 | Colorectum | AD | cytosolic transport | 68/3918 | 168/18723 | 6.00e-09 | 3.72e-07 | 68 |
| GO:0006900 | Colorectum | AD | vesicle budding from membrane | 32/3918 | 61/18723 | 5.38e-08 | 2.81e-06 | 32 |
| GO:0016050 | Colorectum | AD | vesicle organization | 101/3918 | 300/18723 | 1.65e-07 | 7.17e-06 | 101 |
| GO:0007034 | Colorectum | AD | vacuolar transport | 60/3918 | 157/18723 | 4.97e-07 | 1.85e-05 | 60 |
| GO:0071985 | Colorectum | AD | multivesicular body sorting pathway | 19/3918 | 37/18723 | 4.08e-05 | 7.26e-04 | 19 |
| GO:0007032 | Colorectum | AD | endosome organization | 33/3918 | 82/18723 | 5.30e-05 | 9.01e-04 | 33 |
| GO:0007041 | Colorectum | AD | lysosomal transport | 42/3918 | 114/18723 | 6.61e-05 | 1.07e-03 | 42 |
| GO:0032509 | Colorectum | AD | endosome transport via multivesicular body sorting pathway | 16/3918 | 31/18723 | 1.53e-04 | 2.16e-03 | 16 |
| GO:0098927 | Colorectum | AD | vesicle-mediated transport between endosomal compartments | 19/3918 | 43/18723 | 5.03e-04 | 5.43e-03 | 19 |
| GO:0045022 | Colorectum | AD | early endosome to late endosome transport | 17/3918 | 40/18723 | 1.66e-03 | 1.38e-02 | 17 |
| GO:00421761 | Colorectum | SER | regulation of protein catabolic process | 126/2897 | 391/18723 | 5.33e-17 | 2.52e-14 | 126 |
| GO:00325351 | Colorectum | SER | regulation of cellular component size | 115/2897 | 383/18723 | 3.04e-13 | 1.10e-10 | 115 |
| GO:00457321 | Colorectum | SER | positive regulation of protein catabolic process | 77/2897 | 231/18723 | 9.91e-12 | 1.90e-09 | 77 |
| Page: 1 2 3 4 5 6 7 |
| Pathway ID | Tissue | Disease Stage | Description | Gene Ratio | Bg Ratio | pvalue | p.adjust | qvalue | Count |
| hsa05132 | Colorectum | AD | Salmonella infection | 102/2092 | 249/8465 | 7.65e-09 | 1.28e-07 | 8.17e-08 | 102 |
| hsa051321 | Colorectum | AD | Salmonella infection | 102/2092 | 249/8465 | 7.65e-09 | 1.28e-07 | 8.17e-08 | 102 |
| hsa051322 | Colorectum | SER | Salmonella infection | 77/1580 | 249/8465 | 1.56e-06 | 2.35e-05 | 1.71e-05 | 77 |
| hsa051323 | Colorectum | SER | Salmonella infection | 77/1580 | 249/8465 | 1.56e-06 | 2.35e-05 | 1.71e-05 | 77 |
| hsa05132211 | Esophagus | ESCC | Salmonella infection | 191/4205 | 249/8465 | 6.51e-19 | 5.45e-17 | 2.79e-17 | 191 |
| hsa0414530 | Esophagus | ESCC | Phagosome | 100/4205 | 152/8465 | 3.81e-05 | 1.72e-04 | 8.82e-05 | 100 |
| hsa05132310 | Esophagus | ESCC | Salmonella infection | 191/4205 | 249/8465 | 6.51e-19 | 5.45e-17 | 2.79e-17 | 191 |
| hsa04145114 | Esophagus | ESCC | Phagosome | 100/4205 | 152/8465 | 3.81e-05 | 1.72e-04 | 8.82e-05 | 100 |
| hsa0513222 | Liver | Cirrhotic | Salmonella infection | 121/2530 | 249/8465 | 2.47e-10 | 5.13e-09 | 3.16e-09 | 121 |
| hsa0414514 | Liver | Cirrhotic | Phagosome | 73/2530 | 152/8465 | 1.61e-06 | 1.78e-05 | 1.10e-05 | 73 |
| hsa0513232 | Liver | Cirrhotic | Salmonella infection | 121/2530 | 249/8465 | 2.47e-10 | 5.13e-09 | 3.16e-09 | 121 |
| hsa0414515 | Liver | Cirrhotic | Phagosome | 73/2530 | 152/8465 | 1.61e-06 | 1.78e-05 | 1.10e-05 | 73 |
| hsa0513242 | Liver | HCC | Salmonella infection | 178/4020 | 249/8465 | 5.90e-15 | 1.98e-13 | 1.10e-13 | 178 |
| hsa0414521 | Liver | HCC | Phagosome | 93/4020 | 152/8465 | 4.27e-04 | 1.88e-03 | 1.05e-03 | 93 |
| hsa0513252 | Liver | HCC | Salmonella infection | 178/4020 | 249/8465 | 5.90e-15 | 1.98e-13 | 1.10e-13 | 178 |
| hsa0414531 | Liver | HCC | Phagosome | 93/4020 | 152/8465 | 4.27e-04 | 1.88e-03 | 1.05e-03 | 93 |
| Page: 1 |
Top |
Cell-cell communication analysis |
| Identification of potential cell-cell interactions between two cell types and their ligand-receptor pairs for different disease states |
| Ligand | Receptor | LRpair | Pathway | Tissue | Disease Stage |
| Page: 1 |
Top |
Single-cell gene regulatory network inference analysis |
| Find out the significant the regulons (TFs) and the target genes of each regulon across cell types for different disease states |
| TF | Cell Type | Tissue | Disease Stage | Target Gene | RSS | Regulon Activity |
| ∗The dot plots of a searched regulon are shown for all cell subpopulations in each disease state of each tissue based on the regulon specific score inferred using pySCENIC and by calculating the average expression. |
| Page: 1 |
Top |
Somatic mutation of malignant transformation related genes |
| Annotation of somatic variants for genes involved in malignant transformation |
| Hugo Symbol | Variant Class | Variant Classification | dbSNP RS | HGVSc | HGVSp | HGVSp Short | SWISSPROT | BIOTYPE | SIFT | PolyPhen | Tumor Sample Barcode | Tissue | Histology | Sex | Age | Stage | Therapy Types | Drugs | Outcome |
| RILP | insertion | In_Frame_Ins | novel | c.826_827insCTCCCCCACTGCAGCCAG | p.Leu276delinsProProProLeuGlnProVal | p.L276delinsPPPLQPV | Q96NA2 | protein_coding | TCGA-A2-A04V-01 | Breast | breast invasive carcinoma | Female | <65 | I/II | Chemotherapy | cytoxan | PD | ||
| RILP | SNV | Missense_Mutation | c.865N>A | p.Ala289Thr | p.A289T | Q96NA2 | protein_coding | deleterious(0.03) | probably_damaging(0.987) | TCGA-AA-3864-01 | Colorectum | colon adenocarcinoma | Male | >=65 | I/II | Unknown | Unknown | SD | |
| RILP | SNV | Missense_Mutation | c.1132C>T | p.Pro378Ser | p.P378S | Q96NA2 | protein_coding | tolerated(0.17) | benign(0.007) | TCGA-AA-3973-01 | Colorectum | colon adenocarcinoma | Male | >=65 | III/IV | Targeted Molecular therapy | bevacizumab | SD | |
| RILP | SNV | Missense_Mutation | rs755684887 | c.884G>A | p.Arg295Gln | p.R295Q | Q96NA2 | protein_coding | deleterious(0.04) | benign(0.37) | TCGA-AZ-4313-01 | Colorectum | colon adenocarcinoma | Female | <65 | I/II | Unknown | Unknown | SD |
| RILP | SNV | Missense_Mutation | rs763922701 | c.1192N>A | p.Ala398Thr | p.A398T | Q96NA2 | protein_coding | tolerated_low_confidence(0.18) | benign(0) | TCGA-CK-6746-01 | Colorectum | colon adenocarcinoma | Female | >=65 | I/II | Unknown | Unknown | SD |
| RILP | SNV | Missense_Mutation | rs200277401 | c.1045N>T | p.Arg349Trp | p.R349W | Q96NA2 | protein_coding | deleterious(0.02) | benign(0.003) | TCGA-A5-A0G2-01 | Endometrium | uterine corpus endometrioid carcinoma | Female | <65 | III/IV | Unknown | Unknown | SD |
| RILP | SNV | Missense_Mutation | novel | c.1023G>T | p.Gln341His | p.Q341H | Q96NA2 | protein_coding | deleterious(0.01) | possibly_damaging(0.694) | TCGA-AP-A0LM-01 | Endometrium | uterine corpus endometrioid carcinoma | Female | <65 | III/IV | Chemotherapy | cisplatin | SD |
| RILP | SNV | Missense_Mutation | novel | c.929N>G | p.Glu310Gly | p.E310G | Q96NA2 | protein_coding | deleterious(0) | probably_damaging(0.922) | TCGA-AP-A1DK-01 | Endometrium | uterine corpus endometrioid carcinoma | Female | <65 | I/II | Unknown | Unknown | SD |
| RILP | SNV | Missense_Mutation | novel | c.794N>C | p.Leu265Pro | p.L265P | Q96NA2 | protein_coding | deleterious(0) | probably_damaging(0.995) | TCGA-AP-A1DK-01 | Endometrium | uterine corpus endometrioid carcinoma | Female | <65 | I/II | Unknown | Unknown | SD |
| RILP | SNV | Missense_Mutation | novel | c.1130C>A | p.Ser377Tyr | p.S377Y | Q96NA2 | protein_coding | deleterious(0.03) | benign(0.271) | TCGA-AX-A2HC-01 | Endometrium | uterine corpus endometrioid carcinoma | Female | <65 | III/IV | Chemotherapy | paclitaxel | PD |
| Page: 1 2 3 |
Top |
Related drugs of malignant transformation related genes |
| Identification of chemicals and drugs interact with genes involved in malignant transfromation |
| (DGIdb 4.0) |
| Entrez ID | Symbol | Category | Interaction Types | Drug Claim Name | Drug Name | PMIDs |
| Page: 1 |

Copyright 2023-Present -The University of Texas Health Science Center at Houston |