
|
|||||
|
 | |
| |
| |
| |
| |
| |
|
Gene: RIDA |
Gene summary for RIDA |
| Gene information | Species | Human | Gene symbol | RIDA | Gene ID | 10247 |
| Gene name | reactive intermediate imine deaminase A homolog | |
| Gene Alias | HRSP12 | |
| Cytomap | 8q22.2 | |
| Gene Type | protein-coding | GO ID | GO:0001655 | UniProtAcc | A0A024R9H2 |
Top |
Malignant transformation analysis |
| Identification of the aberrant gene expression in precancerous and cancerous lesions by comparing the gene expression of stem-like cells in diseased tissues with normal stem cells |
| Entrez ID | Symbol | Replicates | Species | Organ | Tissue | Adj P-value | Log2FC | Malignancy |
| 10247 | RIDA | NAFLD1 | Human | Liver | NAFLD | 7.90e-06 | 4.33e-01 | -0.04 |
| 10247 | RIDA | HCC1_Meng | Human | Liver | HCC | 4.58e-11 | -3.62e-01 | 0.0246 |
| 10247 | RIDA | HCC2_Meng | Human | Liver | HCC | 2.20e-10 | -3.62e-01 | 0.0107 |
| 10247 | RIDA | cirrhotic1 | Human | Liver | Cirrhotic | 4.58e-11 | -3.62e-01 | 0.0202 |
| 10247 | RIDA | cirrhotic2 | Human | Liver | Cirrhotic | 1.01e-10 | -3.62e-01 | 0.0201 |
| 10247 | RIDA | cirrhotic3 | Human | Liver | Cirrhotic | 3.31e-05 | -3.62e-01 | 0.0215 |
| 10247 | RIDA | HCC1 | Human | Liver | HCC | 1.23e-02 | 2.65e+00 | 0.5336 |
| 10247 | RIDA | HCC2 | Human | Liver | HCC | 1.49e-19 | 3.03e+00 | 0.5341 |
| 10247 | RIDA | Pt13.a | Human | Liver | HCC | 2.09e-11 | -3.62e-01 | 0.021 |
| 10247 | RIDA | Pt13.b | Human | Liver | HCC | 3.70e-04 | -3.62e-01 | 0.0251 |
| 10247 | RIDA | Pt14.d | Human | Liver | HCC | 4.58e-11 | -3.62e-01 | 0.0143 |
| 10247 | RIDA | S014 | Human | Liver | HCC | 6.92e-24 | 9.31e-01 | 0.2254 |
| 10247 | RIDA | S015 | Human | Liver | HCC | 7.41e-26 | 1.45e+00 | 0.2375 |
| 10247 | RIDA | S016 | Human | Liver | HCC | 2.09e-29 | 9.50e-01 | 0.2243 |
| 10247 | RIDA | S027 | Human | Liver | HCC | 1.95e-07 | 1.28e+00 | 0.2446 |
| 10247 | RIDA | S028 | Human | Liver | HCC | 1.84e-26 | 1.40e+00 | 0.2503 |
| 10247 | RIDA | S029 | Human | Liver | HCC | 3.75e-34 | 1.86e+00 | 0.2581 |
| Page: 1 |
| Tissue | Expression Dynamics | Abbreviation |
| Liver | 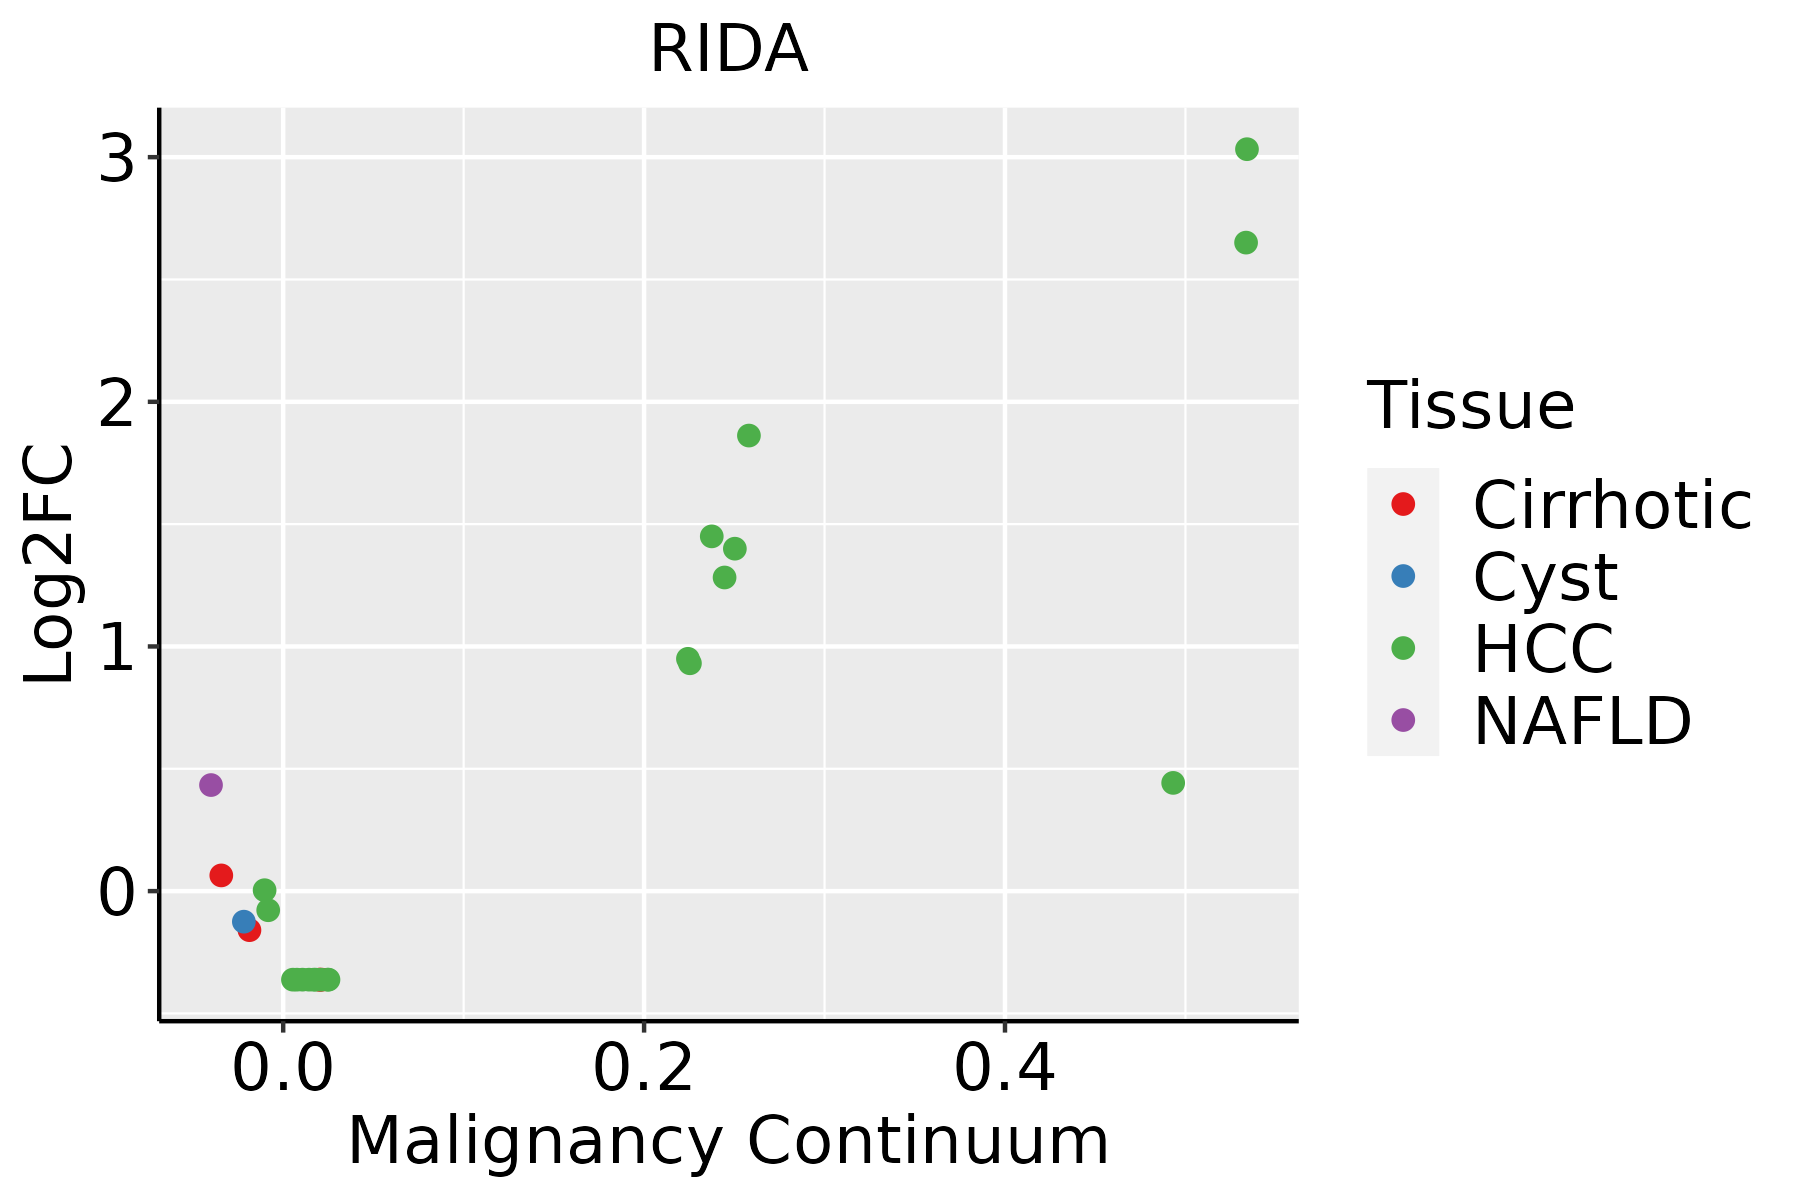 | HCC: Hepatocellular carcinoma |
| NAFLD: Non-alcoholic fatty liver disease |
| ∗log2FC in expression of this searched gene in stem-like cells from each diseased tissue sample relative to stem-like cells in normal samples in each tissue plotted against the malignancy continuum. Samples are colored based on if they are from different disease stage. |
Top |
Malignant transformation related pathway analysis |
| Find out the enriched GO biological processes and KEGG pathways involved in transition from healthy to precancer to cancer |
| Tissue | Disease Stage | Enriched GO biological Processes |
| Colorectum | AD |  |
| Colorectum | SER |  |
| Colorectum | MSS |  |
| Colorectum | MSI-H |  |
| Colorectum | FAP |  |
| ∗Top 15 enriched GO BP terms are showed in the bar plot of each disease state in each tissue. Each row represents a significant GO biological process which is colored according to the -log10(p.adjust). |
| Page: 1 2 3 4 5 6 7 8 9 |
| GO ID | Tissue | Disease Stage | Description | Gene Ratio | Bg Ratio | pvalue | p.adjust | Count |
| GO:00463953 | Liver | NAFLD | carboxylic acid catabolic process | 73/1882 | 236/18723 | 4.16e-19 | 1.22e-15 | 73 |
| GO:00160544 | Liver | NAFLD | organic acid catabolic process | 73/1882 | 240/18723 | 1.20e-18 | 2.34e-15 | 73 |
| GO:00442825 | Liver | NAFLD | small molecule catabolic process | 91/1882 | 376/18723 | 8.96e-16 | 1.31e-12 | 91 |
| GO:00098967 | Liver | NAFLD | positive regulation of catabolic process | 108/1882 | 492/18723 | 2.68e-15 | 3.14e-12 | 108 |
| GO:00194396 | Liver | NAFLD | aromatic compound catabolic process | 102/1882 | 467/18723 | 2.29e-14 | 1.91e-11 | 102 |
| GO:19013616 | Liver | NAFLD | organic cyclic compound catabolic process | 105/1882 | 495/18723 | 7.04e-14 | 5.15e-11 | 105 |
| GO:00313317 | Liver | NAFLD | positive regulation of cellular catabolic process | 92/1882 | 427/18723 | 1.01e-12 | 4.91e-10 | 92 |
| GO:00442707 | Liver | NAFLD | cellular nitrogen compound catabolic process | 93/1882 | 451/18723 | 1.04e-11 | 4.34e-09 | 93 |
| GO:00467006 | Liver | NAFLD | heterocycle catabolic process | 92/1882 | 445/18723 | 1.16e-11 | 4.52e-09 | 92 |
| GO:0009063 | Liver | NAFLD | cellular amino acid catabolic process | 36/1882 | 110/18723 | 6.56e-11 | 1.99e-08 | 36 |
| GO:19033116 | Liver | NAFLD | regulation of mRNA metabolic process | 66/1882 | 288/18723 | 1.06e-10 | 2.96e-08 | 66 |
| GO:00064026 | Liver | NAFLD | mRNA catabolic process | 56/1882 | 232/18723 | 3.49e-10 | 9.27e-08 | 56 |
| GO:00065203 | Liver | NAFLD | cellular amino acid metabolic process | 63/1882 | 284/18723 | 1.14e-09 | 2.17e-07 | 63 |
| GO:00346556 | Liver | NAFLD | nucleobase-containing compound catabolic process | 80/1882 | 407/18723 | 3.07e-09 | 4.61e-07 | 80 |
| GO:00064016 | Liver | NAFLD | RNA catabolic process | 61/1882 | 278/18723 | 3.26e-09 | 4.76e-07 | 61 |
| GO:00610136 | Liver | NAFLD | regulation of mRNA catabolic process | 42/1882 | 166/18723 | 1.27e-08 | 1.65e-06 | 42 |
| GO:19016053 | Liver | NAFLD | alpha-amino acid metabolic process | 46/1882 | 195/18723 | 2.74e-08 | 2.86e-06 | 46 |
| GO:00064177 | Liver | NAFLD | regulation of translation | 85/1882 | 468/18723 | 4.58e-08 | 4.54e-06 | 85 |
| GO:00434886 | Liver | NAFLD | regulation of mRNA stability | 39/1882 | 158/18723 | 8.49e-08 | 7.09e-06 | 39 |
| GO:00434876 | Liver | NAFLD | regulation of RNA stability | 40/1882 | 170/18723 | 2.32e-07 | 1.58e-05 | 40 |
| Page: 1 2 3 4 5 6 |
| Pathway ID | Tissue | Disease Stage | Description | Gene Ratio | Bg Ratio | pvalue | p.adjust | qvalue | Count |
| Page: 1 |
Top |
Cell-cell communication analysis |
| Identification of potential cell-cell interactions between two cell types and their ligand-receptor pairs for different disease states |
| Ligand | Receptor | LRpair | Pathway | Tissue | Disease Stage |
| Page: 1 |
Top |
Single-cell gene regulatory network inference analysis |
| Find out the significant the regulons (TFs) and the target genes of each regulon across cell types for different disease states |
| TF | Cell Type | Tissue | Disease Stage | Target Gene | RSS | Regulon Activity |
| ∗The dot plots of a searched regulon are shown for all cell subpopulations in each disease state of each tissue based on the regulon specific score inferred using pySCENIC and by calculating the average expression. |
| Page: 1 |
Top |
Somatic mutation of malignant transformation related genes |
| Annotation of somatic variants for genes involved in malignant transformation |
| Hugo Symbol | Variant Class | Variant Classification | dbSNP RS | HGVSc | HGVSp | HGVSp Short | SWISSPROT | BIOTYPE | SIFT | PolyPhen | Tumor Sample Barcode | Tissue | Histology | Sex | Age | Stage | Therapy Types | Drugs | Outcome |
| RIDA | SNV | Missense_Mutation | rs779193135 | c.359N>A | p.Arg120Gln | p.R120Q | P52758 | protein_coding | tolerated(0.23) | benign(0.098) | TCGA-AA-3510-01 | Colorectum | colon adenocarcinoma | Male | >=65 | I/II | Unknown | Unknown | SD |
| RIDA | SNV | Missense_Mutation | c.59N>T | p.Pro20Leu | p.P20L | P52758 | protein_coding | deleterious(0.02) | probably_damaging(0.943) | TCGA-AA-3662-01 | Colorectum | colon adenocarcinoma | Female | >=65 | III/IV | Chemotherapy | capecitabine | PR | |
| RIDA | SNV | Missense_Mutation | rs779193135 | c.359G>A | p.Arg120Gln | p.R120Q | P52758 | protein_coding | tolerated(0.23) | benign(0.098) | TCGA-AA-A010-01 | Colorectum | colon adenocarcinoma | Female | <65 | I/II | Chemotherapy | folinic | CR |
| RIDA | SNV | Missense_Mutation | rs779193135 | c.359N>A | p.Arg120Gln | p.R120Q | P52758 | protein_coding | tolerated(0.23) | benign(0.098) | TCGA-AZ-4315-01 | Colorectum | colon adenocarcinoma | Male | <65 | I/II | Unknown | Unknown | SD |
| RIDA | SNV | Missense_Mutation | c.212N>A | p.Cys71Tyr | p.C71Y | P52758 | protein_coding | tolerated(0.09) | benign(0.122) | TCGA-AZ-6598-01 | Colorectum | colon adenocarcinoma | Female | >=65 | I/II | Unknown | Unknown | SD | |
| RIDA | SNV | Missense_Mutation | rs779193135 | c.359N>A | p.Arg120Gln | p.R120Q | P52758 | protein_coding | tolerated(0.23) | benign(0.098) | TCGA-AG-A002-01 | Colorectum | rectum adenocarcinoma | Male | <65 | I/II | Unknown | Unknown | SD |
| RIDA | deletion | Frame_Shift_Del | novel | c.182delN | p.Asn61ThrfsTer6 | p.N61Tfs*6 | P52758 | protein_coding | TCGA-AA-3947-01 | Colorectum | colon adenocarcinoma | Female | <65 | I/II | Unknown | Unknown | SD | ||
| RIDA | SNV | Missense_Mutation | c.119N>G | p.Asp40Gly | p.D40G | P52758 | protein_coding | deleterious(0.01) | possibly_damaging(0.724) | TCGA-AP-A0LM-01 | Endometrium | uterine corpus endometrioid carcinoma | Female | <65 | III/IV | Chemotherapy | cisplatin | SD | |
| RIDA | SNV | Missense_Mutation | novel | c.113N>A | p.Gly38Asp | p.G38D | P52758 | protein_coding | deleterious(0) | probably_damaging(0.999) | TCGA-AX-A1CE-01 | Endometrium | uterine corpus endometrioid carcinoma | Female | <65 | I/II | Unspecific | Paclitaxel | SD |
| RIDA | SNV | Missense_Mutation | novel | c.244N>A | p.Leu82Ile | p.L82I | P52758 | protein_coding | deleterious(0.01) | probably_damaging(0.93) | TCGA-EY-A1GI-01 | Endometrium | uterine corpus endometrioid carcinoma | Female | <65 | I/II | Unknown | Unknown | SD |
| Page: 1 2 |
Top |
Related drugs of malignant transformation related genes |
| Identification of chemicals and drugs interact with genes involved in malignant transfromation |
| (DGIdb 4.0) |
| Entrez ID | Symbol | Category | Interaction Types | Drug Claim Name | Drug Name | PMIDs |
| Page: 1 |

Copyright 2023-Present -The University of Texas Health Science Center at Houston |