
|
|||||
|
 | |
| |
| |
| |
| |
| |
|
Gene: RIC8B |
Gene summary for RIC8B |
| Gene information | Species | Human | Gene symbol | RIC8B | Gene ID | 55188 |
| Gene name | RIC8 guanine nucleotide exchange factor B | |
| Gene Alias | RIC8 | |
| Cytomap | 12q23.3 | |
| Gene Type | protein-coding | GO ID | GO:0007154 | UniProtAcc | B7WPL0 |
Top |
Malignant transformation analysis |
| Identification of the aberrant gene expression in precancerous and cancerous lesions by comparing the gene expression of stem-like cells in diseased tissues with normal stem cells |
| Entrez ID | Symbol | Replicates | Species | Organ | Tissue | Adj P-value | Log2FC | Malignancy |
| 55188 | RIC8B | NAFLD1 | Human | Liver | NAFLD | 8.72e-03 | 3.25e-01 | -0.04 |
| 55188 | RIC8B | S43 | Human | Liver | Cirrhotic | 5.64e-05 | -1.68e-01 | -0.0187 |
| 55188 | RIC8B | HCC1_Meng | Human | Liver | HCC | 1.41e-37 | -8.79e-02 | 0.0246 |
| 55188 | RIC8B | HCC2_Meng | Human | Liver | HCC | 1.24e-06 | -1.35e-01 | 0.0107 |
| 55188 | RIC8B | cirrhotic2 | Human | Liver | Cirrhotic | 1.88e-04 | 2.38e-01 | 0.0201 |
| 55188 | RIC8B | HCC1 | Human | Liver | HCC | 8.86e-04 | 5.84e-01 | 0.5336 |
| 55188 | RIC8B | S027 | Human | Liver | HCC | 4.00e-03 | 5.42e-01 | 0.2446 |
| 55188 | RIC8B | S028 | Human | Liver | HCC | 9.32e-03 | 1.99e-01 | 0.2503 |
| 55188 | RIC8B | S029 | Human | Liver | HCC | 5.00e-05 | 3.46e-01 | 0.2581 |
| Page: 1 |
| Tissue | Expression Dynamics | Abbreviation |
| Liver | 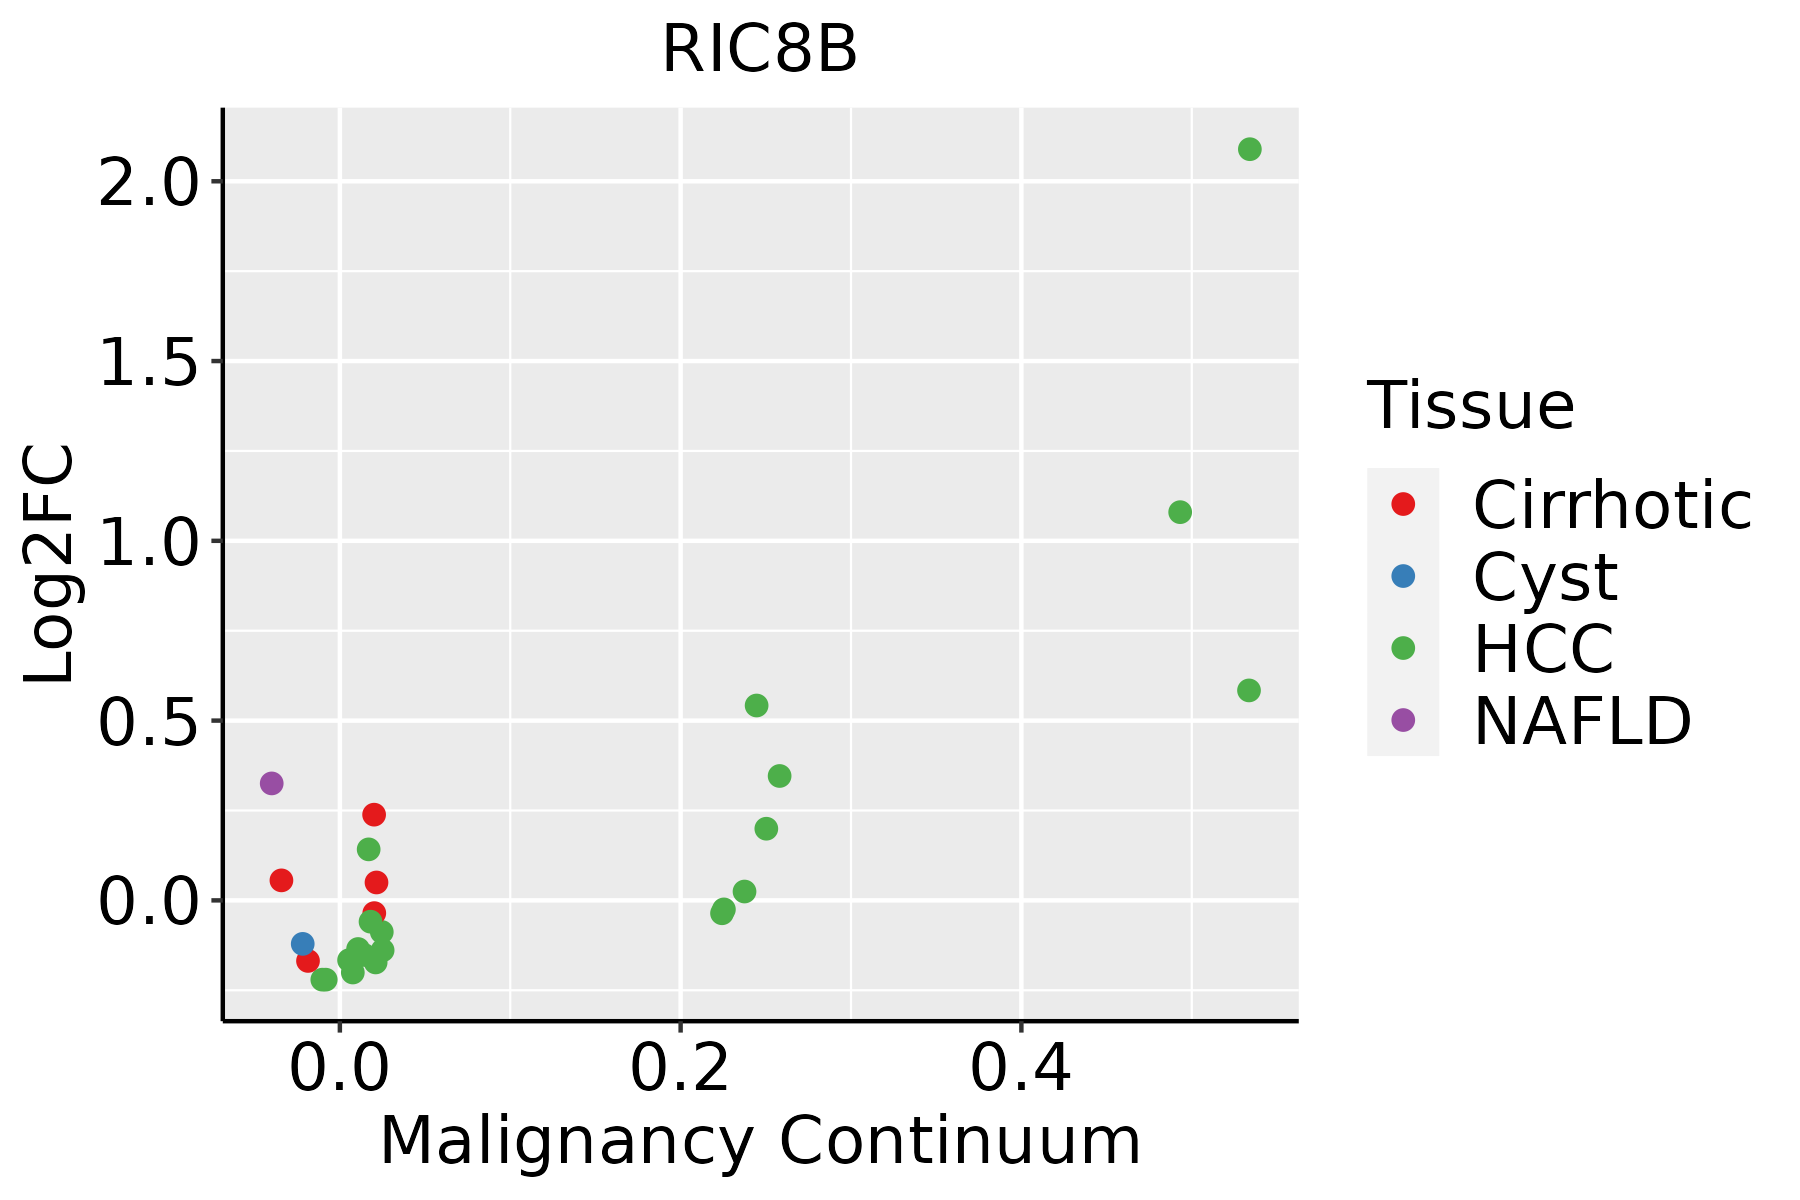 | HCC: Hepatocellular carcinoma |
| NAFLD: Non-alcoholic fatty liver disease |
| ∗log2FC in expression of this searched gene in stem-like cells from each diseased tissue sample relative to stem-like cells in normal samples in each tissue plotted against the malignancy continuum. Samples are colored based on if they are from different disease stage. |
Top |
Malignant transformation related pathway analysis |
| Find out the enriched GO biological processes and KEGG pathways involved in transition from healthy to precancer to cancer |
| Tissue | Disease Stage | Enriched GO biological Processes |
| Colorectum | AD |  |
| Colorectum | SER |  |
| Colorectum | MSS |  |
| Colorectum | MSI-H |  |
| Colorectum | FAP |  |
| ∗Top 15 enriched GO BP terms are showed in the bar plot of each disease state in each tissue. Each row represents a significant GO biological process which is colored according to the -log10(p.adjust). |
| Page: 1 2 3 4 5 6 7 8 9 |
| GO ID | Tissue | Disease Stage | Description | Gene Ratio | Bg Ratio | pvalue | p.adjust | Count |
| Page: 1 |
| Pathway ID | Tissue | Disease Stage | Description | Gene Ratio | Bg Ratio | pvalue | p.adjust | qvalue | Count |
| Page: 1 |
Top |
Cell-cell communication analysis |
| Identification of potential cell-cell interactions between two cell types and their ligand-receptor pairs for different disease states |
| Ligand | Receptor | LRpair | Pathway | Tissue | Disease Stage |
| Page: 1 |
Top |
Single-cell gene regulatory network inference analysis |
| Find out the significant the regulons (TFs) and the target genes of each regulon across cell types for different disease states |
| TF | Cell Type | Tissue | Disease Stage | Target Gene | RSS | Regulon Activity |
| ∗The dot plots of a searched regulon are shown for all cell subpopulations in each disease state of each tissue based on the regulon specific score inferred using pySCENIC and by calculating the average expression. |
| Page: 1 |
Top |
Somatic mutation of malignant transformation related genes |
| Annotation of somatic variants for genes involved in malignant transformation |
| Hugo Symbol | Variant Class | Variant Classification | dbSNP RS | HGVSc | HGVSp | HGVSp Short | SWISSPROT | BIOTYPE | SIFT | PolyPhen | Tumor Sample Barcode | Tissue | Histology | Sex | Age | Stage | Therapy Types | Drugs | Outcome |
| RIC8B | SNV | Missense_Mutation | c.563N>T | p.Gly188Val | p.G188V | protein_coding | deleterious(0) | probably_damaging(0.972) | TCGA-C8-A134-01 | Breast | breast invasive carcinoma | Female | <65 | I/II | Chemotherapy | 5-fluorouracil | CR | ||
| RIC8B | insertion | In_Frame_Ins | novel | c.627_628insAGACTTGAGTATCTGTGGATTTTATTATCTGCAGAGGGT | p.Glu209_Ser210insArgLeuGluTyrLeuTrpIleLeuLeuSerAlaGluGly | p.E209_S210insRLEYLWILLSAEG | protein_coding | TCGA-A8-A06X-01 | Breast | breast invasive carcinoma | Female | >=65 | I/II | Unknown | Unknown | SD | |||
| RIC8B | deletion | Frame_Shift_Del | novel | c.124delN | p.Arg43GlufsTer13 | p.R43Efs*13 | protein_coding | TCGA-EW-A2FV-01 | Breast | breast invasive carcinoma | Female | <65 | III/IV | Chemotherapy | docetaxel | SD | |||
| RIC8B | SNV | Missense_Mutation | rs770803307 | c.1231N>T | p.Arg411Cys | p.R411C | protein_coding | deleterious(0) | probably_damaging(0.999) | TCGA-ZJ-AAXI-01 | Cervix | cervical & endocervical cancer | Female | >=65 | I/II | Unknown | Unknown | SD | |
| RIC8B | SNV | Missense_Mutation | c.311N>A | p.Ser104Tyr | p.S104Y | protein_coding | deleterious(0.03) | possibly_damaging(0.581) | TCGA-AA-3510-01 | Colorectum | colon adenocarcinoma | Male | >=65 | I/II | Unknown | Unknown | SD | ||
| RIC8B | SNV | Missense_Mutation | rs750585088 | c.1142N>A | p.Arg381Gln | p.R381Q | protein_coding | deleterious(0) | probably_damaging(0.998) | TCGA-AA-3510-01 | Colorectum | colon adenocarcinoma | Male | >=65 | I/II | Unknown | Unknown | SD | |
| RIC8B | SNV | Missense_Mutation | c.637G>T | p.Asp213Tyr | p.D213Y | protein_coding | deleterious(0.01) | probably_damaging(0.983) | TCGA-AA-A01P-01 | Colorectum | colon adenocarcinoma | Female | >=65 | III/IV | Unknown | Unknown | PD | ||
| RIC8B | SNV | Missense_Mutation | novel | c.356N>C | p.Lys119Thr | p.K119T | protein_coding | deleterious(0) | probably_damaging(0.999) | TCGA-CA-6717-01 | Colorectum | colon adenocarcinoma | Male | <65 | I/II | Chemotherapy | oxaliplatin | CR | |
| RIC8B | SNV | Missense_Mutation | rs764723269 | c.761N>A | p.Arg254His | p.R254H | protein_coding | deleterious(0) | probably_damaging(0.999) | TCGA-CK-5916-01 | Colorectum | colon adenocarcinoma | Female | >=65 | I/II | Unknown | Unknown | PD | |
| RIC8B | SNV | Missense_Mutation | c.1448C>G | p.Pro483Arg | p.P483R | protein_coding | deleterious(0.03) | probably_damaging(1) | TCGA-G4-6626-01 | Colorectum | colon adenocarcinoma | Male | >=65 | I/II | Unknown | Unknown | SD |
| Page: 1 2 3 4 5 |
Top |
Related drugs of malignant transformation related genes |
| Identification of chemicals and drugs interact with genes involved in malignant transfromation |
| (DGIdb 4.0) |
| Entrez ID | Symbol | Category | Interaction Types | Drug Claim Name | Drug Name | PMIDs |
| Page: 1 |

Copyright 2023-Present -The University of Texas Health Science Center at Houston |