
|
|||||
|
 | |
| |
| |
| |
| |
| |
|
Gene: RIC8A |
Gene summary for RIC8A |
| Gene information | Species | Human | Gene symbol | RIC8A | Gene ID | 60626 |
| Gene name | RIC8 guanine nucleotide exchange factor A | |
| Gene Alias | RIC8 | |
| Cytomap | 11p15.5 | |
| Gene Type | protein-coding | GO ID | GO:0001667 | UniProtAcc | Q9NPQ8 |
Top |
Malignant transformation analysis |
| Identification of the aberrant gene expression in precancerous and cancerous lesions by comparing the gene expression of stem-like cells in diseased tissues with normal stem cells |
| Entrez ID | Symbol | Replicates | Species | Organ | Tissue | Adj P-value | Log2FC | Malignancy |
| 60626 | RIC8A | LZE4T | Human | Esophagus | ESCC | 1.01e-09 | 1.44e-01 | 0.0811 |
| 60626 | RIC8A | LZE5T | Human | Esophagus | ESCC | 9.88e-03 | 3.14e-01 | 0.0514 |
| 60626 | RIC8A | LZE7T | Human | Esophagus | ESCC | 2.39e-05 | 2.08e-01 | 0.0667 |
| 60626 | RIC8A | LZE8T | Human | Esophagus | ESCC | 2.61e-13 | 2.11e-01 | 0.067 |
| 60626 | RIC8A | LZE20T | Human | Esophagus | ESCC | 5.40e-04 | 1.75e-01 | 0.0662 |
| 60626 | RIC8A | LZE24T | Human | Esophagus | ESCC | 2.61e-26 | 5.87e-01 | 0.0596 |
| 60626 | RIC8A | LZE6T | Human | Esophagus | ESCC | 5.78e-06 | 1.84e-01 | 0.0845 |
| 60626 | RIC8A | P1T-E | Human | Esophagus | ESCC | 1.11e-09 | 3.21e-01 | 0.0875 |
| 60626 | RIC8A | P2T-E | Human | Esophagus | ESCC | 3.90e-23 | 4.74e-01 | 0.1177 |
| 60626 | RIC8A | P4T-E | Human | Esophagus | ESCC | 1.08e-19 | 3.81e-01 | 0.1323 |
| 60626 | RIC8A | P5T-E | Human | Esophagus | ESCC | 2.90e-13 | 1.96e-01 | 0.1327 |
| 60626 | RIC8A | P8T-E | Human | Esophagus | ESCC | 2.32e-23 | 2.65e-01 | 0.0889 |
| 60626 | RIC8A | P9T-E | Human | Esophagus | ESCC | 4.29e-15 | 3.52e-01 | 0.1131 |
| 60626 | RIC8A | P10T-E | Human | Esophagus | ESCC | 1.49e-23 | 3.93e-01 | 0.116 |
| 60626 | RIC8A | P11T-E | Human | Esophagus | ESCC | 5.81e-26 | 9.16e-01 | 0.1426 |
| 60626 | RIC8A | P12T-E | Human | Esophagus | ESCC | 4.42e-20 | 3.92e-01 | 0.1122 |
| 60626 | RIC8A | P15T-E | Human | Esophagus | ESCC | 2.48e-29 | 6.18e-01 | 0.1149 |
| 60626 | RIC8A | P16T-E | Human | Esophagus | ESCC | 6.87e-20 | 3.15e-01 | 0.1153 |
| 60626 | RIC8A | P17T-E | Human | Esophagus | ESCC | 4.83e-24 | 9.97e-01 | 0.1278 |
| 60626 | RIC8A | P19T-E | Human | Esophagus | ESCC | 6.38e-11 | 8.54e-01 | 0.1662 |
| Page: 1 2 3 4 5 6 |
| Tissue | Expression Dynamics | Abbreviation |
| Esophagus | 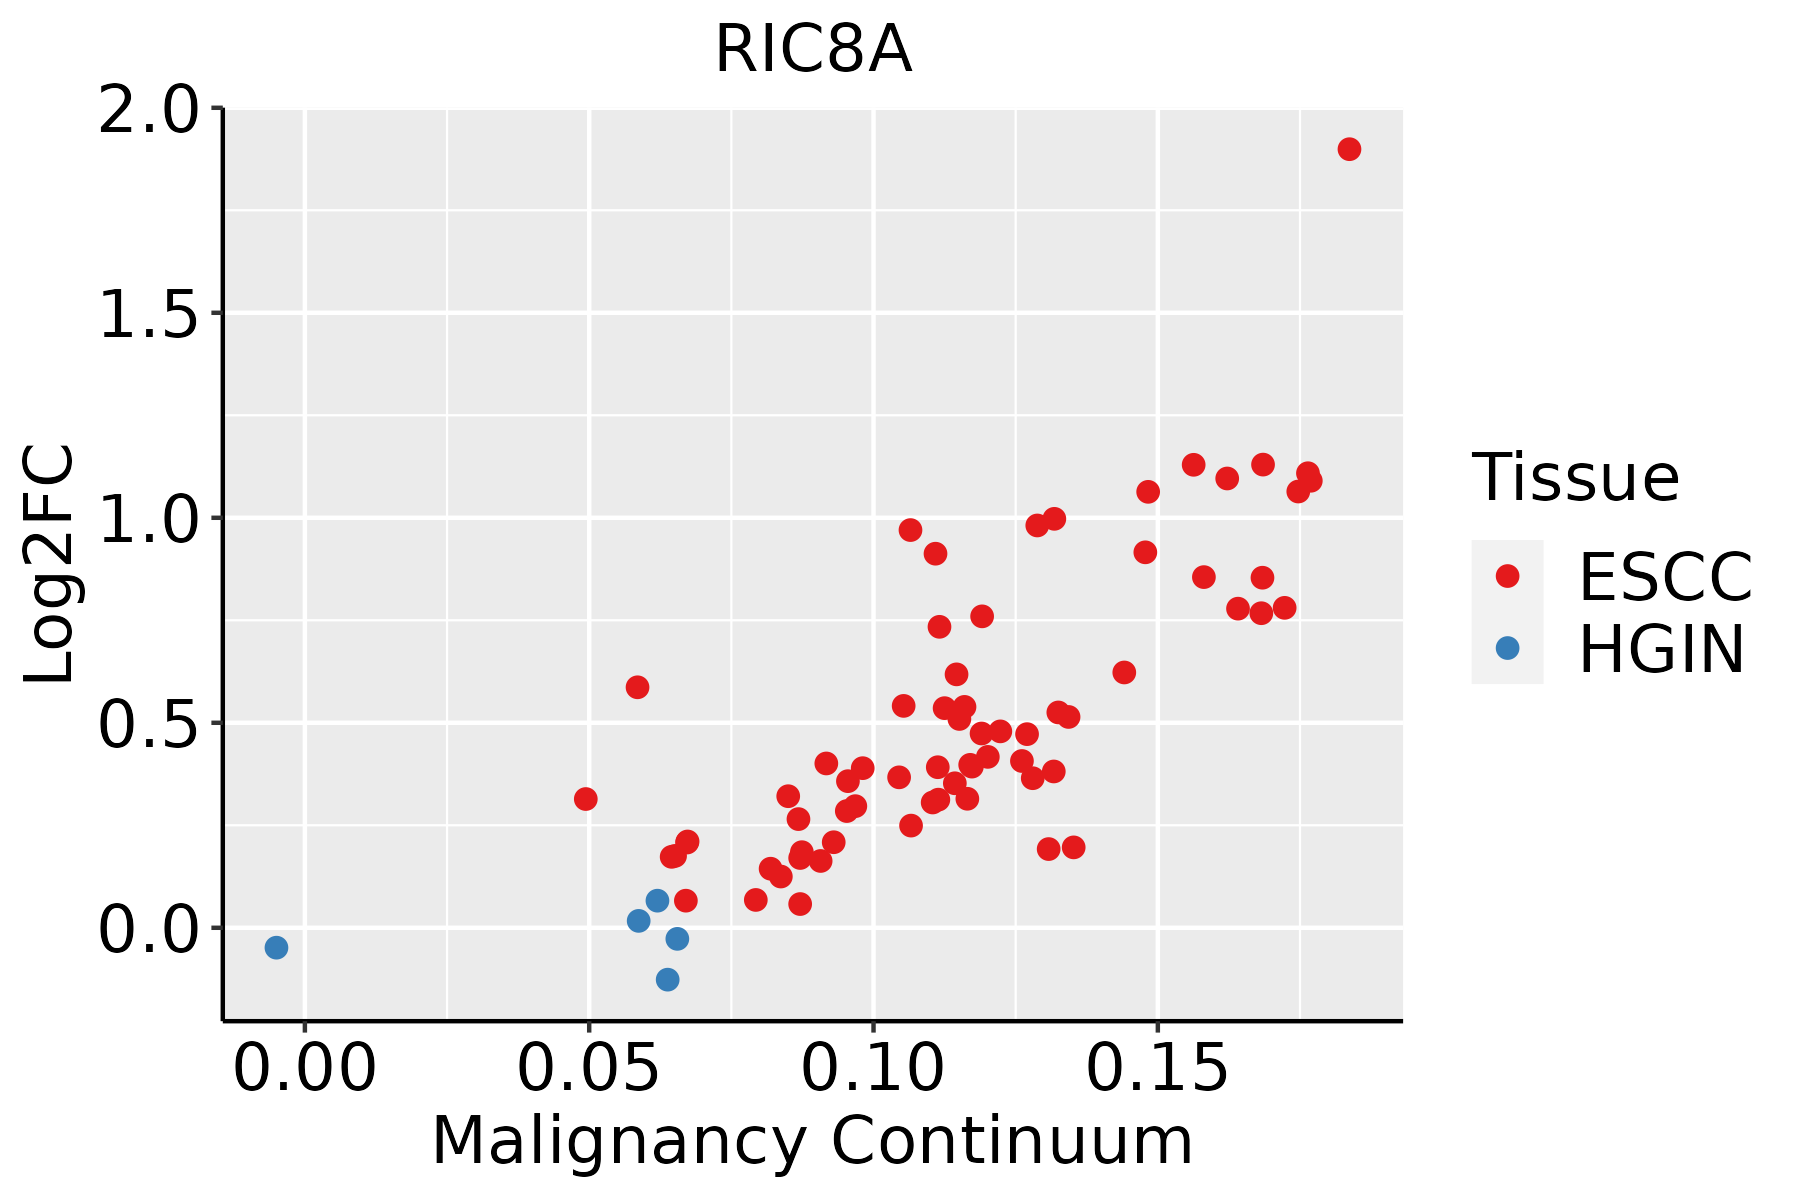 | ESCC: Esophageal squamous cell carcinoma |
| HGIN: High-grade intraepithelial neoplasias | ||
| LGIN: Low-grade intraepithelial neoplasias | ||
| Liver |  | HCC: Hepatocellular carcinoma |
| NAFLD: Non-alcoholic fatty liver disease | ||
| Oral Cavity | 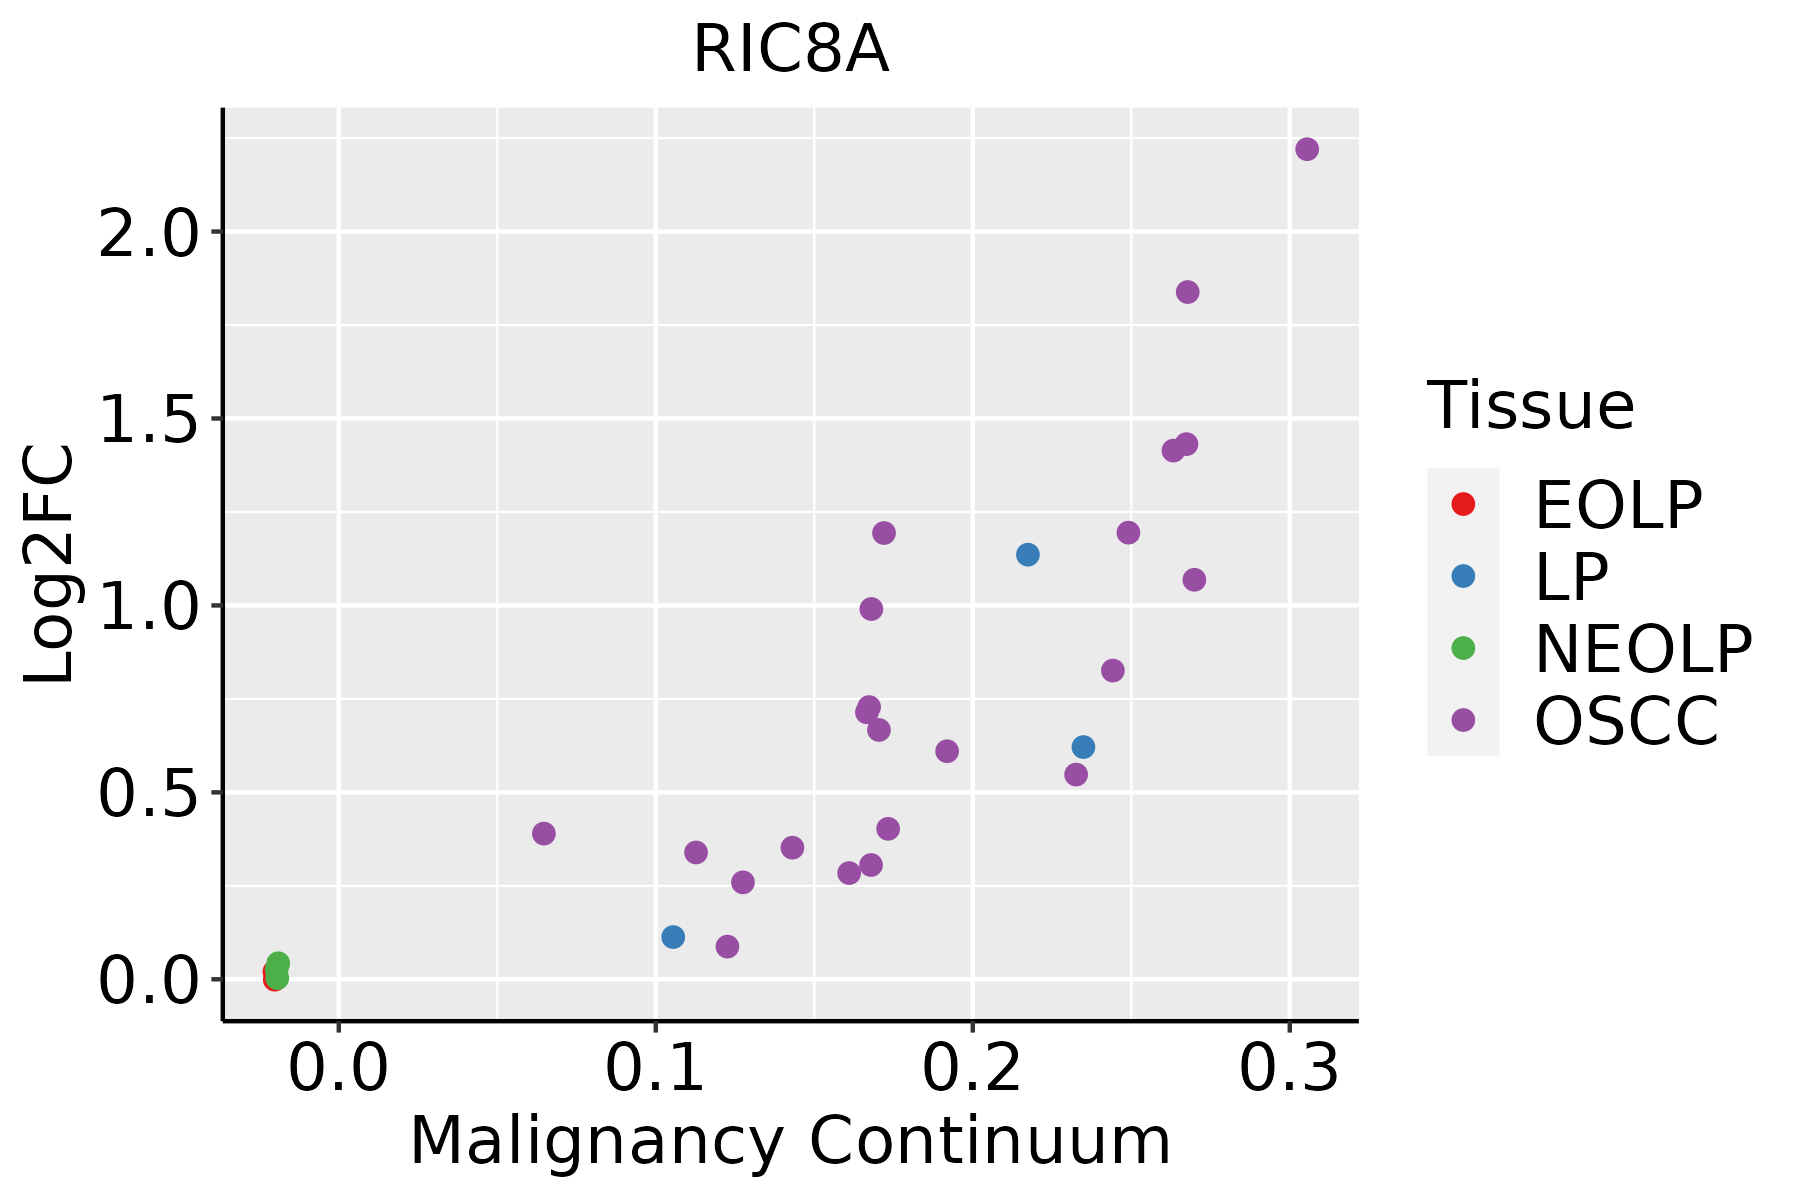 | EOLP: Erosive Oral lichen planus |
| LP: leukoplakia | ||
| NEOLP: Non-erosive oral lichen planus | ||
| OSCC: Oral squamous cell carcinoma | ||
| Skin |  | AK: Actinic keratosis |
| cSCC: Cutaneous squamous cell carcinoma | ||
| SCCIS:squamous cell carcinoma in situ | ||
| Thyroid | 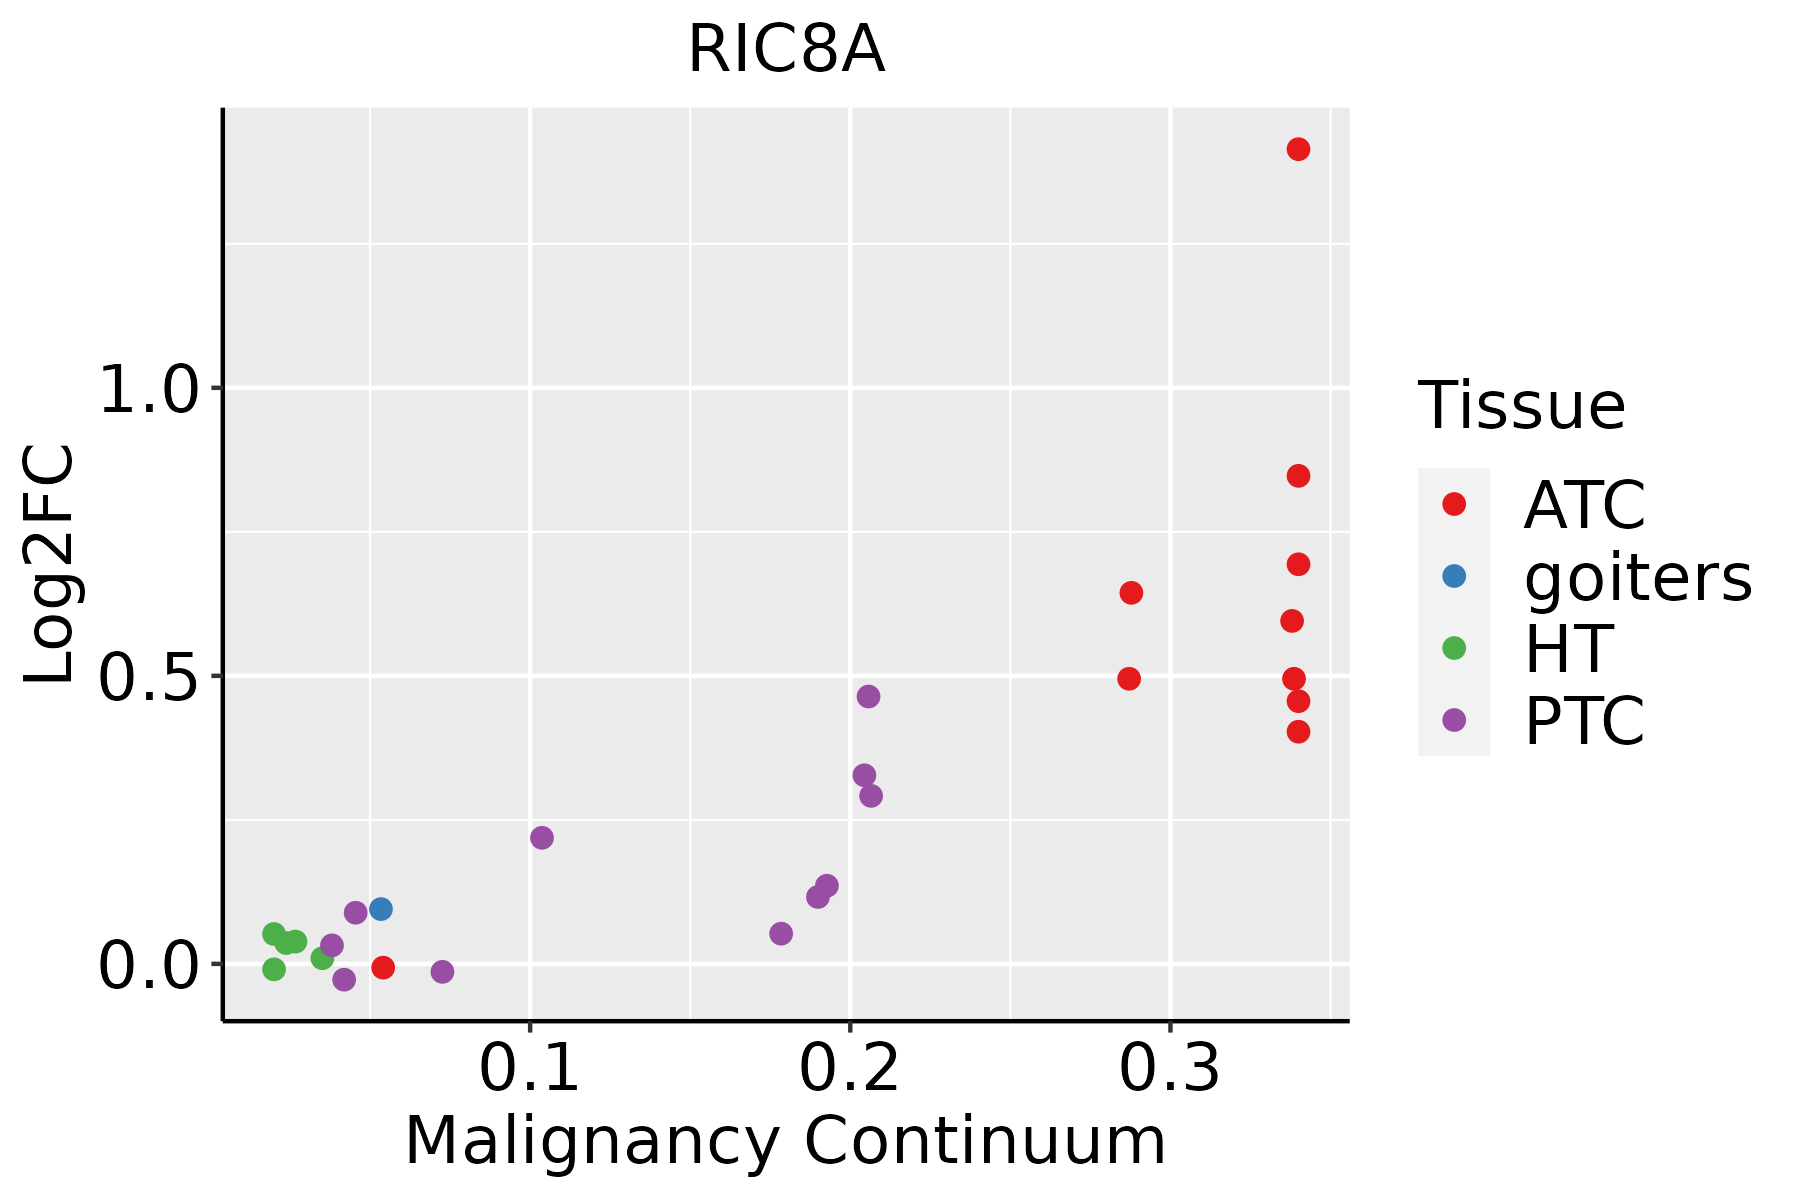 | ATC: Anaplastic thyroid cancer |
| HT: Hashimoto's thyroiditis | ||
| PTC: Papillary thyroid cancer |
| ∗log2FC in expression of this searched gene in stem-like cells from each diseased tissue sample relative to stem-like cells in normal samples in each tissue plotted against the malignancy continuum. Samples are colored based on if they are from different disease stage. |
Top |
Malignant transformation related pathway analysis |
| Find out the enriched GO biological processes and KEGG pathways involved in transition from healthy to precancer to cancer |
| Tissue | Disease Stage | Enriched GO biological Processes |
| Colorectum | AD |  |
| Colorectum | SER |  |
| Colorectum | MSS |  |
| Colorectum | MSI-H |  |
| Colorectum | FAP |  |
| ∗Top 15 enriched GO BP terms are showed in the bar plot of each disease state in each tissue. Each row represents a significant GO biological process which is colored according to the -log10(p.adjust). |
| Page: 1 2 3 4 5 6 7 8 9 |
| GO ID | Tissue | Disease Stage | Description | Gene Ratio | Bg Ratio | pvalue | p.adjust | Count |
| GO:000170119 | Esophagus | ESCC | in utero embryonic development | 243/8552 | 367/18723 | 1.00e-15 | 6.86e-14 | 243 |
| GO:000931419 | Esophagus | ESCC | response to radiation | 277/8552 | 456/18723 | 4.42e-11 | 1.43e-09 | 277 |
| GO:00073698 | Esophagus | ESCC | gastrulation | 115/8552 | 185/18723 | 4.35e-06 | 4.64e-05 | 115 |
| GO:000941611 | Esophagus | ESCC | response to light stimulus | 183/8552 | 320/18723 | 2.03e-05 | 1.76e-04 | 183 |
| GO:00301984 | Esophagus | ESCC | extracellular matrix organization | 171/8552 | 301/18723 | 6.08e-05 | 4.67e-04 | 171 |
| GO:00430624 | Esophagus | ESCC | extracellular structure organization | 171/8552 | 302/18723 | 7.73e-05 | 5.76e-04 | 171 |
| GO:00452294 | Esophagus | ESCC | external encapsulating structure organization | 172/8552 | 304/18723 | 7.80e-05 | 5.80e-04 | 172 |
| GO:000166720 | Esophagus | ESCC | ameboidal-type cell migration | 250/8552 | 475/18723 | 1.22e-03 | 5.97e-03 | 250 |
| GO:00717115 | Esophagus | ESCC | basement membrane organization | 22/8552 | 31/18723 | 3.90e-03 | 1.58e-02 | 22 |
| GO:00017015 | Liver | Cirrhotic | in utero embryonic development | 134/4634 | 367/18723 | 2.78e-07 | 6.86e-06 | 134 |
| GO:0071711 | Liver | Cirrhotic | basement membrane organization | 17/4634 | 31/18723 | 3.19e-04 | 2.77e-03 | 17 |
| GO:000166712 | Liver | Cirrhotic | ameboidal-type cell migration | 145/4634 | 475/18723 | 2.23e-03 | 1.36e-02 | 145 |
| GO:000170111 | Liver | HCC | in utero embryonic development | 204/7958 | 367/18723 | 2.44e-07 | 4.30e-06 | 204 |
| GO:00093146 | Liver | HCC | response to radiation | 223/7958 | 456/18723 | 3.08e-03 | 1.43e-02 | 223 |
| GO:000166721 | Liver | HCC | ameboidal-type cell migration | 226/7958 | 475/18723 | 1.35e-02 | 4.81e-02 | 226 |
| GO:000170116 | Oral cavity | OSCC | in utero embryonic development | 207/7305 | 367/18723 | 7.92e-12 | 2.95e-10 | 207 |
| GO:000931416 | Oral cavity | OSCC | response to radiation | 241/7305 | 456/18723 | 9.76e-10 | 2.40e-08 | 241 |
| GO:000166719 | Oral cavity | OSCC | ameboidal-type cell migration | 228/7305 | 475/18723 | 3.46e-05 | 3.10e-04 | 228 |
| GO:00094164 | Oral cavity | OSCC | response to light stimulus | 159/7305 | 320/18723 | 5.98e-05 | 4.92e-04 | 159 |
| GO:00073697 | Oral cavity | OSCC | gastrulation | 95/7305 | 185/18723 | 4.17e-04 | 2.54e-03 | 95 |
| Page: 1 2 3 |
| Pathway ID | Tissue | Disease Stage | Description | Gene Ratio | Bg Ratio | pvalue | p.adjust | qvalue | Count |
| Page: 1 |
Top |
Cell-cell communication analysis |
| Identification of potential cell-cell interactions between two cell types and their ligand-receptor pairs for different disease states |
| Ligand | Receptor | LRpair | Pathway | Tissue | Disease Stage |
| Page: 1 |
Top |
Single-cell gene regulatory network inference analysis |
| Find out the significant the regulons (TFs) and the target genes of each regulon across cell types for different disease states |
| TF | Cell Type | Tissue | Disease Stage | Target Gene | RSS | Regulon Activity |
| ∗The dot plots of a searched regulon are shown for all cell subpopulations in each disease state of each tissue based on the regulon specific score inferred using pySCENIC and by calculating the average expression. |
| Page: 1 |
Top |
Somatic mutation of malignant transformation related genes |
| Annotation of somatic variants for genes involved in malignant transformation |
| Hugo Symbol | Variant Class | Variant Classification | dbSNP RS | HGVSc | HGVSp | HGVSp Short | SWISSPROT | BIOTYPE | SIFT | PolyPhen | Tumor Sample Barcode | Tissue | Histology | Sex | Age | Stage | Therapy Types | Drugs | Outcome |
| RIC8A | SNV | Missense_Mutation | novel | c.1443G>T | p.Gln481His | p.Q481H | Q9NPQ8 | protein_coding | deleterious(0) | probably_damaging(0.999) | TCGA-AC-A3W6-01 | Breast | breast invasive carcinoma | Female | >=65 | III/IV | Unknown | Unknown | SD |
| RIC8A | SNV | Missense_Mutation | novel | c.1000N>C | p.Val334Leu | p.V334L | Q9NPQ8 | protein_coding | deleterious(0.01) | possibly_damaging(0.595) | TCGA-AQ-A04H-01 | Breast | breast invasive carcinoma | Female | <65 | III/IV | Chemotherapy | taxotere | SD |
| RIC8A | SNV | Missense_Mutation | c.1261N>G | p.Asn421Asp | p.N421D | Q9NPQ8 | protein_coding | deleterious(0) | possibly_damaging(0.893) | TCGA-B6-A0IE-01 | Breast | breast invasive carcinoma | Female | <65 | III/IV | Unknown | Unknown | PD | |
| RIC8A | SNV | Missense_Mutation | rs367798950 | c.1154N>A | p.Arg385His | p.R385H | Q9NPQ8 | protein_coding | deleterious(0) | probably_damaging(0.977) | TCGA-BH-A18G-01 | Breast | breast invasive carcinoma | Female | >=65 | I/II | Unknown | Unknown | SD |
| RIC8A | SNV | Missense_Mutation | novel | c.455N>T | p.Arg152Leu | p.R152L | Q9NPQ8 | protein_coding | tolerated(0.7) | benign(0.175) | TCGA-C5-A901-01 | Cervix | cervical & endocervical cancer | Female | <65 | I/II | Unknown | Unknown | SD |
| RIC8A | SNV | Missense_Mutation | novel | c.1327N>A | p.Glu443Lys | p.E443K | Q9NPQ8 | protein_coding | deleterious(0.02) | benign(0.276) | TCGA-EA-A97N-01 | Cervix | cervical & endocervical cancer | Female | <65 | I/II | Unknown | Unknown | SD |
| RIC8A | SNV | Missense_Mutation | novel | c.1195G>A | p.Ala399Thr | p.A399T | Q9NPQ8 | protein_coding | deleterious(0) | possibly_damaging(0.876) | TCGA-VS-A9UL-01 | Cervix | cervical & endocervical cancer | Female | >=65 | III/IV | Unknown | Unknown | PD |
| RIC8A | SNV | Missense_Mutation | c.1339N>G | p.Thr447Ala | p.T447A | Q9NPQ8 | protein_coding | deleterious(0) | possibly_damaging(0.523) | TCGA-A6-6780-01 | Colorectum | colon adenocarcinoma | Male | >=65 | I/II | Unknown | Unknown | SD | |
| RIC8A | SNV | Missense_Mutation | rs368432680 | c.767G>A | p.Arg256Gln | p.R256Q | Q9NPQ8 | protein_coding | deleterious(0) | possibly_damaging(0.65) | TCGA-AA-3710-01 | Colorectum | colon adenocarcinoma | Female | >=65 | I/II | Unknown | Unknown | SD |
| RIC8A | SNV | Missense_Mutation | rs751745965 | c.931C>T | p.Arg311Cys | p.R311C | Q9NPQ8 | protein_coding | tolerated(0.1) | benign(0.001) | TCGA-AA-A00N-01 | Colorectum | colon adenocarcinoma | Male | >=65 | I/II | Unknown | Unknown | PD |
| Page: 1 2 3 4 5 |
Top |
Related drugs of malignant transformation related genes |
| Identification of chemicals and drugs interact with genes involved in malignant transfromation |
| (DGIdb 4.0) |
| Entrez ID | Symbol | Category | Interaction Types | Drug Claim Name | Drug Name | PMIDs |
| Page: 1 |

Copyright 2023-Present -The University of Texas Health Science Center at Houston |