
|
|||||
|
 | |
| |
| |
| |
| |
| |
|
Gene: RIC1 |
Gene summary for RIC1 |
| Gene information | Species | Human | Gene symbol | RIC1 | Gene ID | 57589 |
| Gene name | RIC1 homolog, RAB6A GEF complex partner 1 | |
| Gene Alias | CATIFA | |
| Cytomap | 9p24.1 | |
| Gene Type | protein-coding | GO ID | GO:0003330 | UniProtAcc | Q4ADV7 |
Top |
Malignant transformation analysis |
| Identification of the aberrant gene expression in precancerous and cancerous lesions by comparing the gene expression of stem-like cells in diseased tissues with normal stem cells |
| Entrez ID | Symbol | Replicates | Species | Organ | Tissue | Adj P-value | Log2FC | Malignancy |
| 57589 | RIC1 | CCI_1 | Human | Cervix | CC | 4.55e-13 | 1.04e+00 | 0.528 |
| 57589 | RIC1 | CCI_2 | Human | Cervix | CC | 6.32e-16 | 1.63e+00 | 0.5249 |
| 57589 | RIC1 | CCI_3 | Human | Cervix | CC | 1.57e-07 | 5.96e-01 | 0.516 |
| 57589 | RIC1 | HTA11_3410_2000001011 | Human | Colorectum | AD | 4.76e-09 | -4.06e-01 | 0.0155 |
| 57589 | RIC1 | HTA11_696_2000001011 | Human | Colorectum | AD | 4.42e-04 | -2.98e-01 | -0.1464 |
| 57589 | RIC1 | HTA11_866_2000001011 | Human | Colorectum | AD | 6.01e-05 | -3.25e-01 | -0.1001 |
| 57589 | RIC1 | HTA11_866_3004761011 | Human | Colorectum | AD | 2.87e-04 | -3.66e-01 | 0.096 |
| 57589 | RIC1 | HTA11_7696_3000711011 | Human | Colorectum | AD | 3.77e-09 | -3.83e-01 | 0.0674 |
| 57589 | RIC1 | HTA11_99999970781_79442 | Human | Colorectum | MSS | 1.39e-05 | -3.12e-01 | 0.294 |
| 57589 | RIC1 | HTA11_99999971662_82457 | Human | Colorectum | MSS | 2.35e-03 | -2.64e-01 | 0.3859 |
| 57589 | RIC1 | HTA11_99999973899_84307 | Human | Colorectum | MSS | 2.52e-03 | -5.04e-01 | 0.2585 |
| 57589 | RIC1 | HTA11_99999974143_84620 | Human | Colorectum | MSS | 8.57e-13 | -4.42e-01 | 0.3005 |
| 57589 | RIC1 | A001-C-207 | Human | Colorectum | FAP | 9.67e-03 | -2.40e-01 | 0.1278 |
| 57589 | RIC1 | A015-C-203 | Human | Colorectum | FAP | 1.96e-19 | -3.79e-01 | -0.1294 |
| 57589 | RIC1 | A015-C-204 | Human | Colorectum | FAP | 3.22e-04 | -2.28e-01 | -0.0228 |
| 57589 | RIC1 | A014-C-040 | Human | Colorectum | FAP | 2.69e-03 | -4.05e-01 | -0.1184 |
| 57589 | RIC1 | A002-C-201 | Human | Colorectum | FAP | 1.37e-08 | -2.36e-01 | 0.0324 |
| 57589 | RIC1 | A002-C-203 | Human | Colorectum | FAP | 8.71e-03 | -1.58e-01 | 0.2786 |
| 57589 | RIC1 | A001-C-119 | Human | Colorectum | FAP | 4.83e-05 | -3.84e-01 | -0.1557 |
| 57589 | RIC1 | A001-C-108 | Human | Colorectum | FAP | 9.15e-16 | -3.60e-01 | -0.0272 |
| Page: 1 2 3 4 5 6 |
| Tissue | Expression Dynamics | Abbreviation |
| Cervix | 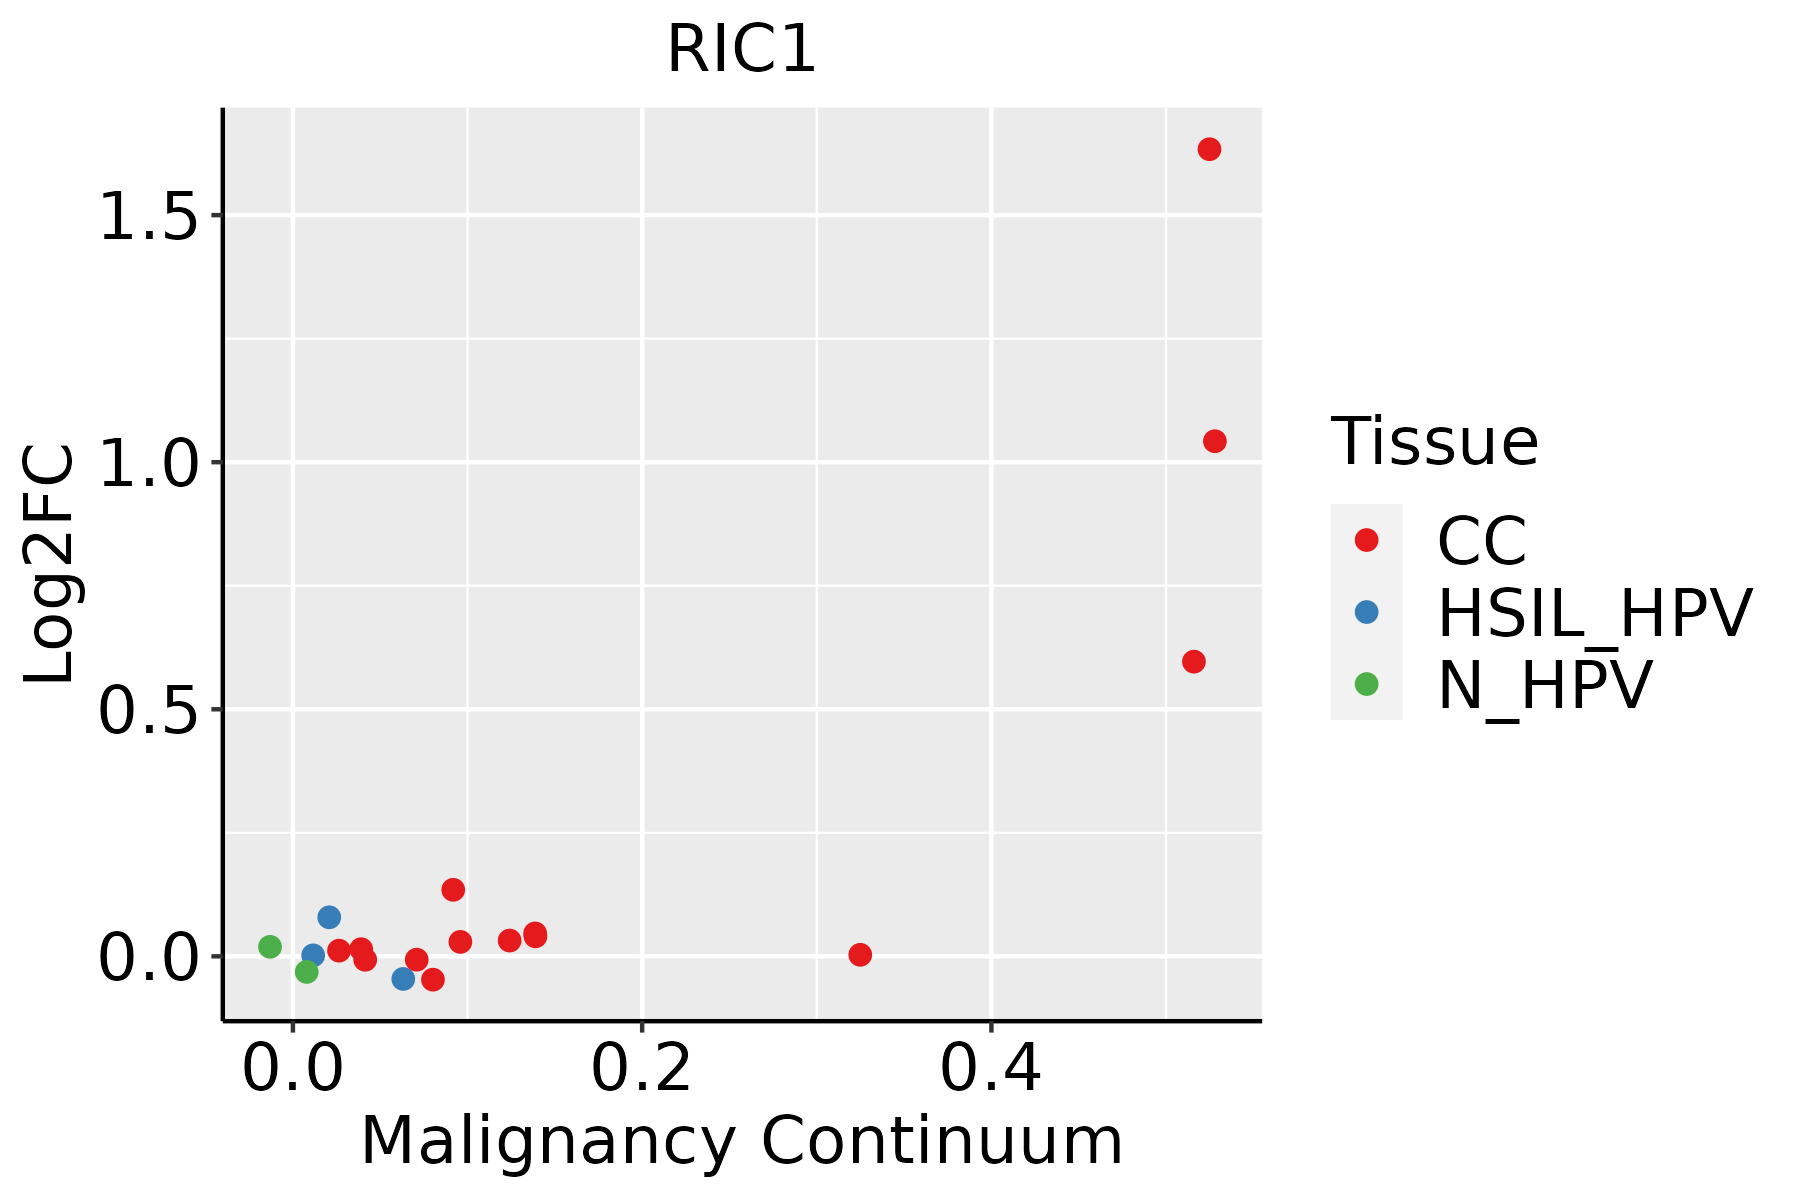 | CC: Cervix cancer |
| HSIL_HPV: HPV-infected high-grade squamous intraepithelial lesions | ||
| N_HPV: HPV-infected normal cervix | ||
| Colorectum (GSE201348) | 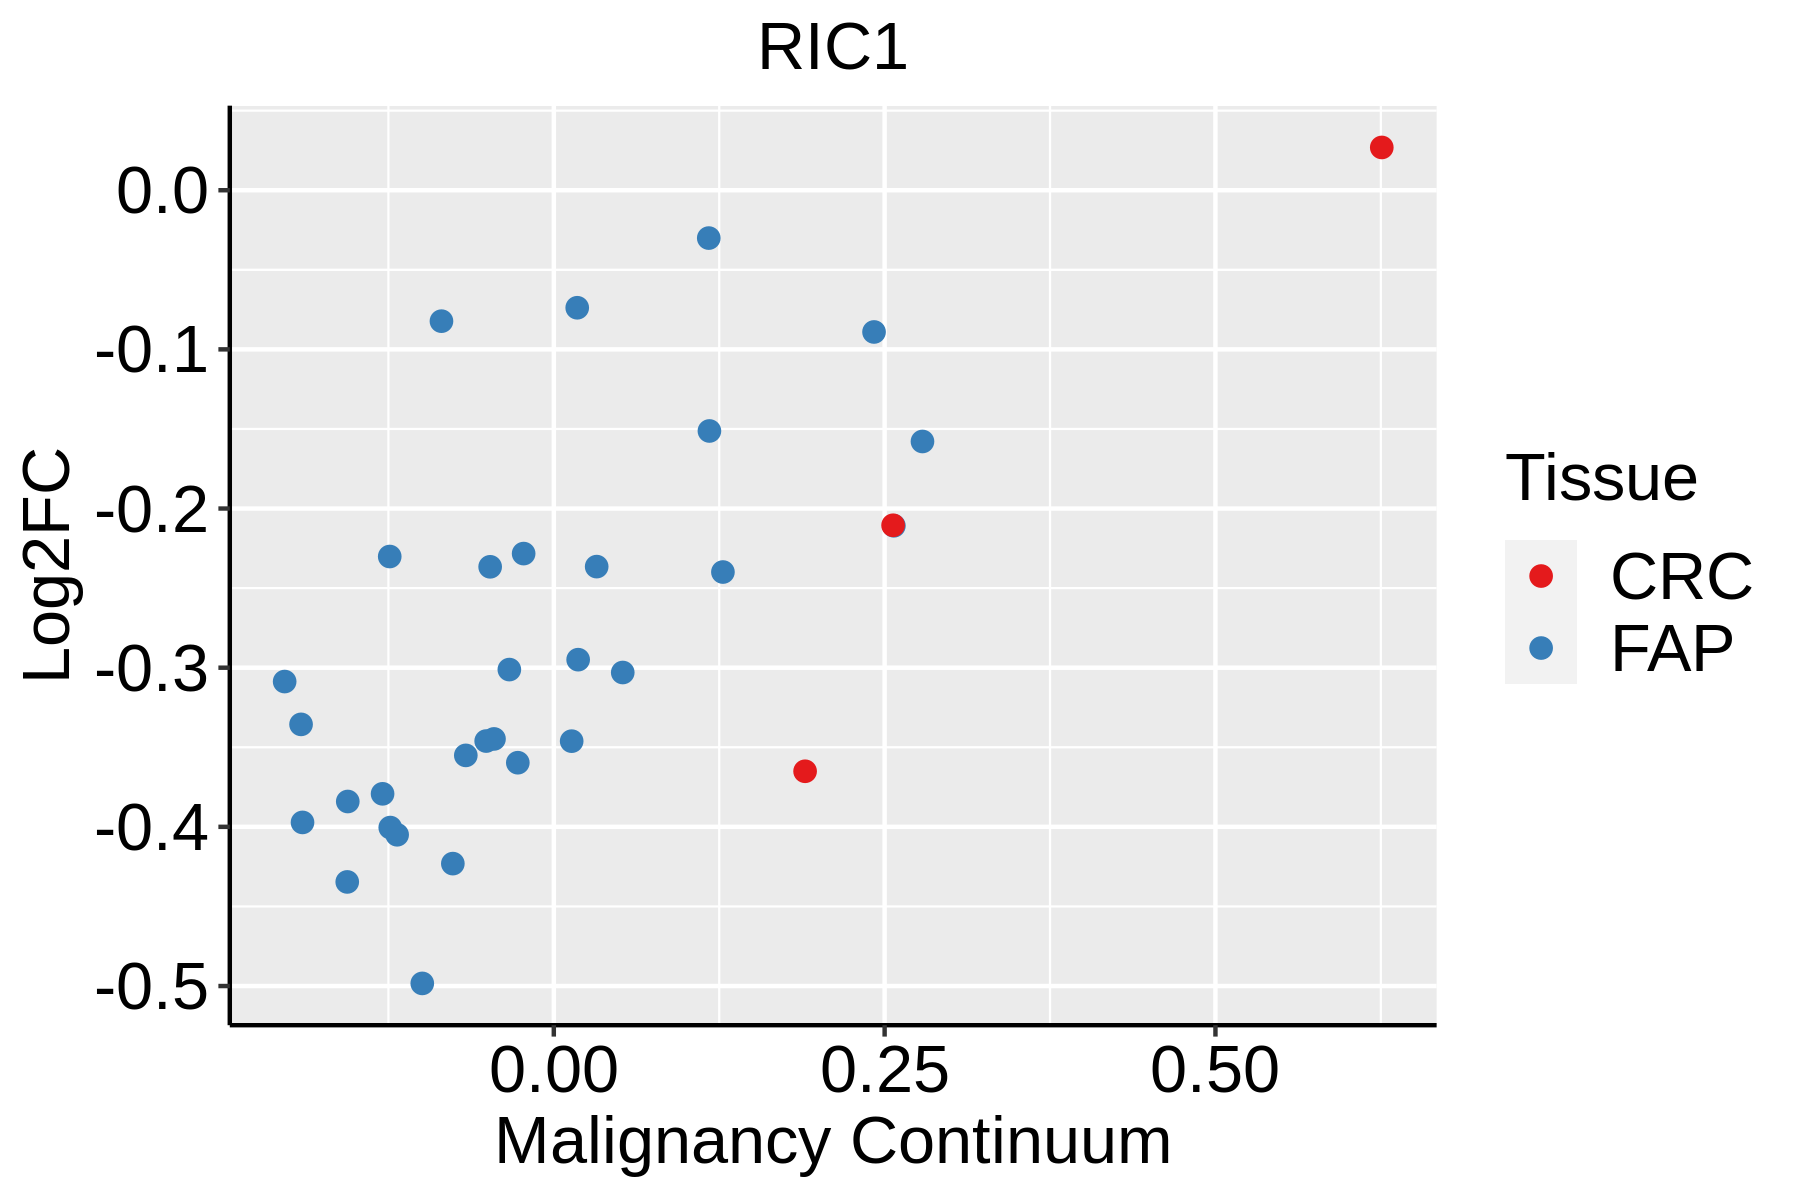 | FAP: Familial adenomatous polyposis |
| CRC: Colorectal cancer | ||
| Colorectum (HTA11) |  | AD: Adenomas |
| SER: Sessile serrated lesions | ||
| MSI-H: Microsatellite-high colorectal cancer | ||
| MSS: Microsatellite stable colorectal cancer | ||
| Endometrium | 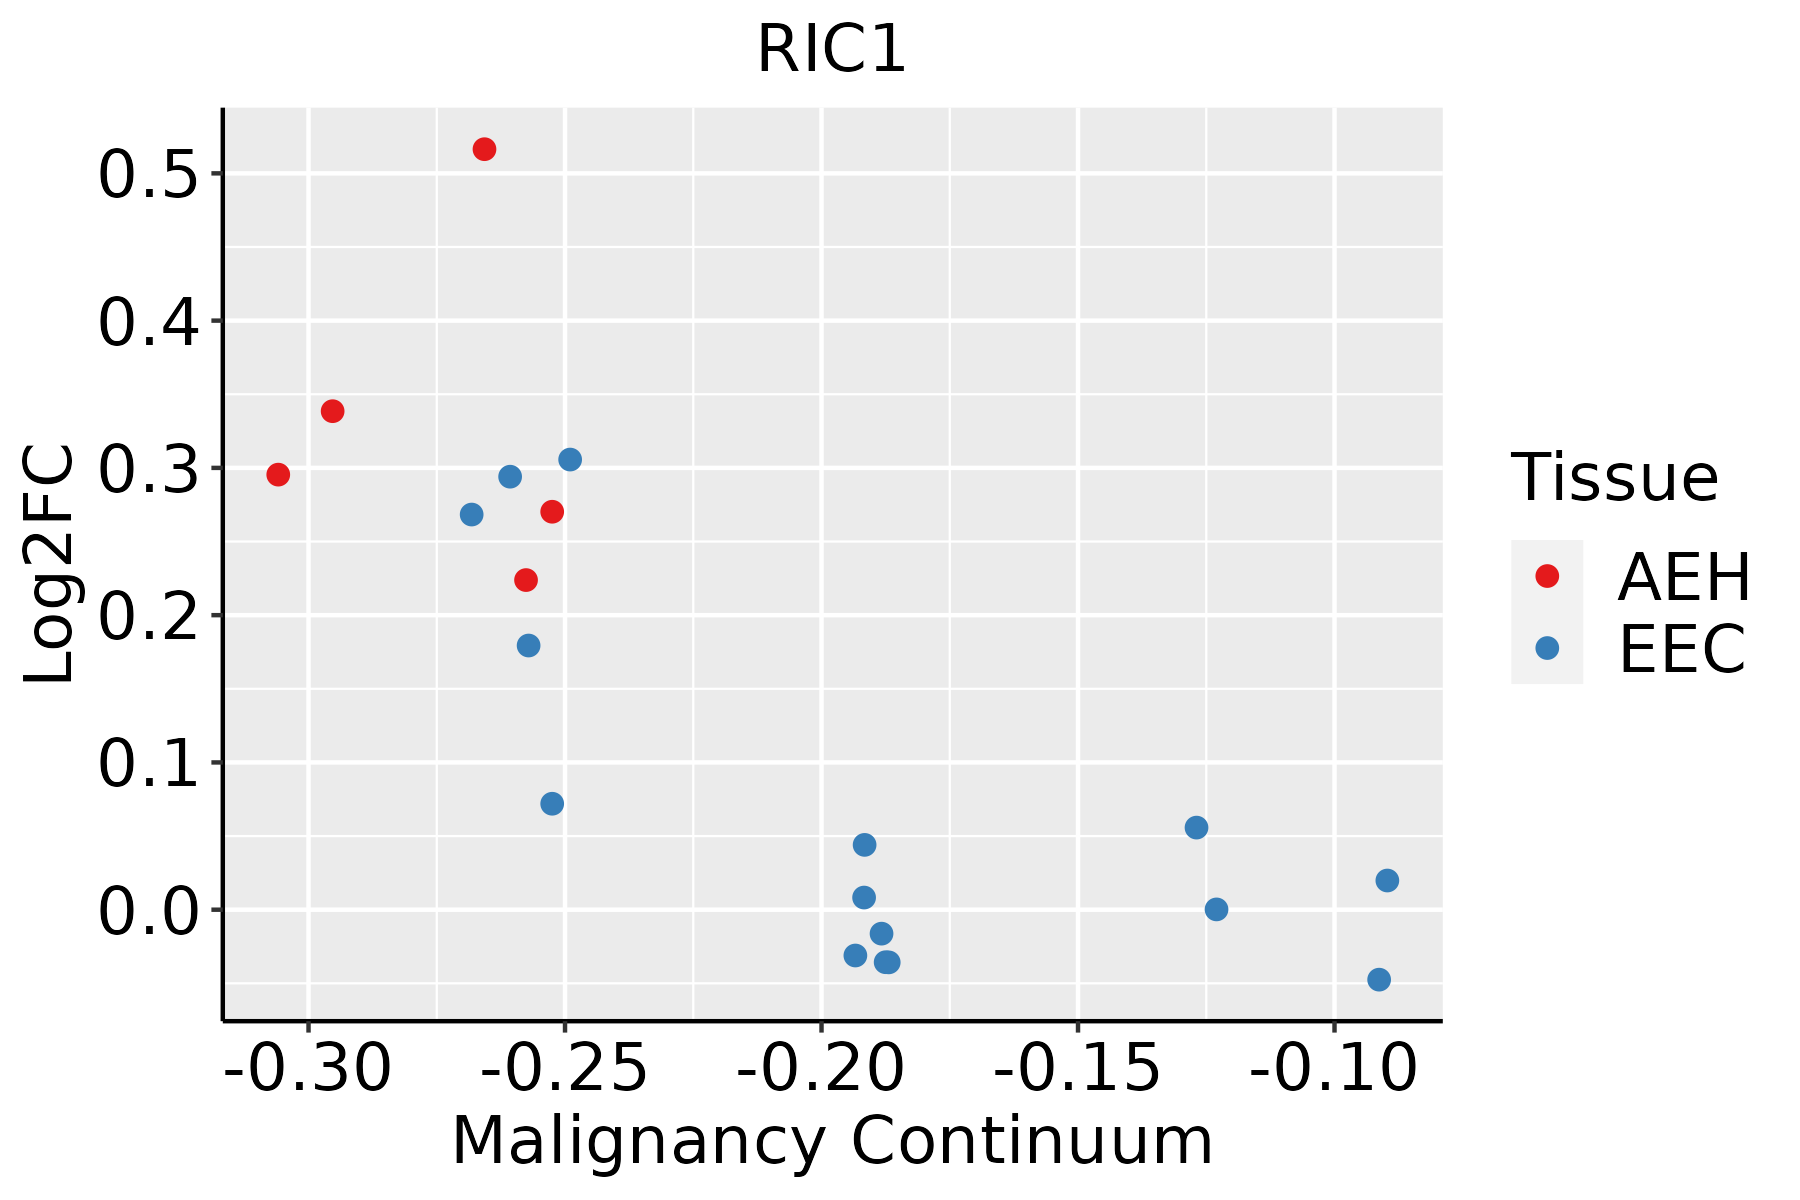 | AEH: Atypical endometrial hyperplasia |
| EEC: Endometrioid Cancer | ||
| Esophagus | 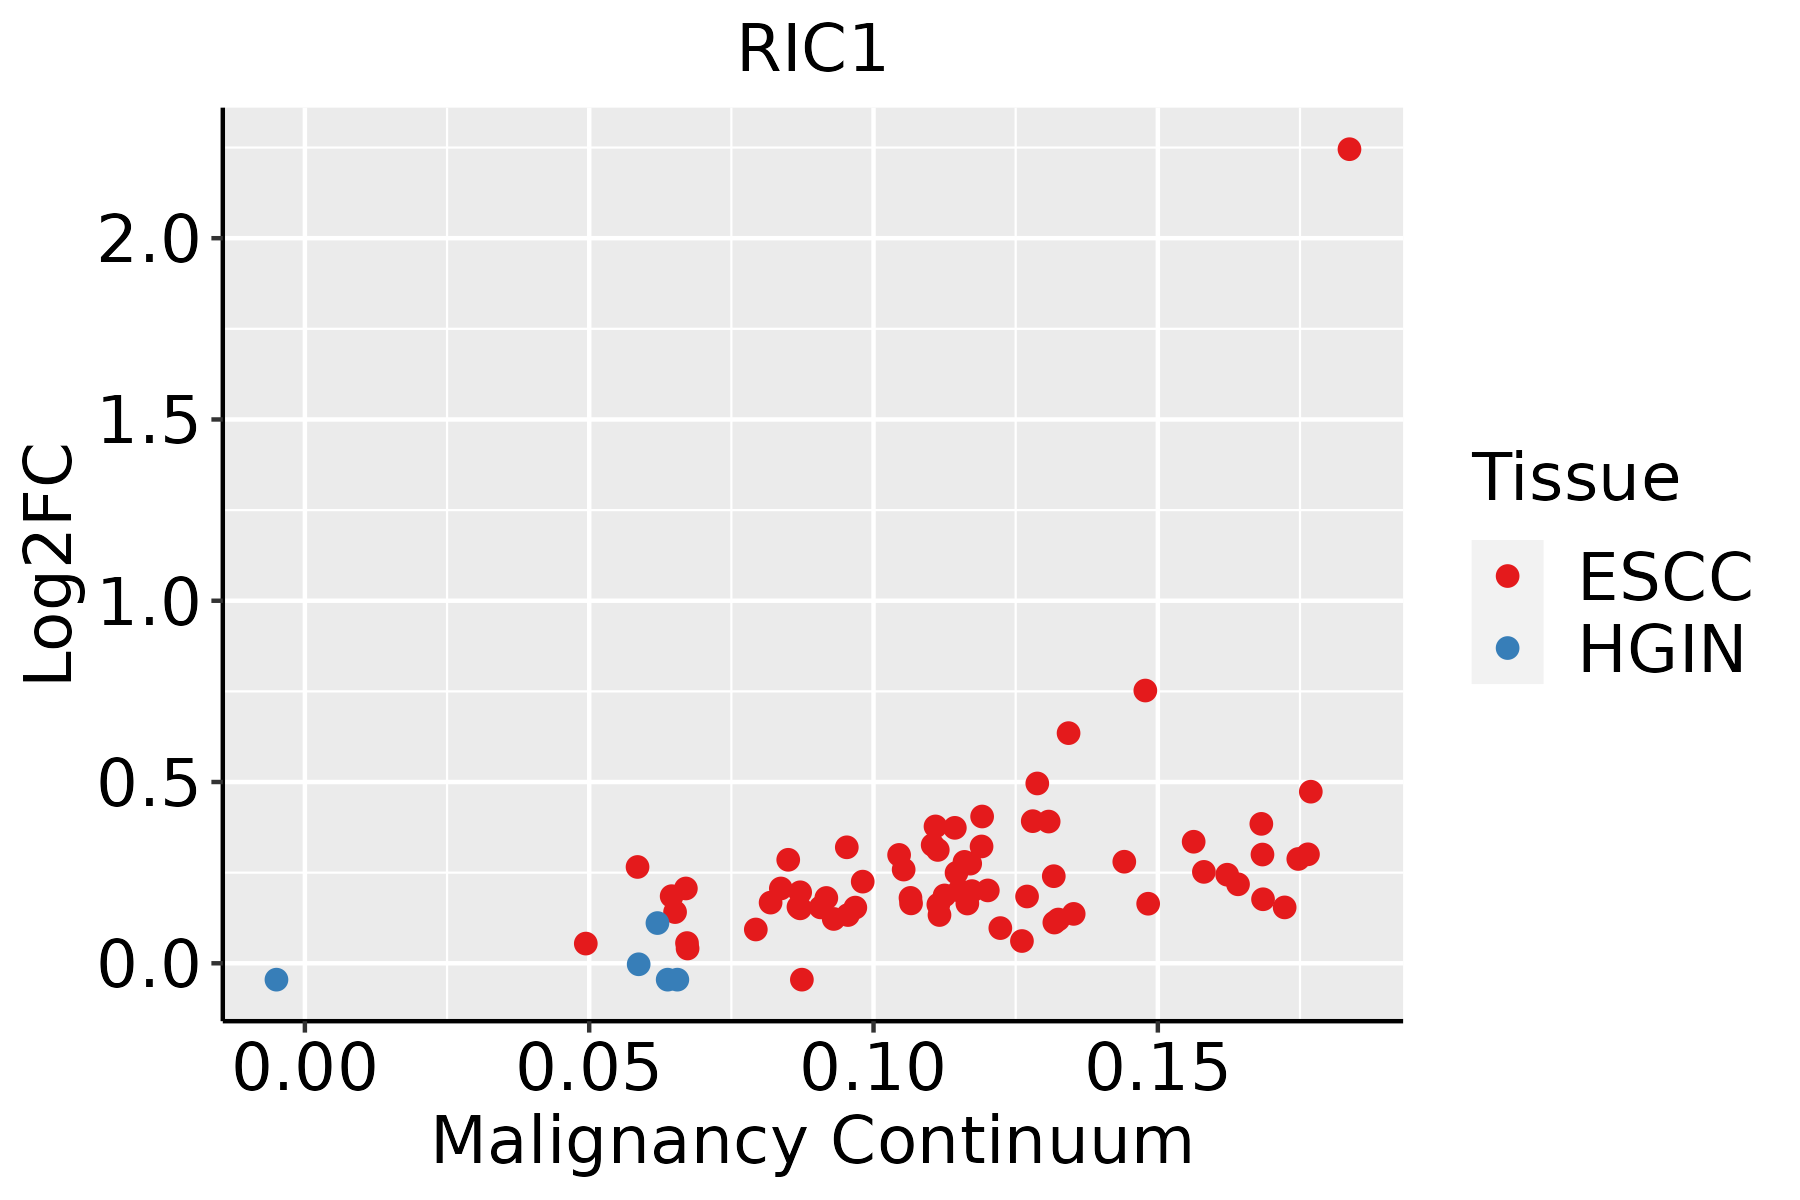 | ESCC: Esophageal squamous cell carcinoma |
| HGIN: High-grade intraepithelial neoplasias | ||
| LGIN: Low-grade intraepithelial neoplasias |
| ∗log2FC in expression of this searched gene in stem-like cells from each diseased tissue sample relative to stem-like cells in normal samples in each tissue plotted against the malignancy continuum. Samples are colored based on if they are from different disease stage. |
Top |
Malignant transformation related pathway analysis |
| Find out the enriched GO biological processes and KEGG pathways involved in transition from healthy to precancer to cancer |
| Tissue | Disease Stage | Enriched GO biological Processes |
| Colorectum | AD |  |
| Colorectum | SER |  |
| Colorectum | MSS |  |
| Colorectum | MSI-H |  |
| Colorectum | FAP |  |
| ∗Top 15 enriched GO BP terms are showed in the bar plot of each disease state in each tissue. Each row represents a significant GO biological process which is colored according to the -log10(p.adjust). |
| Page: 1 2 3 4 5 6 7 8 9 |
| GO ID | Tissue | Disease Stage | Description | Gene Ratio | Bg Ratio | pvalue | p.adjust | Count |
| GO:004217610 | Cervix | CC | regulation of protein catabolic process | 104/2311 | 391/18723 | 9.39e-15 | 9.36e-12 | 104 |
| GO:190336210 | Cervix | CC | regulation of cellular protein catabolic process | 72/2311 | 255/18723 | 5.98e-12 | 2.10e-09 | 72 |
| GO:00430877 | Cervix | CC | regulation of GTPase activity | 79/2311 | 348/18723 | 4.21e-08 | 2.60e-06 | 79 |
| GO:003133010 | Cervix | CC | negative regulation of cellular catabolic process | 63/2311 | 262/18723 | 1.10e-07 | 5.68e-06 | 63 |
| GO:000989510 | Cervix | CC | negative regulation of catabolic process | 69/2311 | 320/18723 | 2.15e-06 | 6.55e-05 | 69 |
| GO:19033639 | Cervix | CC | negative regulation of cellular protein catabolic process | 24/2311 | 75/18723 | 6.43e-06 | 1.55e-04 | 24 |
| GO:00435476 | Cervix | CC | positive regulation of GTPase activity | 53/2311 | 255/18723 | 8.72e-05 | 1.16e-03 | 53 |
| GO:004217710 | Cervix | CC | negative regulation of protein catabolic process | 30/2311 | 121/18723 | 1.23e-04 | 1.53e-03 | 30 |
| GO:00161977 | Cervix | CC | endosomal transport | 48/2311 | 230/18723 | 1.65e-04 | 1.97e-03 | 48 |
| GO:1903053 | Cervix | CC | regulation of extracellular matrix organization | 14/2311 | 48/18723 | 1.48e-03 | 1.15e-02 | 14 |
| GO:00164827 | Cervix | CC | cytosolic transport | 33/2311 | 168/18723 | 4.43e-03 | 2.70e-02 | 33 |
| GO:0030198 | Cervix | CC | extracellular matrix organization | 52/2311 | 301/18723 | 7.43e-03 | 3.98e-02 | 52 |
| GO:0043062 | Cervix | CC | extracellular structure organization | 52/2311 | 302/18723 | 7.92e-03 | 4.17e-02 | 52 |
| GO:0045229 | Cervix | CC | external encapsulating structure organization | 52/2311 | 304/18723 | 9.00e-03 | 4.57e-02 | 52 |
| GO:0042176 | Colorectum | AD | regulation of protein catabolic process | 160/3918 | 391/18723 | 1.06e-19 | 7.34e-17 | 160 |
| GO:1903362 | Colorectum | AD | regulation of cellular protein catabolic process | 109/3918 | 255/18723 | 2.14e-15 | 6.08e-13 | 109 |
| GO:0009895 | Colorectum | AD | negative regulation of catabolic process | 124/3918 | 320/18723 | 1.66e-13 | 3.35e-11 | 124 |
| GO:0031330 | Colorectum | AD | negative regulation of cellular catabolic process | 104/3918 | 262/18723 | 2.66e-12 | 3.96e-10 | 104 |
| GO:0016197 | Colorectum | AD | endosomal transport | 90/3918 | 230/18723 | 1.88e-10 | 1.73e-08 | 90 |
| GO:0042177 | Colorectum | AD | negative regulation of protein catabolic process | 55/3918 | 121/18723 | 1.19e-09 | 8.85e-08 | 55 |
| Page: 1 2 3 4 5 |
| Pathway ID | Tissue | Disease Stage | Description | Gene Ratio | Bg Ratio | pvalue | p.adjust | qvalue | Count |
| Page: 1 |
Top |
Cell-cell communication analysis |
| Identification of potential cell-cell interactions between two cell types and their ligand-receptor pairs for different disease states |
| Ligand | Receptor | LRpair | Pathway | Tissue | Disease Stage |
| Page: 1 |
Top |
Single-cell gene regulatory network inference analysis |
| Find out the significant the regulons (TFs) and the target genes of each regulon across cell types for different disease states |
| TF | Cell Type | Tissue | Disease Stage | Target Gene | RSS | Regulon Activity |
| ∗The dot plots of a searched regulon are shown for all cell subpopulations in each disease state of each tissue based on the regulon specific score inferred using pySCENIC and by calculating the average expression. |
| Page: 1 |
Top |
Somatic mutation of malignant transformation related genes |
| Annotation of somatic variants for genes involved in malignant transformation |
| Hugo Symbol | Variant Class | Variant Classification | dbSNP RS | HGVSc | HGVSp | HGVSp Short | SWISSPROT | BIOTYPE | SIFT | PolyPhen | Tumor Sample Barcode | Tissue | Histology | Sex | Age | Stage | Therapy Types | Drugs | Outcome |
| RIC1 | SNV | Missense_Mutation | c.2884C>G | p.Leu962Val | p.L962V | Q4ADV7 | protein_coding | deleterious(0) | probably_damaging(0.999) | TCGA-A2-A0EY-01 | Breast | breast invasive carcinoma | Female | <65 | I/II | Chemotherapy | adriamycin | SD | |
| RIC1 | SNV | Missense_Mutation | c.3255N>T | p.Gln1085His | p.Q1085H | Q4ADV7 | protein_coding | tolerated(0.45) | benign(0.011) | TCGA-A2-A25A-01 | Breast | breast invasive carcinoma | Female | <65 | I/II | Unspecific | Cytoxan | SD | |
| RIC1 | SNV | Missense_Mutation | c.2816N>T | p.Ala939Val | p.A939V | Q4ADV7 | protein_coding | deleterious(0) | probably_damaging(1) | TCGA-A8-A08F-01 | Breast | breast invasive carcinoma | Female | <65 | III/IV | Chemotherapy | 5-fluorouracil | CR | |
| RIC1 | SNV | Missense_Mutation | c.2822N>T | p.Ser941Phe | p.S941F | Q4ADV7 | protein_coding | deleterious(0) | probably_damaging(0.996) | TCGA-A8-A095-01 | Breast | breast invasive carcinoma | Female | <65 | I/II | Chemotherapy | 5-fluorouracil | CR | |
| RIC1 | SNV | Missense_Mutation | c.2875N>A | p.Ala959Thr | p.A959T | Q4ADV7 | protein_coding | deleterious(0) | probably_damaging(0.999) | TCGA-AC-A23H-01 | Breast | breast invasive carcinoma | Female | >=65 | I/II | Unknown | Unknown | PD | |
| RIC1 | SNV | Missense_Mutation | novel | c.1097G>T | p.Ser366Ile | p.S366I | Q4ADV7 | protein_coding | tolerated(0.06) | benign(0.028) | TCGA-AC-A8OR-01 | Breast | breast invasive carcinoma | Female | >=65 | I/II | Unknown | Unknown | SD |
| RIC1 | SNV | Missense_Mutation | c.3750G>T | p.Met1250Ile | p.M1250I | Q4ADV7 | protein_coding | tolerated(0.1) | benign(0.015) | TCGA-AN-A0AK-01 | Breast | breast invasive carcinoma | Female | >=65 | I/II | Unknown | Unknown | SD | |
| RIC1 | SNV | Missense_Mutation | c.2140G>C | p.Ala714Pro | p.A714P | Q4ADV7 | protein_coding | deleterious(0) | probably_damaging(0.992) | TCGA-C8-A27B-01 | Breast | breast invasive carcinoma | Female | <65 | I/II | Chemotherapy | 5-fluorouracil | CR | |
| RIC1 | SNV | Missense_Mutation | novel | c.2399C>T | p.Ser800Phe | p.S800F | Q4ADV7 | protein_coding | deleterious(0.02) | benign(0.005) | TCGA-C8-A8HQ-01 | Breast | breast invasive carcinoma | Female | <65 | I/II | Unknown | Unknown | SD |
| RIC1 | SNV | Missense_Mutation | rs374147809 | c.3885N>C | p.Gln1295His | p.Q1295H | Q4ADV7 | protein_coding | deleterious(0.01) | possibly_damaging(0.862) | TCGA-D8-A1JA-01 | Breast | breast invasive carcinoma | Female | <65 | III/IV | Chemotherapy | adriamycin | PD |
| Page: 1 2 3 4 5 6 7 8 9 10 11 12 13 |
Top |
Related drugs of malignant transformation related genes |
| Identification of chemicals and drugs interact with genes involved in malignant transfromation |
| (DGIdb 4.0) |
| Entrez ID | Symbol | Category | Interaction Types | Drug Claim Name | Drug Name | PMIDs |
| Page: 1 |

Copyright 2023-Present -The University of Texas Health Science Center at Houston |