
|
|||||
|
 | |
| |
| |
| |
| |
| |
|
Gene: RHPN2 |
Gene summary for RHPN2 |
| Gene information | Species | Human | Gene symbol | RHPN2 | Gene ID | 85415 |
| Gene name | rhophilin Rho GTPase binding protein 2 | |
| Gene Alias | P76RBE | |
| Cytomap | 19q13.11 | |
| Gene Type | protein-coding | GO ID | GO:0003008 | UniProtAcc | Q8IUC4 |
Top |
Malignant transformation analysis |
| Identification of the aberrant gene expression in precancerous and cancerous lesions by comparing the gene expression of stem-like cells in diseased tissues with normal stem cells |
| Entrez ID | Symbol | Replicates | Species | Organ | Tissue | Adj P-value | Log2FC | Malignancy |
| 85415 | RHPN2 | HTA11_411_2000001011 | Human | Colorectum | SER | 1.11e-03 | 1.01e+00 | -0.2602 |
| 85415 | RHPN2 | HTA11_696_2000001011 | Human | Colorectum | AD | 1.00e-02 | 4.41e-01 | -0.1464 |
| 85415 | RHPN2 | HTA11_1391_2000001011 | Human | Colorectum | AD | 7.44e-04 | 6.07e-01 | -0.059 |
| 85415 | RHPN2 | HTA11_546_2000001011 | Human | Colorectum | AD | 1.02e-04 | 5.65e-01 | -0.0842 |
| 85415 | RHPN2 | HTA11_99999965062_69753 | Human | Colorectum | MSI-H | 1.03e-02 | 8.52e-01 | 0.3487 |
| 85415 | RHPN2 | HTA11_99999965104_69814 | Human | Colorectum | MSS | 9.31e-08 | 7.21e-01 | 0.281 |
| 85415 | RHPN2 | A015-C-203 | Human | Colorectum | FAP | 6.52e-17 | -1.67e-01 | -0.1294 |
| 85415 | RHPN2 | A002-C-201 | Human | Colorectum | FAP | 1.71e-05 | -9.53e-02 | 0.0324 |
| 85415 | RHPN2 | A001-C-119 | Human | Colorectum | FAP | 2.01e-05 | 2.68e-01 | -0.1557 |
| 85415 | RHPN2 | A001-C-108 | Human | Colorectum | FAP | 5.52e-10 | -1.25e-01 | -0.0272 |
| 85415 | RHPN2 | A002-C-205 | Human | Colorectum | FAP | 8.16e-14 | -1.68e-03 | -0.1236 |
| 85415 | RHPN2 | A015-C-005 | Human | Colorectum | FAP | 7.27e-13 | 5.79e-01 | -0.0336 |
| 85415 | RHPN2 | A015-C-006 | Human | Colorectum | FAP | 7.62e-08 | -1.07e-01 | -0.0994 |
| 85415 | RHPN2 | A015-C-106 | Human | Colorectum | FAP | 2.05e-04 | 2.11e-02 | -0.0511 |
| 85415 | RHPN2 | A002-C-114 | Human | Colorectum | FAP | 7.28e-12 | 2.14e-02 | -0.1561 |
| 85415 | RHPN2 | A015-C-104 | Human | Colorectum | FAP | 1.62e-21 | -1.14e-01 | -0.1899 |
| 85415 | RHPN2 | A001-C-014 | Human | Colorectum | FAP | 9.86e-09 | -1.20e-01 | 0.0135 |
| 85415 | RHPN2 | A002-C-016 | Human | Colorectum | FAP | 2.37e-16 | -1.46e-01 | 0.0521 |
| 85415 | RHPN2 | A015-C-002 | Human | Colorectum | FAP | 5.50e-07 | -2.82e-02 | -0.0763 |
| 85415 | RHPN2 | A001-C-203 | Human | Colorectum | FAP | 1.64e-06 | -2.15e-02 | -0.0481 |
| Page: 1 2 3 4 5 6 |
| Tissue | Expression Dynamics | Abbreviation |
| Colorectum (GSE201348) |  | FAP: Familial adenomatous polyposis |
| CRC: Colorectal cancer | ||
| Colorectum (HTA11) |  | AD: Adenomas |
| SER: Sessile serrated lesions | ||
| MSI-H: Microsatellite-high colorectal cancer | ||
| MSS: Microsatellite stable colorectal cancer | ||
| Endometrium |  | AEH: Atypical endometrial hyperplasia |
| EEC: Endometrioid Cancer | ||
| Esophagus |  | ESCC: Esophageal squamous cell carcinoma |
| HGIN: High-grade intraepithelial neoplasias | ||
| LGIN: Low-grade intraepithelial neoplasias | ||
| GC | 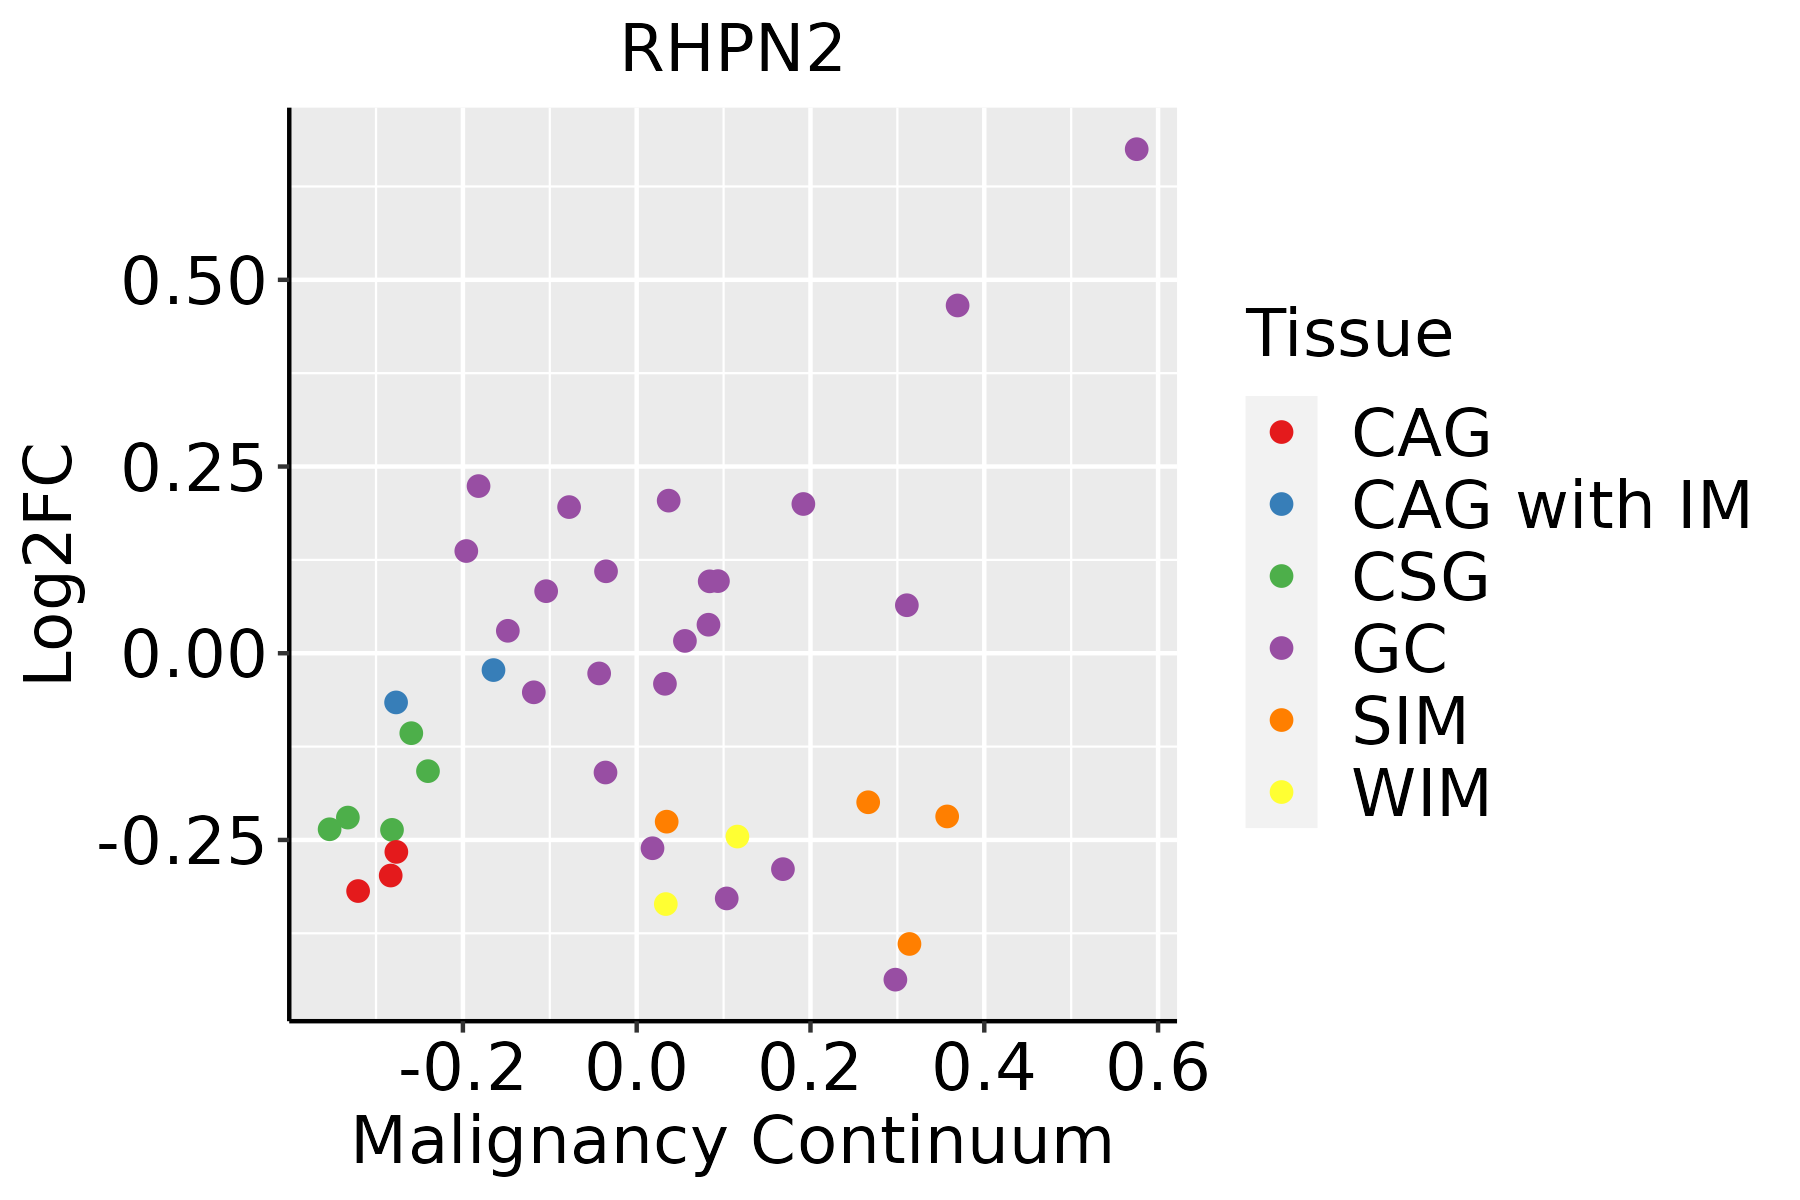 | CAG: Chronic atrophic gastritis |
| CAG with IM: Chronic atrophic gastritis with intestinal metaplasia | ||
| CSG: Chronic superficial gastritis | ||
| GC: Gastric cancer | ||
| SIM: Severe intestinal metaplasia | ||
| WIM: Wild intestinal metaplasia | ||
| Liver | 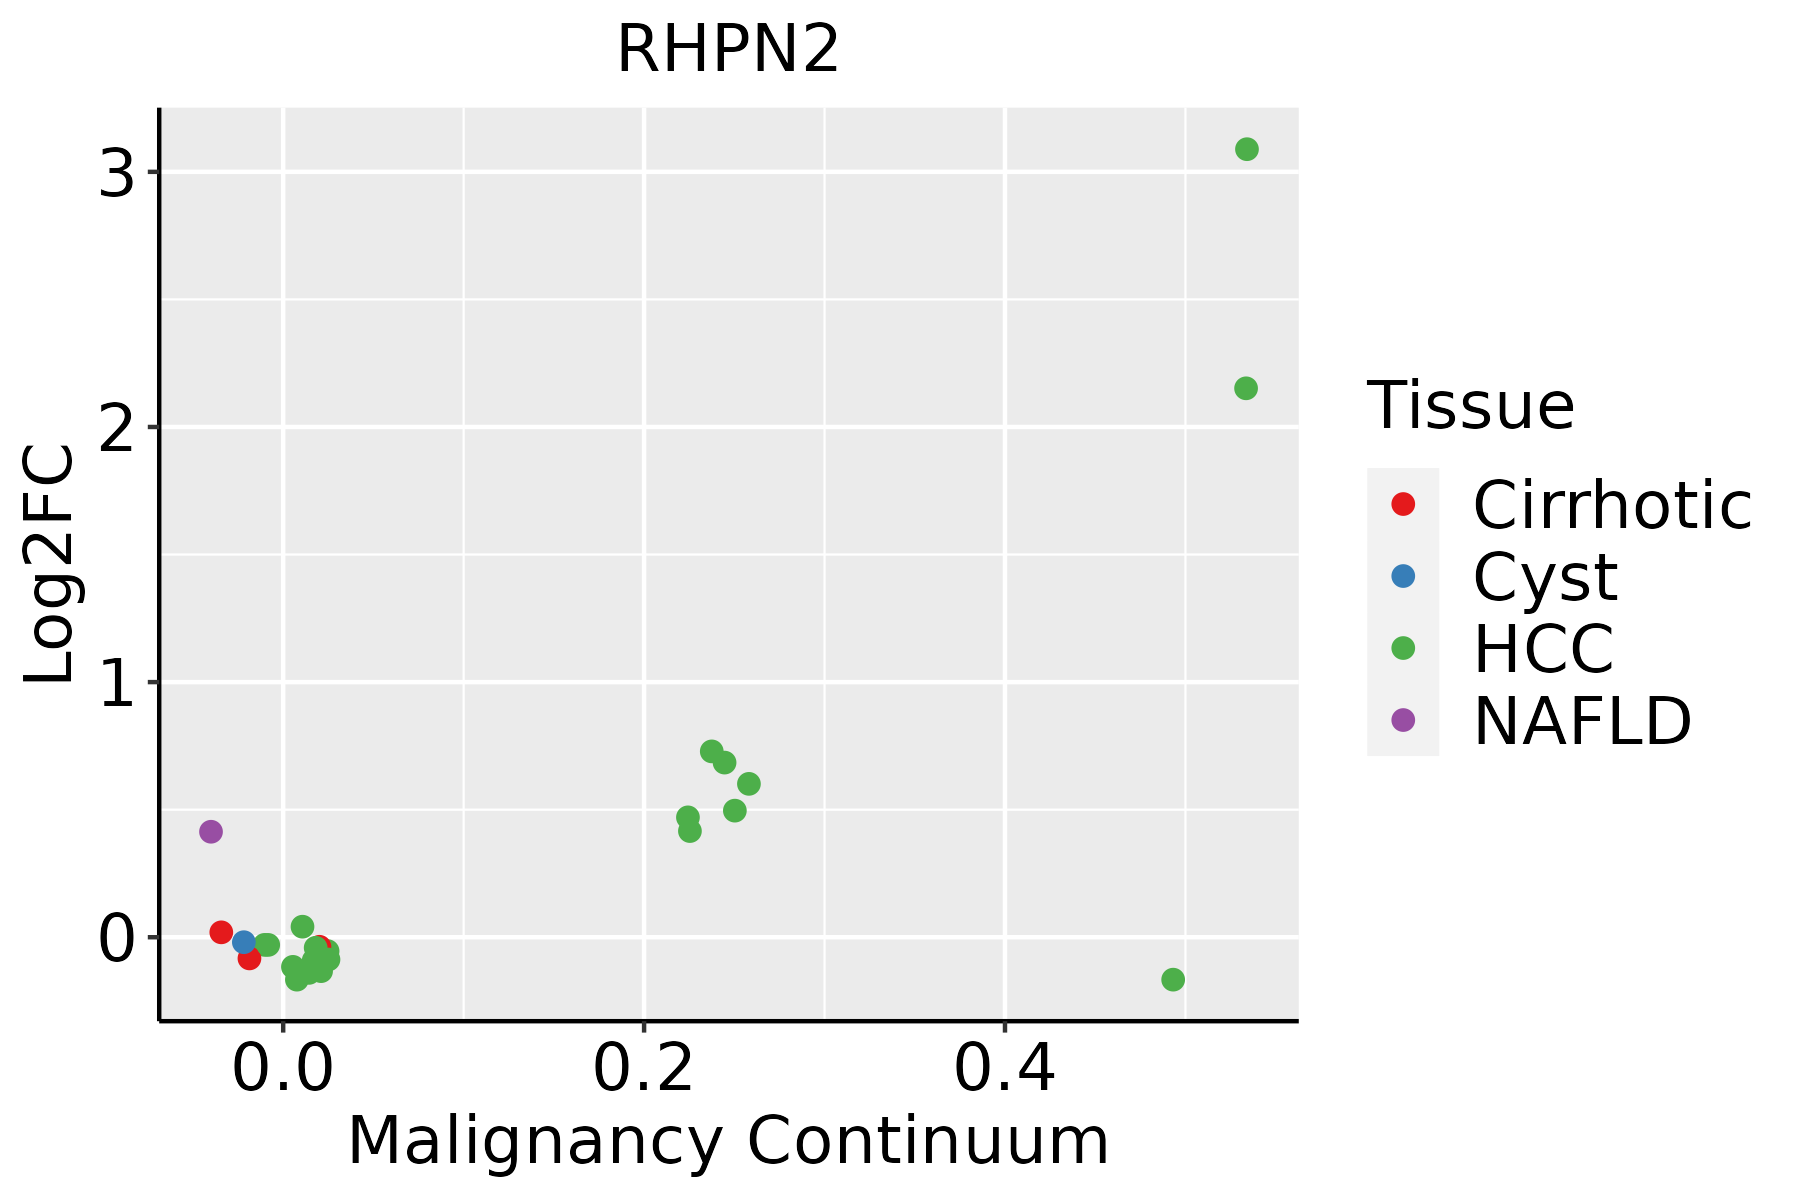 | HCC: Hepatocellular carcinoma |
| NAFLD: Non-alcoholic fatty liver disease |
| ∗log2FC in expression of this searched gene in stem-like cells from each diseased tissue sample relative to stem-like cells in normal samples in each tissue plotted against the malignancy continuum. Samples are colored based on if they are from different disease stage. |
Top |
Malignant transformation related pathway analysis |
| Find out the enriched GO biological processes and KEGG pathways involved in transition from healthy to precancer to cancer |
| Tissue | Disease Stage | Enriched GO biological Processes |
| Colorectum | AD |  |
| Colorectum | SER |  |
| Colorectum | MSS |  |
| Colorectum | MSI-H |  |
| Colorectum | FAP |  |
| ∗Top 15 enriched GO BP terms are showed in the bar plot of each disease state in each tissue. Each row represents a significant GO biological process which is colored according to the -log10(p.adjust). |
| Page: 1 2 3 4 5 6 7 8 9 |
| GO ID | Tissue | Disease Stage | Description | Gene Ratio | Bg Ratio | pvalue | p.adjust | Count |
| GO:0007015 | Colorectum | AD | actin filament organization | 167/3918 | 442/18723 | 1.65e-16 | 7.94e-14 | 167 |
| GO:1902903 | Colorectum | AD | regulation of supramolecular fiber organization | 139/3918 | 383/18723 | 2.01e-12 | 3.19e-10 | 139 |
| GO:0032970 | Colorectum | AD | regulation of actin filament-based process | 142/3918 | 397/18723 | 4.05e-12 | 5.90e-10 | 142 |
| GO:0110053 | Colorectum | AD | regulation of actin filament organization | 108/3918 | 278/18723 | 5.02e-12 | 6.98e-10 | 108 |
| GO:0032956 | Colorectum | AD | regulation of actin cytoskeleton organization | 127/3918 | 358/18723 | 1.03e-10 | 1.04e-08 | 127 |
| GO:0010639 | Colorectum | AD | negative regulation of organelle organization | 114/3918 | 348/18723 | 1.41e-07 | 6.49e-06 | 114 |
| GO:0061572 | Colorectum | AD | actin filament bundle organization | 60/3918 | 161/18723 | 1.33e-06 | 4.23e-05 | 60 |
| GO:0051017 | Colorectum | AD | actin filament bundle assembly | 58/3918 | 157/18723 | 2.74e-06 | 7.89e-05 | 58 |
| GO:1902904 | Colorectum | AD | negative regulation of supramolecular fiber organization | 60/3918 | 167/18723 | 5.23e-06 | 1.35e-04 | 60 |
| GO:0051494 | Colorectum | AD | negative regulation of cytoskeleton organization | 58/3918 | 163/18723 | 1.04e-05 | 2.40e-04 | 58 |
| GO:0031032 | Colorectum | AD | actomyosin structure organization | 65/3918 | 196/18723 | 4.17e-05 | 7.37e-04 | 65 |
| GO:0030038 | Colorectum | AD | contractile actin filament bundle assembly | 39/3918 | 106/18723 | 1.22e-04 | 1.78e-03 | 39 |
| GO:0043149 | Colorectum | AD | stress fiber assembly | 39/3918 | 106/18723 | 1.22e-04 | 1.78e-03 | 39 |
| GO:0032231 | Colorectum | AD | regulation of actin filament bundle assembly | 37/3918 | 105/18723 | 4.82e-04 | 5.27e-03 | 37 |
| GO:0110020 | Colorectum | AD | regulation of actomyosin structure organization | 35/3918 | 100/18723 | 7.78e-04 | 7.78e-03 | 35 |
| GO:0051492 | Colorectum | AD | regulation of stress fiber assembly | 32/3918 | 91/18723 | 1.17e-03 | 1.05e-02 | 32 |
| GO:0003014 | Colorectum | AD | renal system process | 35/3918 | 110/18723 | 4.85e-03 | 3.27e-02 | 35 |
| GO:00070151 | Colorectum | SER | actin filament organization | 134/2897 | 442/18723 | 1.39e-15 | 5.70e-13 | 134 |
| GO:01100531 | Colorectum | SER | regulation of actin filament organization | 91/2897 | 278/18723 | 4.33e-13 | 1.40e-10 | 91 |
| GO:19029031 | Colorectum | SER | regulation of supramolecular fiber organization | 114/2897 | 383/18723 | 7.32e-13 | 1.95e-10 | 114 |
| Page: 1 2 3 4 5 6 7 8 9 10 11 12 13 |
| Pathway ID | Tissue | Disease Stage | Description | Gene Ratio | Bg Ratio | pvalue | p.adjust | qvalue | Count |
| Page: 1 |
Top |
Cell-cell communication analysis |
| Identification of potential cell-cell interactions between two cell types and their ligand-receptor pairs for different disease states |
| Ligand | Receptor | LRpair | Pathway | Tissue | Disease Stage |
| Page: 1 |
Top |
Single-cell gene regulatory network inference analysis |
| Find out the significant the regulons (TFs) and the target genes of each regulon across cell types for different disease states |
| TF | Cell Type | Tissue | Disease Stage | Target Gene | RSS | Regulon Activity |
| ∗The dot plots of a searched regulon are shown for all cell subpopulations in each disease state of each tissue based on the regulon specific score inferred using pySCENIC and by calculating the average expression. |
| Page: 1 |
Top |
Somatic mutation of malignant transformation related genes |
| Annotation of somatic variants for genes involved in malignant transformation |
| Hugo Symbol | Variant Class | Variant Classification | dbSNP RS | HGVSc | HGVSp | HGVSp Short | SWISSPROT | BIOTYPE | SIFT | PolyPhen | Tumor Sample Barcode | Tissue | Histology | Sex | Age | Stage | Therapy Types | Drugs | Outcome |
| RHPN2 | SNV | Missense_Mutation | c.1993N>T | p.Arg665Trp | p.R665W | Q8IUC4 | protein_coding | deleterious_low_confidence(0.02) | possibly_damaging(0.53) | TCGA-A8-A09Z-01 | Breast | breast invasive carcinoma | Female | >=65 | I/II | Unknown | Unknown | SD | |
| RHPN2 | SNV | Missense_Mutation | novel | c.1899N>C | p.Lys633Asn | p.K633N | Q8IUC4 | protein_coding | deleterious(0.05) | probably_damaging(0.999) | TCGA-AN-A046-01 | Breast | breast invasive carcinoma | Female | >=65 | I/II | Unknown | Unknown | SD |
| RHPN2 | SNV | Missense_Mutation | rs777977646 | c.1517C>T | p.Ser506Leu | p.S506L | Q8IUC4 | protein_coding | deleterious(0.01) | benign(0.282) | TCGA-EA-A3HS-01 | Cervix | cervical & endocervical cancer | Female | <65 | I/II | Unknown | Unknown | SD |
| RHPN2 | SNV | Missense_Mutation | novel | c.909N>T | p.Glu303Asp | p.E303D | Q8IUC4 | protein_coding | tolerated(0.84) | benign(0.409) | TCGA-VS-A9UJ-01 | Cervix | cervical & endocervical cancer | Female | <65 | I/II | Unknown | Unknown | PD |
| RHPN2 | SNV | Missense_Mutation | rs753950362 | c.1600G>A | p.Ala534Thr | p.A534T | Q8IUC4 | protein_coding | deleterious(0.04) | benign(0.003) | TCGA-AA-3949-01 | Colorectum | colon adenocarcinoma | Female | >=65 | III/IV | Unknown | Unknown | SD |
| RHPN2 | SNV | Missense_Mutation | rs749216712 | c.808G>A | p.Asp270Asn | p.D270N | Q8IUC4 | protein_coding | deleterious(0) | possibly_damaging(0.879) | TCGA-AA-A010-01 | Colorectum | colon adenocarcinoma | Female | <65 | I/II | Chemotherapy | folinic | CR |
| RHPN2 | SNV | Missense_Mutation | novel | c.1676T>C | p.Val559Ala | p.V559A | Q8IUC4 | protein_coding | deleterious(0) | possibly_damaging(0.748) | TCGA-CA-6717-01 | Colorectum | colon adenocarcinoma | Male | <65 | I/II | Chemotherapy | oxaliplatin | CR |
| RHPN2 | SNV | Missense_Mutation | novel | c.1876N>A | p.Asp626Asn | p.D626N | Q8IUC4 | protein_coding | tolerated(0.12) | benign(0.039) | TCGA-CA-6718-01 | Colorectum | colon adenocarcinoma | Male | <65 | I/II | Unknown | Unknown | PD |
| RHPN2 | SNV | Missense_Mutation | rs752356242 | c.1709N>T | p.Thr570Met | p.T570M | Q8IUC4 | protein_coding | deleterious(0.04) | possibly_damaging(0.498) | TCGA-CK-5916-01 | Colorectum | colon adenocarcinoma | Female | >=65 | I/II | Unknown | Unknown | PD |
| RHPN2 | SNV | Missense_Mutation | rs761330344 | c.1273N>T | p.Arg425Trp | p.R425W | Q8IUC4 | protein_coding | deleterious(0.02) | probably_damaging(1) | TCGA-CM-4743-01 | Colorectum | colon adenocarcinoma | Male | >=65 | I/II | Chemotherapy | capecitabine | SD |
| Page: 1 2 3 4 5 6 7 |
Top |
Related drugs of malignant transformation related genes |
| Identification of chemicals and drugs interact with genes involved in malignant transfromation |
| (DGIdb 4.0) |
| Entrez ID | Symbol | Category | Interaction Types | Drug Claim Name | Drug Name | PMIDs |
| Page: 1 |

Copyright 2023-Present -The University of Texas Health Science Center at Houston |