| Tissue | Expression Dynamics | Abbreviation |
| Breast | 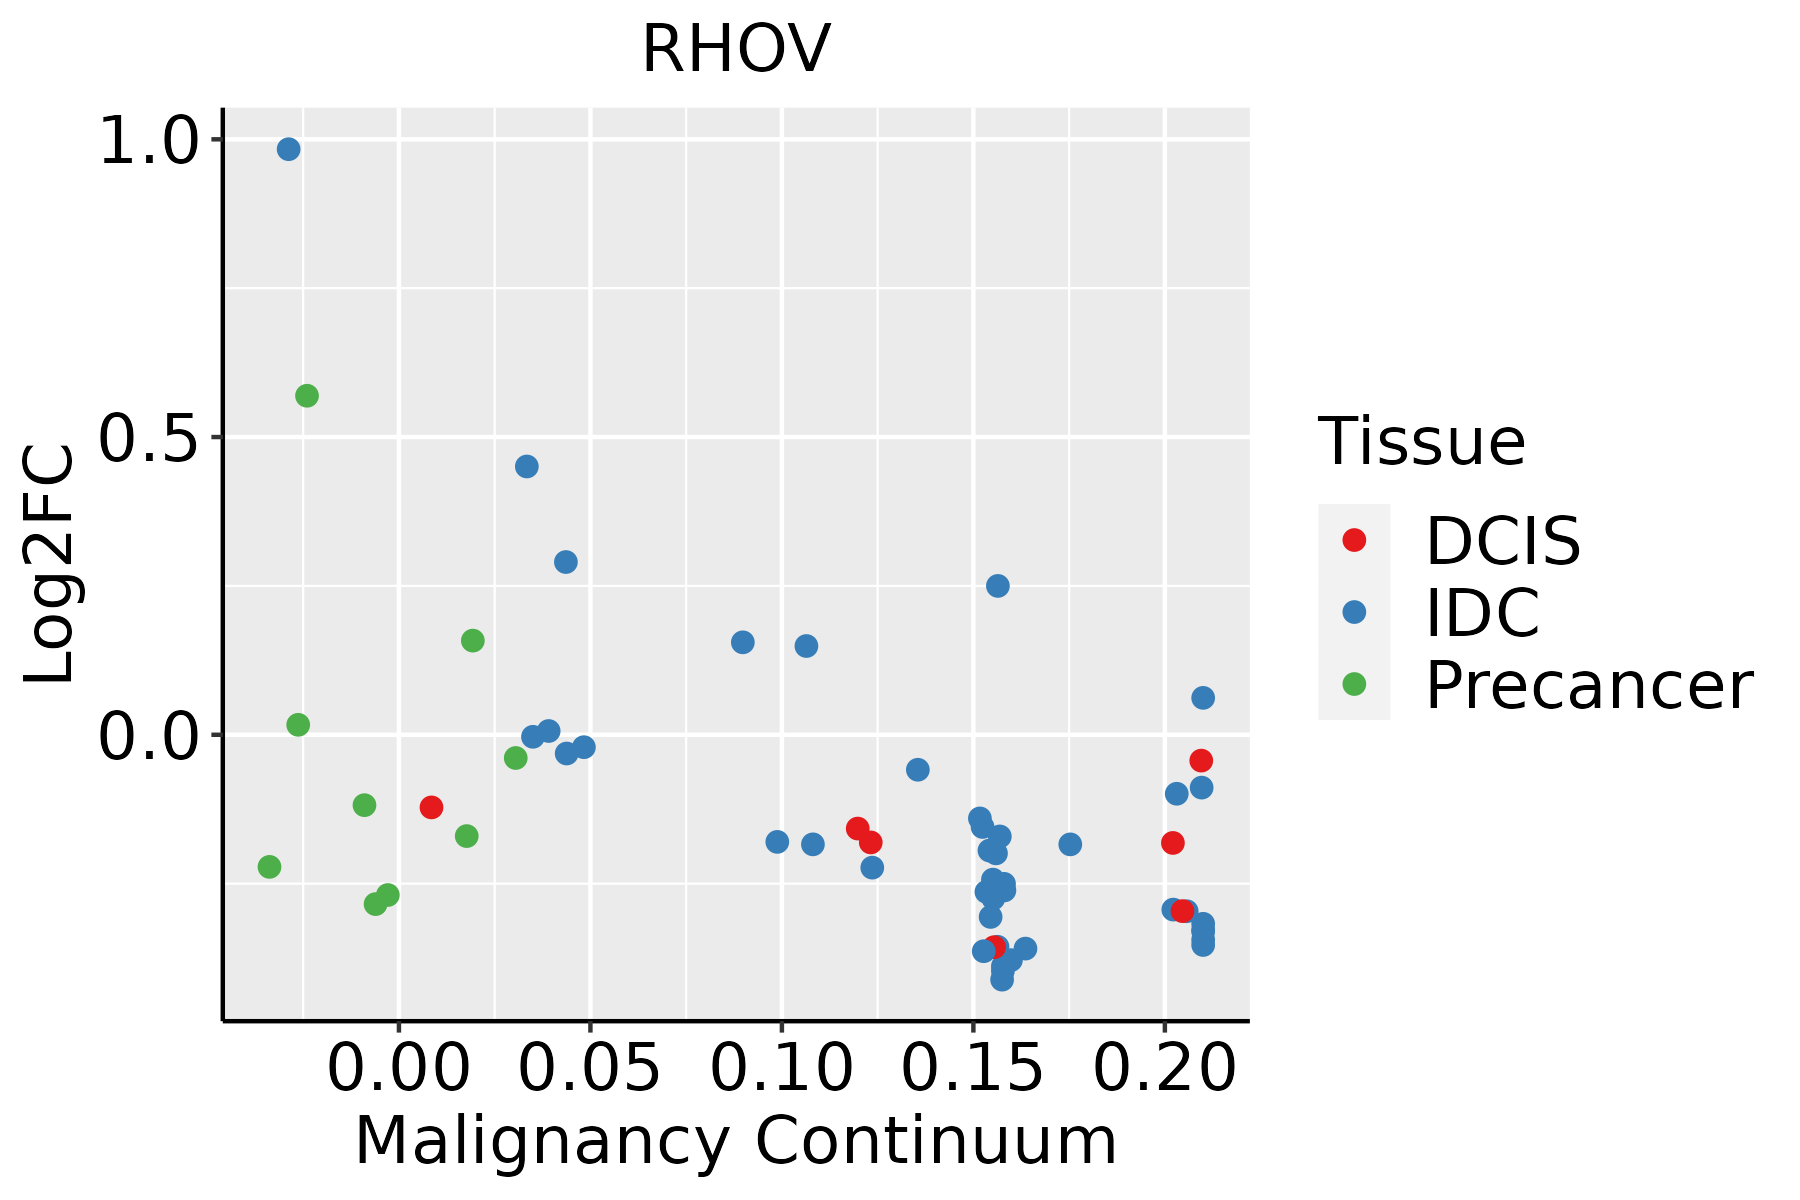 | IDC: Invasive ductal carcinoma |
| DCIS: Ductal carcinoma in situ |
| Precancer(BRCA1-mut): Precancerous lesion from BRCA1 mutation carriers |
| Cervix | 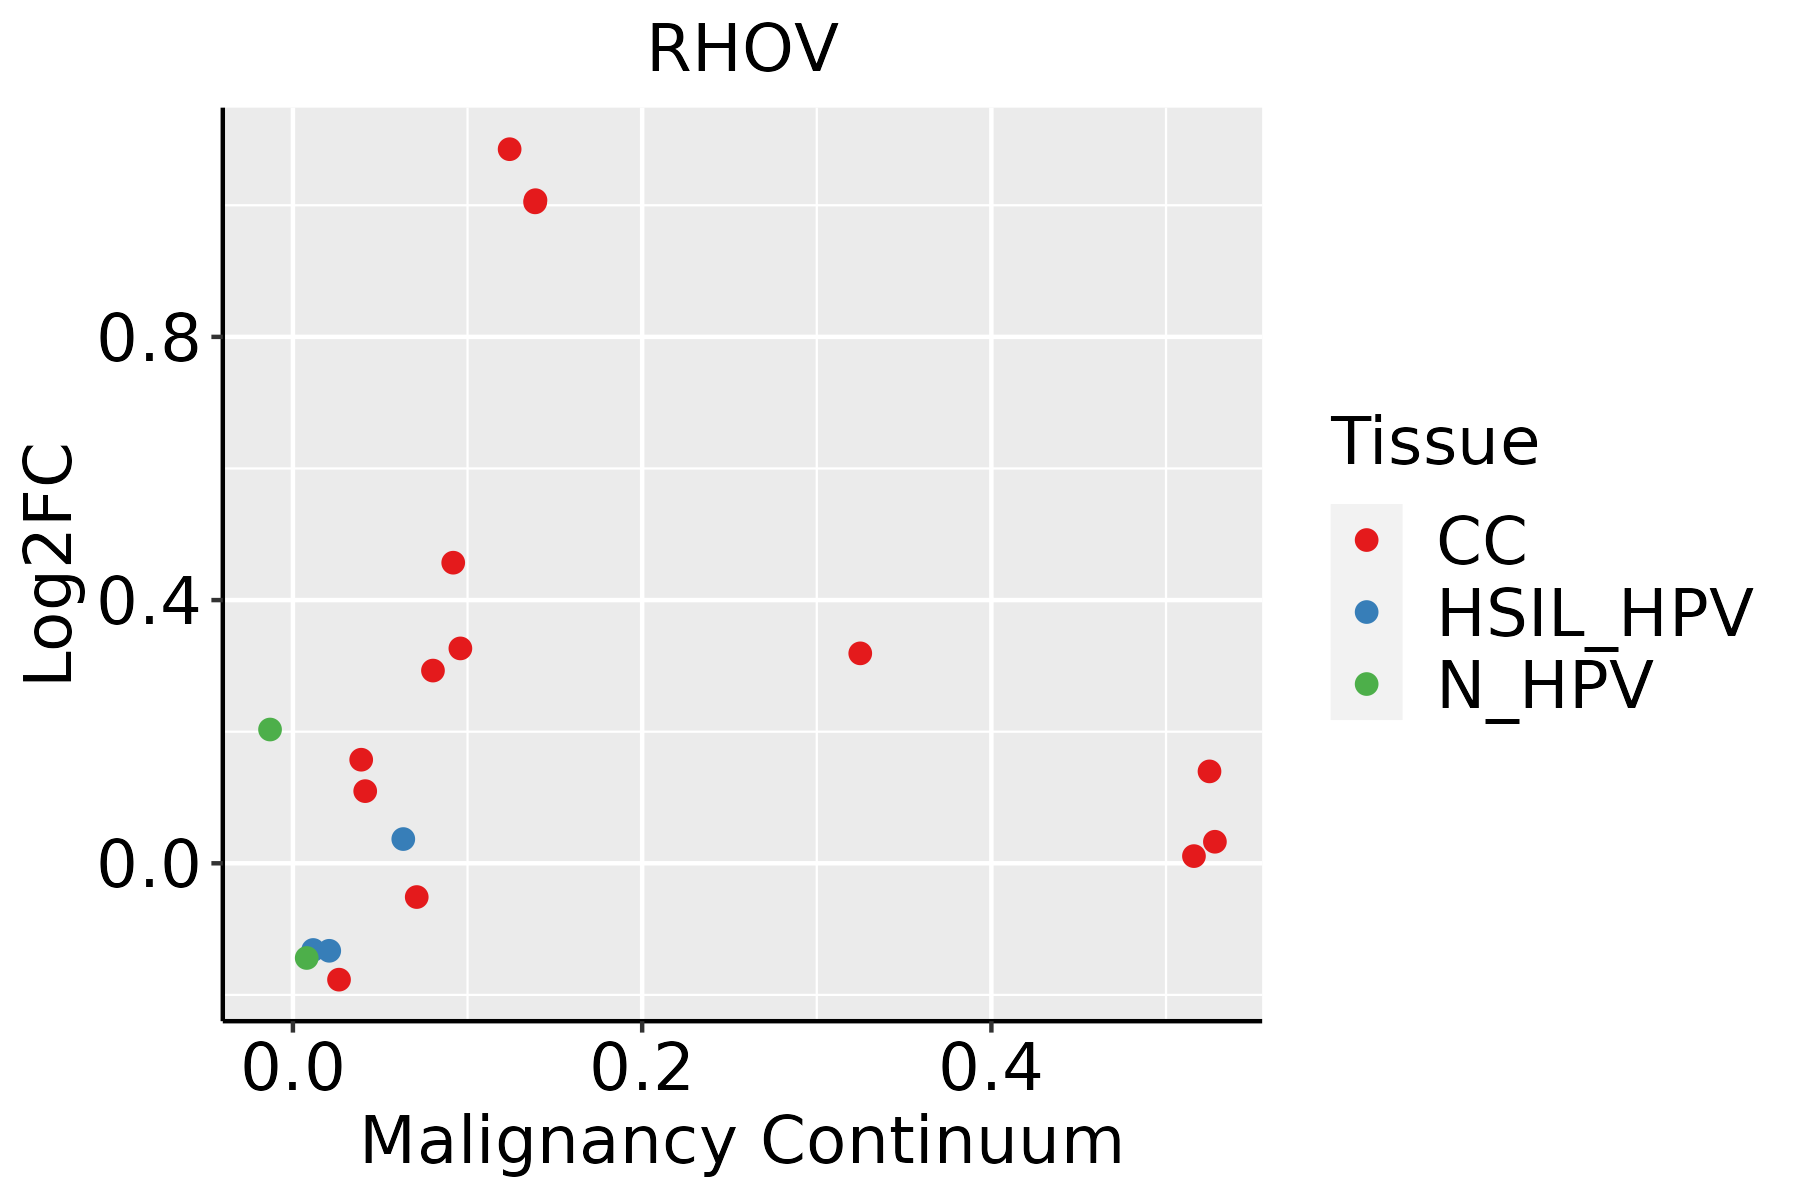 | CC: Cervix cancer |
| HSIL_HPV: HPV-infected high-grade squamous intraepithelial lesions |
| N_HPV: HPV-infected normal cervix |
| Esophagus |  | ESCC: Esophageal squamous cell carcinoma |
| HGIN: High-grade intraepithelial neoplasias |
| LGIN: Low-grade intraepithelial neoplasias |
| Liver | 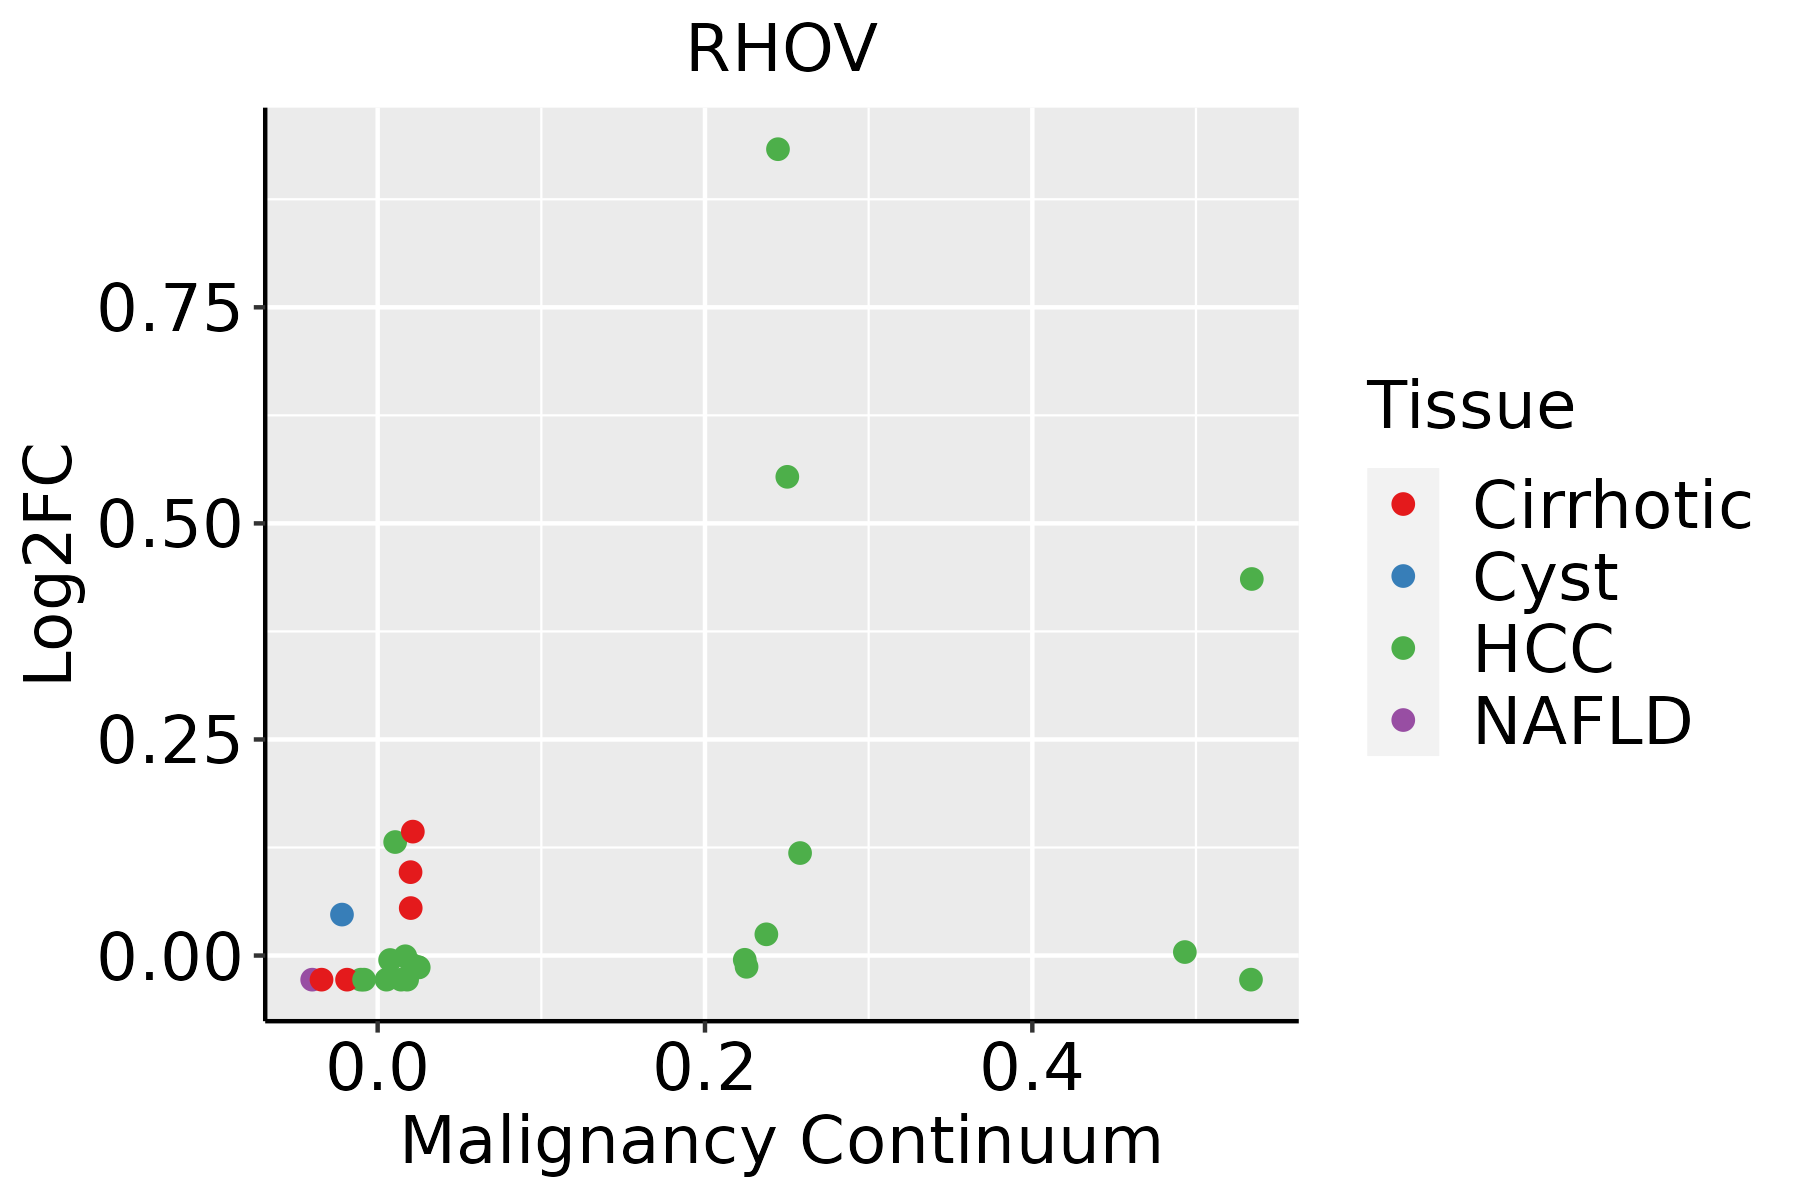 | HCC: Hepatocellular carcinoma |
| NAFLD: Non-alcoholic fatty liver disease |
| Lung | 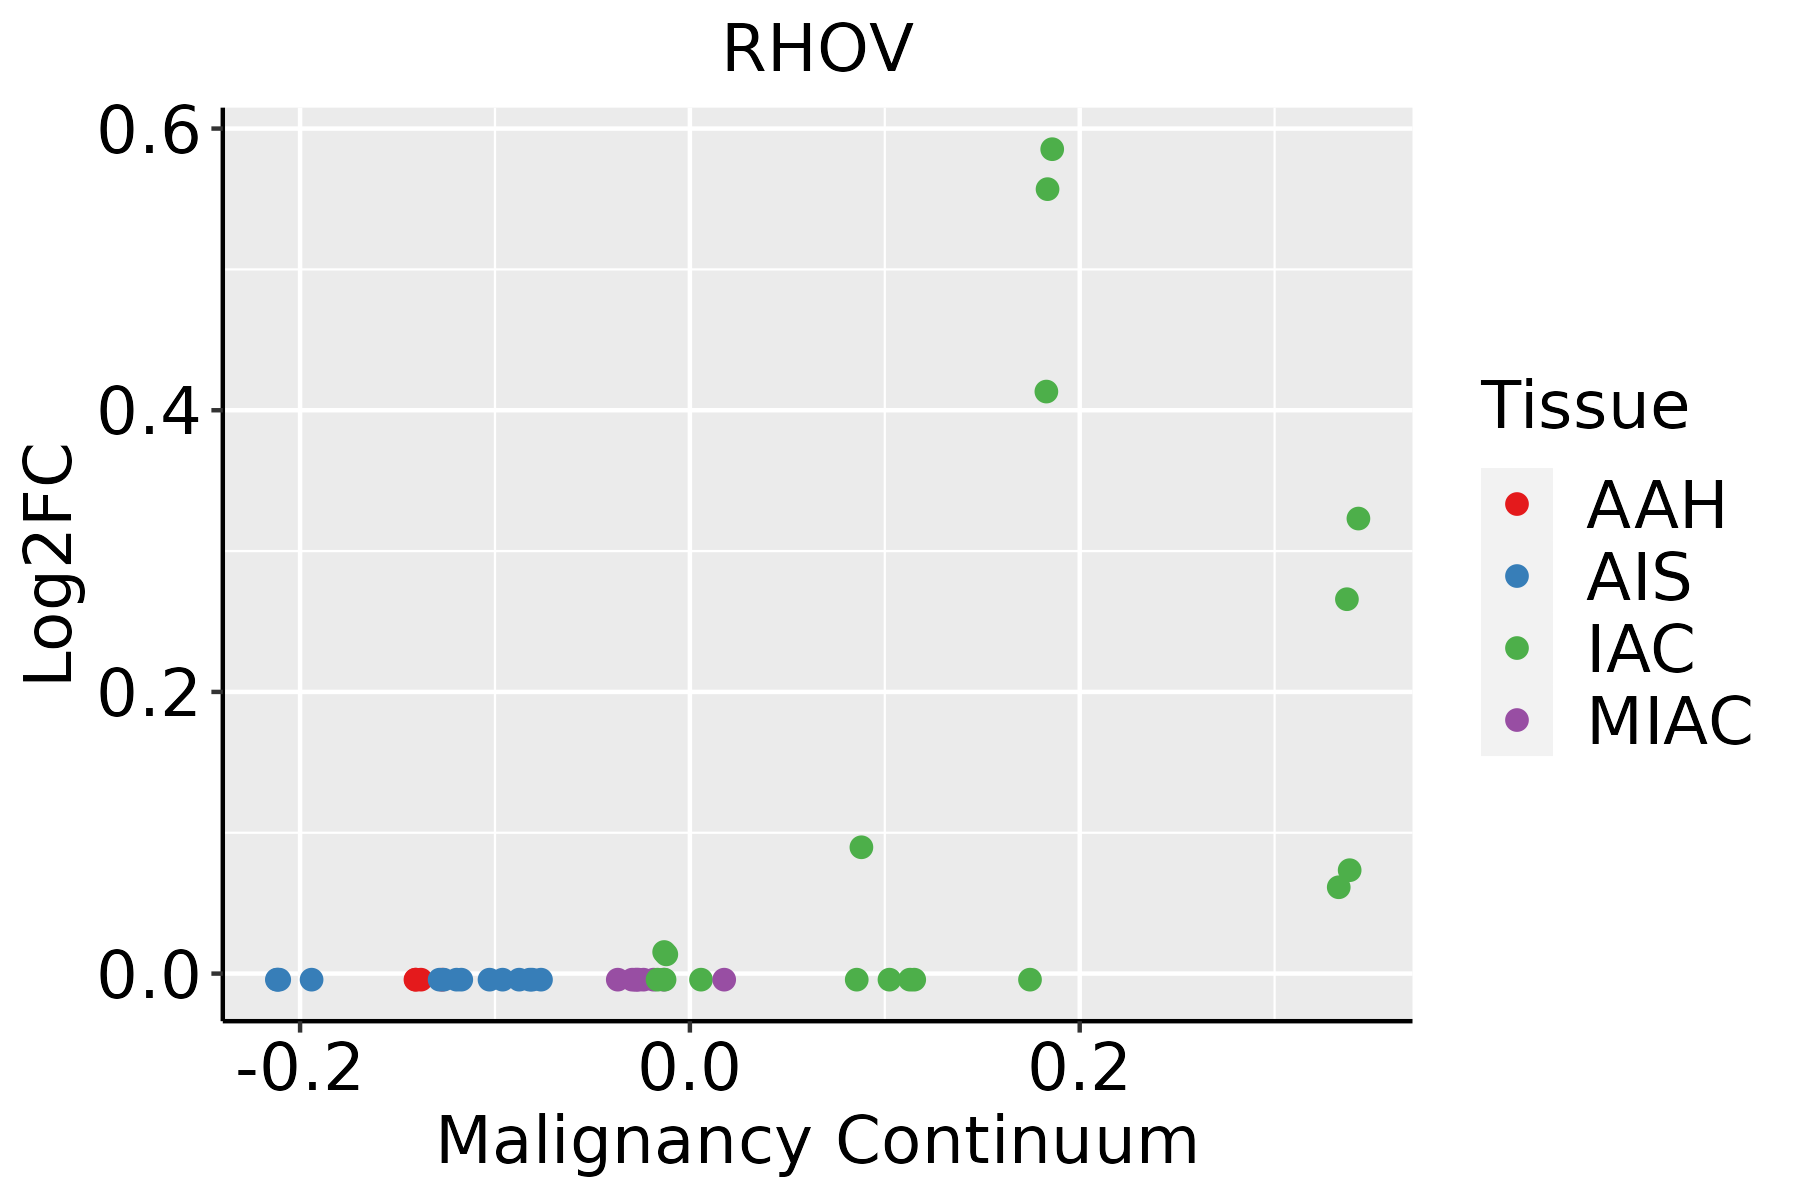 | AAH: Atypical adenomatous hyperplasia |
| AIS: Adenocarcinoma in situ |
| IAC: Invasive lung adenocarcinoma |
| MIA: Minimally invasive adenocarcinoma |
| Oral Cavity |  | EOLP: Erosive Oral lichen planus |
| LP: leukoplakia |
| NEOLP: Non-erosive oral lichen planus |
| OSCC: Oral squamous cell carcinoma |
| Skin |  | AK: Actinic keratosis |
| cSCC: Cutaneous squamous cell carcinoma |
| SCCIS:squamous cell carcinoma in situ |
| GO ID | Tissue | Disease Stage | Description | Gene Ratio | Bg Ratio | pvalue | p.adjust | Count |
| GO:00072656 | Cervix | CC | Ras protein signal transduction | 79/2311 | 337/18723 | 9.49e-09 | 7.77e-07 | 79 |
| GO:00072666 | Cervix | CC | Rho protein signal transduction | 35/2311 | 137/18723 | 1.77e-05 | 3.33e-04 | 35 |
| GO:000726510 | Esophagus | ESCC | Ras protein signal transduction | 201/8552 | 337/18723 | 1.44e-07 | 2.30e-06 | 201 |
| GO:000726610 | Esophagus | ESCC | Rho protein signal transduction | 81/8552 | 137/18723 | 1.03e-03 | 5.20e-03 | 81 |
| GO:000726521 | Liver | HCC | Ras protein signal transduction | 187/7958 | 337/18723 | 8.89e-07 | 1.35e-05 | 187 |
| GO:000726621 | Liver | HCC | Rho protein signal transduction | 76/7958 | 137/18723 | 1.46e-03 | 7.75e-03 | 76 |
| GO:00072655 | Lung | IAC | Ras protein signal transduction | 65/2061 | 337/18723 | 4.48e-06 | 1.81e-04 | 65 |
| GO:00072665 | Lung | IAC | Rho protein signal transduction | 32/2061 | 137/18723 | 2.75e-05 | 7.26e-04 | 32 |
| GO:00072659 | Oral cavity | OSCC | Ras protein signal transduction | 185/7305 | 337/18723 | 1.95e-09 | 4.60e-08 | 185 |
| GO:00072669 | Oral cavity | OSCC | Rho protein signal transduction | 76/7305 | 137/18723 | 6.64e-05 | 5.37e-04 | 76 |
| GO:000726515 | Oral cavity | LP | Ras protein signal transduction | 109/4623 | 337/18723 | 8.44e-04 | 7.36e-03 | 109 |
| GO:000726522 | Oral cavity | EOLP | Ras protein signal transduction | 74/2218 | 337/18723 | 8.76e-08 | 3.09e-06 | 74 |
| GO:000726615 | Oral cavity | EOLP | Rho protein signal transduction | 29/2218 | 137/18723 | 1.28e-03 | 9.16e-03 | 29 |
| GO:000726516 | Skin | AK | Ras protein signal transduction | 68/1910 | 337/18723 | 2.83e-08 | 1.57e-06 | 68 |
| GO:000726616 | Skin | AK | Rho protein signal transduction | 31/1910 | 137/18723 | 1.60e-05 | 3.09e-04 | 31 |
| GO:000726523 | Skin | cSCC | Ras protein signal transduction | 132/4864 | 337/18723 | 6.17e-08 | 1.57e-06 | 132 |
| GO:000726617 | Skin | cSCC | Rho protein signal transduction | 51/4864 | 137/18723 | 2.38e-03 | 1.38e-02 | 51 |
| Hugo Symbol | Variant Class | Variant Classification | dbSNP RS | HGVSc | HGVSp | HGVSp Short | SWISSPROT | BIOTYPE | SIFT | PolyPhen | Tumor Sample Barcode | Tissue | Histology | Sex | Age | Stage | Therapy Types | Drugs | Outcome |
| RHOV | SNV | Missense_Mutation | | c.244N>C | p.Glu82Gln | p.E82Q | Q96L33 | protein_coding | tolerated(1) | benign(0.006) | TCGA-C5-A1MF-01 | Cervix | cervical & endocervical cancer | Female | <65 | I/II | Unknown | Unknown | SD |
| RHOV | SNV | Missense_Mutation | novel | c.485N>T | p.Arg162Leu | p.R162L | Q96L33 | protein_coding | deleterious(0.03) | possibly_damaging(0.499) | TCGA-DS-A7WI-01 | Cervix | cervical & endocervical cancer | Female | <65 | I/II | Chemotherapy | cisplatin | PD |
| RHOV | SNV | Missense_Mutation | novel | c.277N>T | p.Asp93Tyr | p.D93Y | Q96L33 | protein_coding | deleterious(0) | probably_damaging(0.998) | TCGA-D5-6923-01 | Colorectum | colon adenocarcinoma | Male | <65 | I/II | Unknown | Unknown | SD |
| RHOV | SNV | Missense_Mutation | | c.448N>A | p.Asp150Asn | p.D150N | Q96L33 | protein_coding | tolerated(0.09) | possibly_damaging(0.576) | TCGA-A5-A0G2-01 | Endometrium | uterine corpus endometrioid carcinoma | Female | <65 | III/IV | Unknown | Unknown | SD |
| RHOV | SNV | Missense_Mutation | | c.536N>A | p.Arg179Gln | p.R179Q | Q96L33 | protein_coding | tolerated(0.1) | benign(0.273) | TCGA-AP-A056-01 | Endometrium | uterine corpus endometrioid carcinoma | Female | <65 | I/II | Unknown | Unknown | SD |
| RHOV | SNV | Missense_Mutation | rs775096024 | c.388C>T | p.Arg130Cys | p.R130C | Q96L33 | protein_coding | deleterious(0.01) | probably_damaging(0.989) | TCGA-AX-A2HC-01 | Endometrium | uterine corpus endometrioid carcinoma | Female | <65 | III/IV | Chemotherapy | paclitaxel | PD |
| RHOV | SNV | Missense_Mutation | novel | c.683N>A | p.Arg228His | p.R228H | Q96L33 | protein_coding | tolerated(0.12) | possibly_damaging(0.508) | TCGA-AX-A2HD-01 | Endometrium | uterine corpus endometrioid carcinoma | Female | >=65 | III/IV | Unknown | Unknown | SD |
| RHOV | SNV | Missense_Mutation | novel | c.556N>C | p.Cys186Arg | p.C186R | Q96L33 | protein_coding | deleterious(0) | probably_damaging(0.997) | TCGA-DD-AADN-01 | Liver | liver hepatocellular carcinoma | Male | <65 | I/II | Unknown | Unknown | SD |
| RHOV | SNV | Missense_Mutation | novel | c.491N>A | p.Gly164Asp | p.G164D | Q96L33 | protein_coding | tolerated(0.06) | benign(0.021) | TCGA-21-1079-01 | Lung | lung squamous cell carcinoma | Male | >=65 | III/IV | Unknown | Unknown | PD |
| RHOV | SNV | Missense_Mutation | novel | c.526N>A | p.Glu176Lys | p.E176K | Q96L33 | protein_coding | tolerated(0.74) | benign(0.026) | TCGA-CQ-5333-01 | Oral cavity | head & neck squamous cell carcinoma | Male | >=65 | I/II | Unknown | Unknown | PD |


