
|
|||||
|
 | |
| |
| |
| |
| |
| |
|
Gene: RHOT2 |
Gene summary for RHOT2 |
| Gene information | Species | Human | Gene symbol | RHOT2 | Gene ID | 89941 |
| Gene name | ras homolog family member T2 | |
| Gene Alias | ARHT2 | |
| Cytomap | 16p13.3 | |
| Gene Type | protein-coding | GO ID | GO:0006810 | UniProtAcc | Q8IXI1 |
Top |
Malignant transformation analysis |
| Identification of the aberrant gene expression in precancerous and cancerous lesions by comparing the gene expression of stem-like cells in diseased tissues with normal stem cells |
| Entrez ID | Symbol | Replicates | Species | Organ | Tissue | Adj P-value | Log2FC | Malignancy |
| 89941 | RHOT2 | LZE4T | Human | Esophagus | ESCC | 1.31e-06 | 1.46e-01 | 0.0811 |
| 89941 | RHOT2 | LZE7T | Human | Esophagus | ESCC | 5.16e-15 | 7.38e-01 | 0.0667 |
| 89941 | RHOT2 | LZE8T | Human | Esophagus | ESCC | 4.64e-13 | 2.51e-01 | 0.067 |
| 89941 | RHOT2 | LZE20T | Human | Esophagus | ESCC | 1.91e-09 | 3.86e-01 | 0.0662 |
| 89941 | RHOT2 | LZE21D1 | Human | Esophagus | HGIN | 2.59e-12 | 6.07e-01 | 0.0632 |
| 89941 | RHOT2 | LZE22D1 | Human | Esophagus | HGIN | 9.09e-04 | 2.13e-01 | 0.0595 |
| 89941 | RHOT2 | LZE22T | Human | Esophagus | ESCC | 7.05e-05 | 2.93e-01 | 0.068 |
| 89941 | RHOT2 | LZE24T | Human | Esophagus | ESCC | 5.31e-18 | 5.12e-01 | 0.0596 |
| 89941 | RHOT2 | LZE21T | Human | Esophagus | ESCC | 1.37e-04 | 5.25e-01 | 0.0655 |
| 89941 | RHOT2 | LZE6T | Human | Esophagus | ESCC | 2.30e-03 | 1.70e-01 | 0.0845 |
| 89941 | RHOT2 | P1T-E | Human | Esophagus | ESCC | 1.85e-16 | 9.04e-01 | 0.0875 |
| 89941 | RHOT2 | P2T-E | Human | Esophagus | ESCC | 3.51e-56 | 1.06e+00 | 0.1177 |
| 89941 | RHOT2 | P4T-E | Human | Esophagus | ESCC | 4.57e-23 | 5.48e-01 | 0.1323 |
| 89941 | RHOT2 | P5T-E | Human | Esophagus | ESCC | 1.77e-20 | 3.26e-01 | 0.1327 |
| 89941 | RHOT2 | P8T-E | Human | Esophagus | ESCC | 3.71e-29 | 5.29e-01 | 0.0889 |
| 89941 | RHOT2 | P9T-E | Human | Esophagus | ESCC | 1.73e-13 | 2.18e-01 | 0.1131 |
| 89941 | RHOT2 | P10T-E | Human | Esophagus | ESCC | 7.41e-21 | 3.63e-01 | 0.116 |
| 89941 | RHOT2 | P11T-E | Human | Esophagus | ESCC | 1.25e-14 | 6.91e-01 | 0.1426 |
| 89941 | RHOT2 | P12T-E | Human | Esophagus | ESCC | 1.55e-45 | 8.57e-01 | 0.1122 |
| 89941 | RHOT2 | P15T-E | Human | Esophagus | ESCC | 9.00e-35 | 7.45e-01 | 0.1149 |
| Page: 1 2 3 4 5 6 7 |
| Tissue | Expression Dynamics | Abbreviation |
| Esophagus | 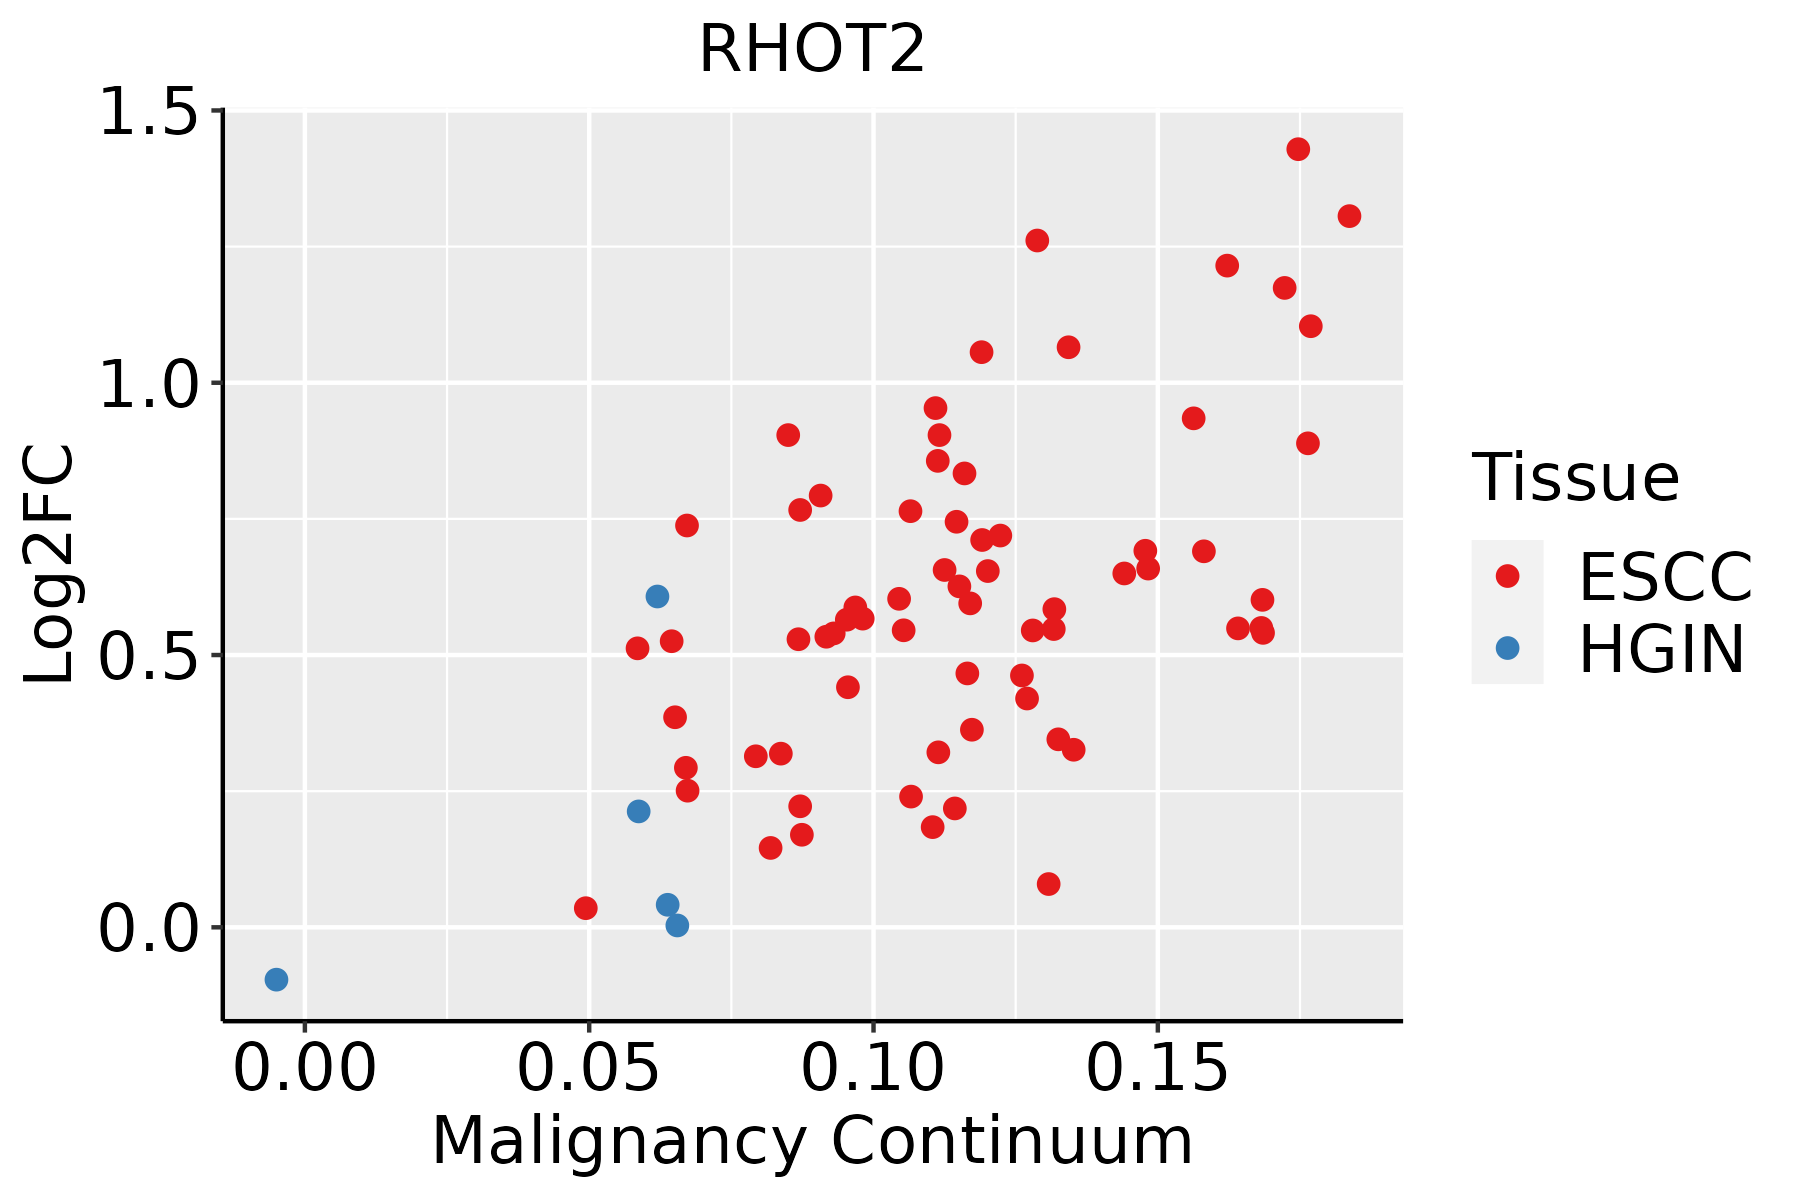 | ESCC: Esophageal squamous cell carcinoma |
| HGIN: High-grade intraepithelial neoplasias | ||
| LGIN: Low-grade intraepithelial neoplasias | ||
| Liver | 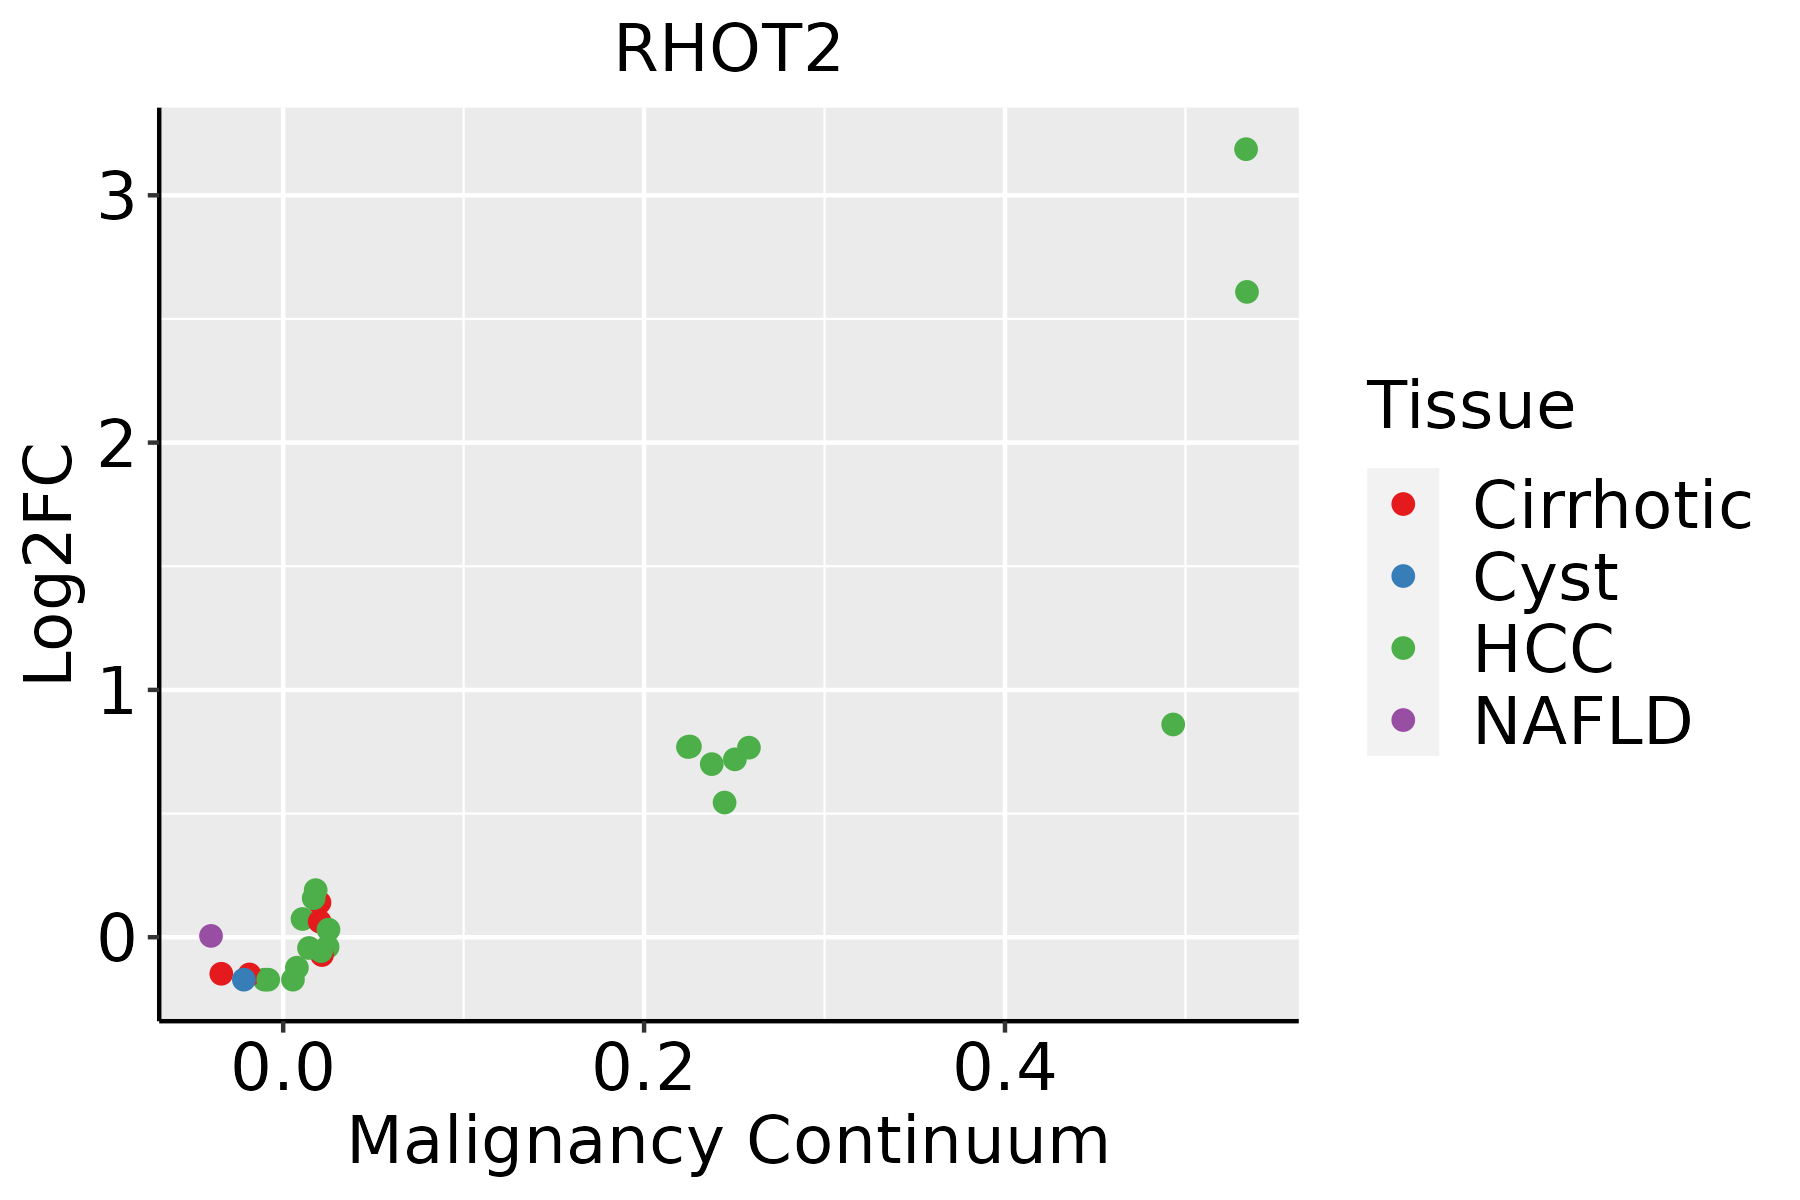 | HCC: Hepatocellular carcinoma |
| NAFLD: Non-alcoholic fatty liver disease | ||
| Oral Cavity | 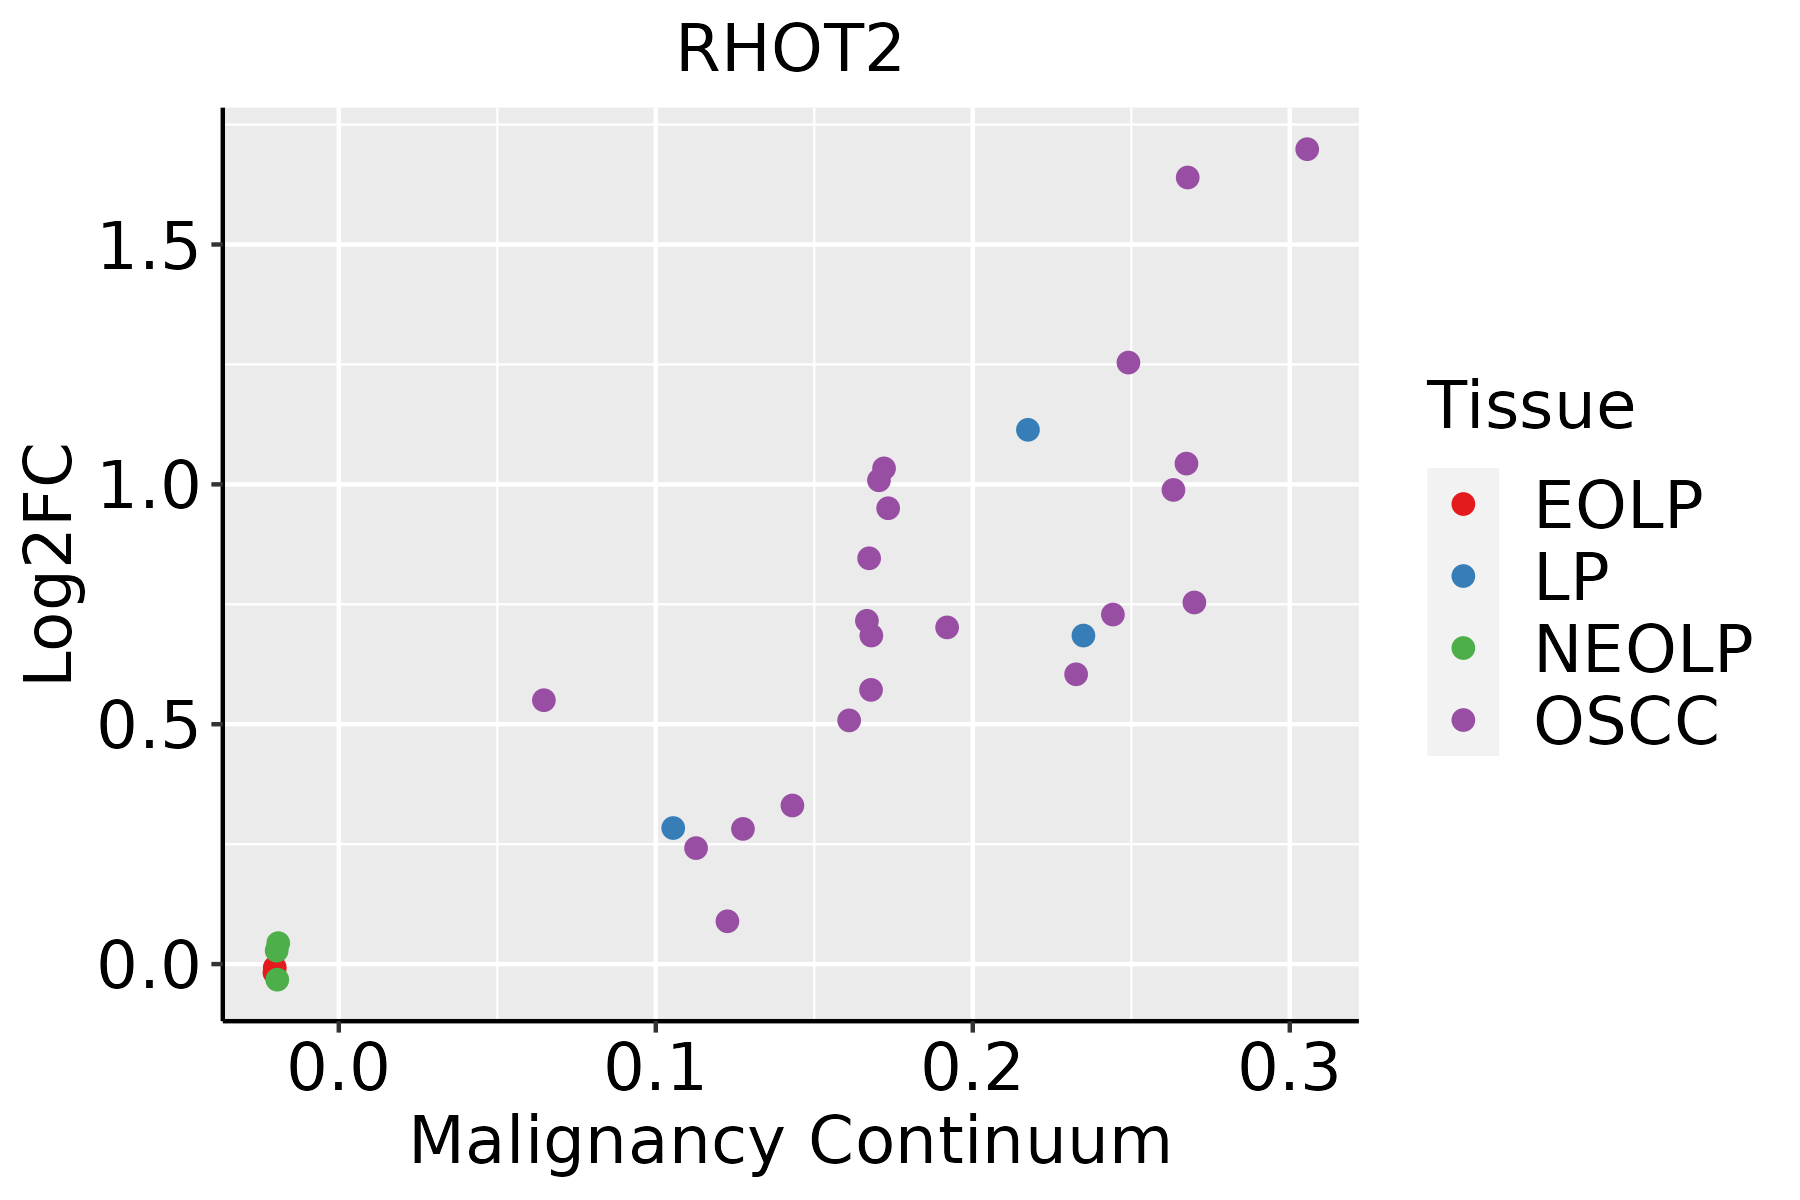 | EOLP: Erosive Oral lichen planus |
| LP: leukoplakia | ||
| NEOLP: Non-erosive oral lichen planus | ||
| OSCC: Oral squamous cell carcinoma | ||
| Skin | 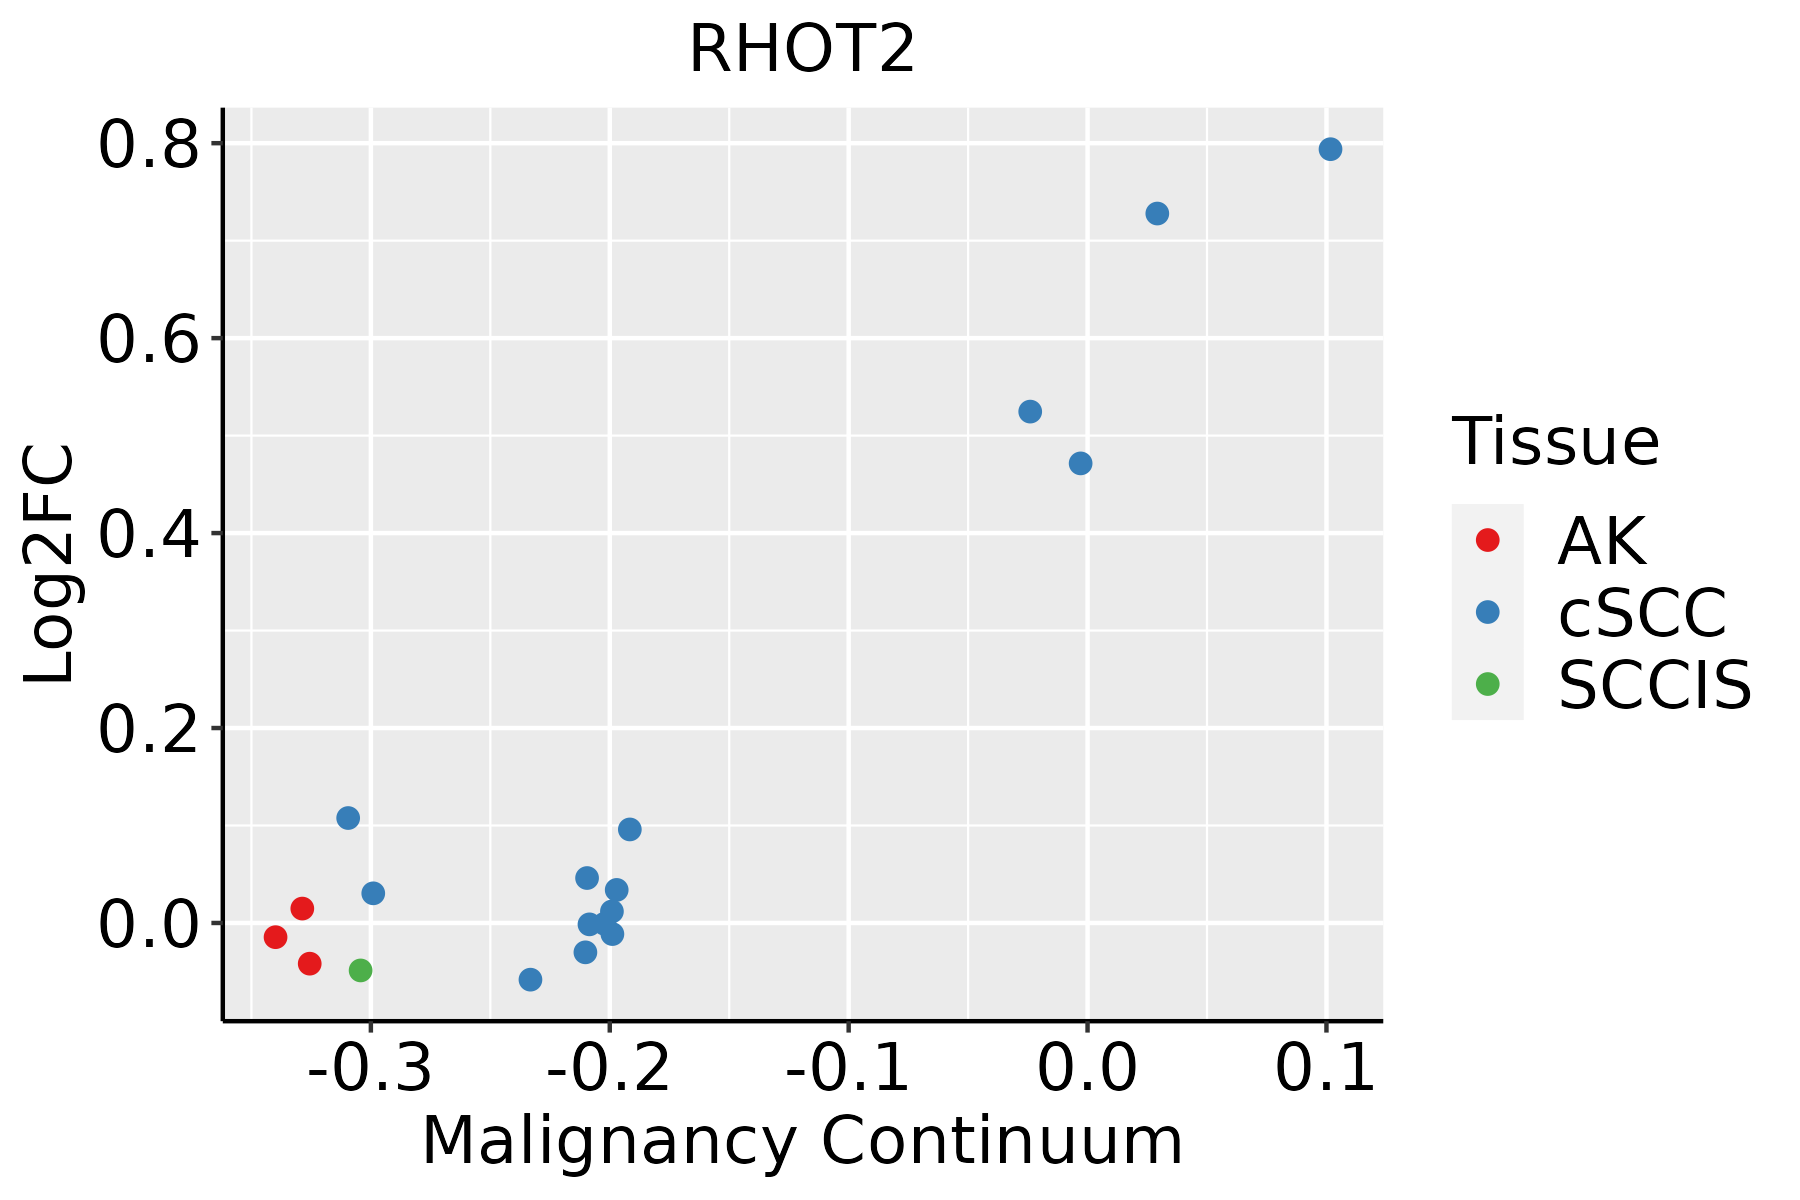 | AK: Actinic keratosis |
| cSCC: Cutaneous squamous cell carcinoma | ||
| SCCIS:squamous cell carcinoma in situ | ||
| Thyroid | 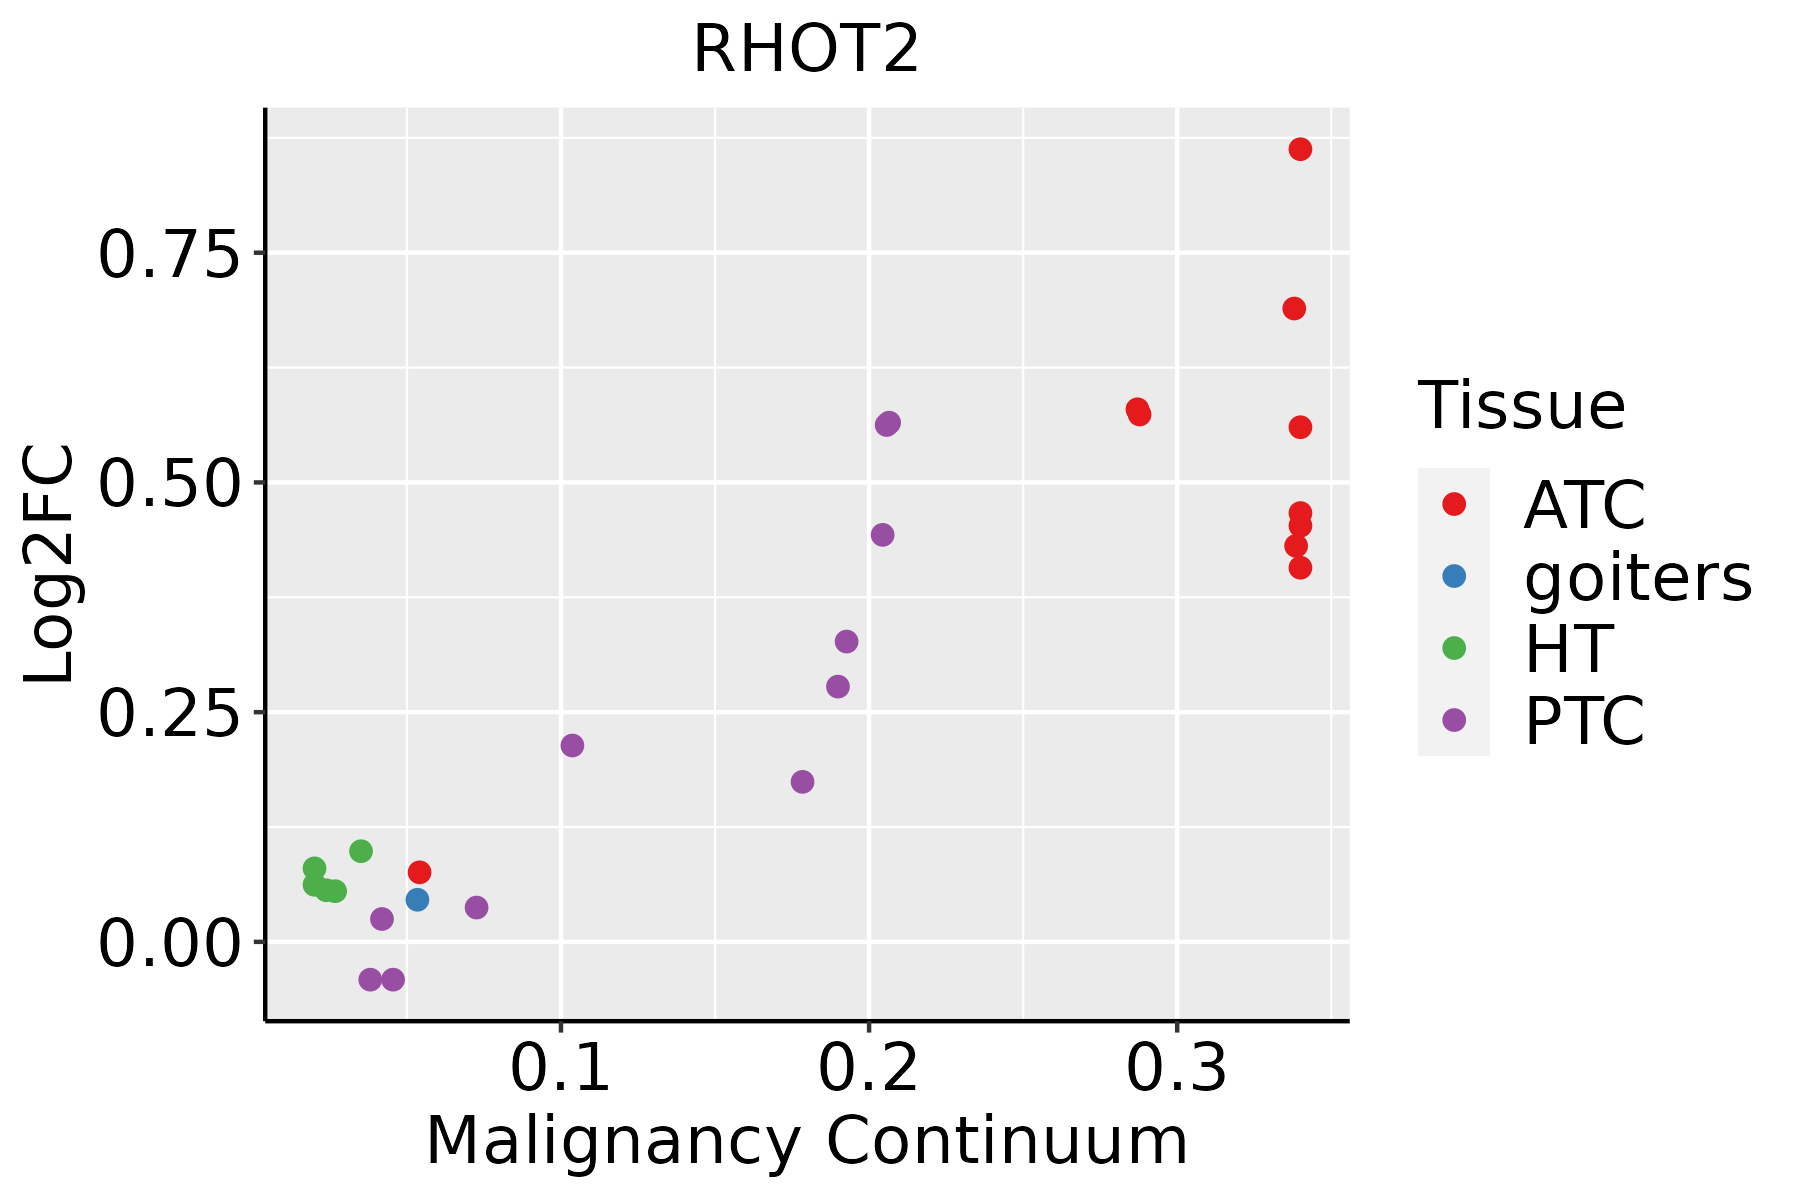 | ATC: Anaplastic thyroid cancer |
| HT: Hashimoto's thyroiditis | ||
| PTC: Papillary thyroid cancer |
| ∗log2FC in expression of this searched gene in stem-like cells from each diseased tissue sample relative to stem-like cells in normal samples in each tissue plotted against the malignancy continuum. Samples are colored based on if they are from different disease stage. |
Top |
Malignant transformation related pathway analysis |
| Find out the enriched GO biological processes and KEGG pathways involved in transition from healthy to precancer to cancer |
| Tissue | Disease Stage | Enriched GO biological Processes |
| Colorectum | AD |  |
| Colorectum | SER |  |
| Colorectum | MSS |  |
| Colorectum | MSI-H |  |
| Colorectum | FAP |  |
| ∗Top 15 enriched GO BP terms are showed in the bar plot of each disease state in each tissue. Each row represents a significant GO biological process which is colored according to the -log10(p.adjust). |
| Page: 1 2 3 4 5 6 7 8 9 |
| GO ID | Tissue | Disease Stage | Description | Gene Ratio | Bg Ratio | pvalue | p.adjust | Count |
| GO:000683920 | Esophagus | HGIN | mitochondrial transport | 74/2587 | 254/18723 | 1.32e-10 | 1.32e-08 | 74 |
| GO:005165616 | Esophagus | HGIN | establishment of organelle localization | 90/2587 | 390/18723 | 4.27e-07 | 1.94e-05 | 90 |
| GO:000700618 | Esophagus | HGIN | mitochondrial membrane organization | 37/2587 | 116/18723 | 4.61e-07 | 2.07e-05 | 37 |
| GO:001082119 | Esophagus | HGIN | regulation of mitochondrion organization | 42/2587 | 144/18723 | 1.20e-06 | 4.68e-05 | 42 |
| GO:000863720 | Esophagus | HGIN | apoptotic mitochondrial changes | 33/2587 | 107/18723 | 4.32e-06 | 1.42e-04 | 33 |
| GO:003070517 | Esophagus | HGIN | cytoskeleton-dependent intracellular transport | 45/2587 | 195/18723 | 3.07e-04 | 5.15e-03 | 45 |
| GO:00109707 | Esophagus | HGIN | transport along microtubule | 35/2587 | 155/18723 | 2.01e-03 | 2.12e-02 | 35 |
| GO:00516542 | Esophagus | HGIN | establishment of mitochondrion localization | 10/2587 | 29/18723 | 4.07e-03 | 3.65e-02 | 10 |
| GO:00469029 | Esophagus | HGIN | regulation of mitochondrial membrane permeability | 17/2587 | 63/18723 | 4.29e-03 | 3.82e-02 | 17 |
| GO:00346432 | Esophagus | HGIN | establishment of mitochondrion localization, microtubule-mediated | 9/2587 | 26/18723 | 6.15e-03 | 4.92e-02 | 9 |
| GO:00474972 | Esophagus | HGIN | mitochondrion transport along microtubule | 9/2587 | 26/18723 | 6.15e-03 | 4.92e-02 | 9 |
| GO:19026869 | Esophagus | HGIN | mitochondrial outer membrane permeabilization involved in programmed cell death | 12/2587 | 40/18723 | 6.22e-03 | 4.95e-02 | 12 |
| GO:005165617 | Esophagus | ESCC | establishment of organelle localization | 273/8552 | 390/18723 | 9.13e-23 | 1.81e-20 | 273 |
| GO:0006839110 | Esophagus | ESCC | mitochondrial transport | 187/8552 | 254/18723 | 8.35e-20 | 9.81e-18 | 187 |
| GO:000700619 | Esophagus | ESCC | mitochondrial membrane organization | 93/8552 | 116/18723 | 2.16e-14 | 1.11e-12 | 93 |
| GO:0010821110 | Esophagus | ESCC | regulation of mitochondrion organization | 107/8552 | 144/18723 | 2.31e-12 | 9.41e-11 | 107 |
| GO:0008637110 | Esophagus | ESCC | apoptotic mitochondrial changes | 83/8552 | 107/18723 | 1.43e-11 | 5.08e-10 | 83 |
| GO:003070518 | Esophagus | ESCC | cytoskeleton-dependent intracellular transport | 133/8552 | 195/18723 | 1.48e-10 | 4.27e-09 | 133 |
| GO:001097013 | Esophagus | ESCC | transport along microtubule | 107/8552 | 155/18723 | 3.17e-09 | 6.80e-08 | 107 |
| GO:00723846 | Esophagus | ESCC | organelle transport along microtubule | 65/8552 | 85/18723 | 6.61e-09 | 1.35e-07 | 65 |
| Page: 1 2 3 4 5 6 7 8 |
| Pathway ID | Tissue | Disease Stage | Description | Gene Ratio | Bg Ratio | pvalue | p.adjust | qvalue | Count |
| hsa0413730 | Esophagus | HGIN | Mitophagy - animal | 23/1383 | 72/8465 | 7.69e-04 | 7.59e-03 | 6.03e-03 | 23 |
| hsa04137113 | Esophagus | HGIN | Mitophagy - animal | 23/1383 | 72/8465 | 7.69e-04 | 7.59e-03 | 6.03e-03 | 23 |
| hsa04137210 | Esophagus | ESCC | Mitophagy - animal | 54/4205 | 72/8465 | 9.33e-06 | 4.96e-05 | 2.54e-05 | 54 |
| hsa0413738 | Esophagus | ESCC | Mitophagy - animal | 54/4205 | 72/8465 | 9.33e-06 | 4.96e-05 | 2.54e-05 | 54 |
| hsa0413721 | Liver | Cirrhotic | Mitophagy - animal | 39/2530 | 72/8465 | 1.38e-05 | 1.24e-04 | 7.64e-05 | 39 |
| hsa0413731 | Liver | Cirrhotic | Mitophagy - animal | 39/2530 | 72/8465 | 1.38e-05 | 1.24e-04 | 7.64e-05 | 39 |
| hsa0413741 | Liver | HCC | Mitophagy - animal | 53/4020 | 72/8465 | 5.49e-06 | 4.59e-05 | 2.56e-05 | 53 |
| hsa0413751 | Liver | HCC | Mitophagy - animal | 53/4020 | 72/8465 | 5.49e-06 | 4.59e-05 | 2.56e-05 | 53 |
| hsa0413728 | Oral cavity | OSCC | Mitophagy - animal | 58/3704 | 72/8465 | 1.48e-10 | 2.07e-09 | 1.05e-09 | 58 |
| hsa04137112 | Oral cavity | OSCC | Mitophagy - animal | 58/3704 | 72/8465 | 1.48e-10 | 2.07e-09 | 1.05e-09 | 58 |
| hsa0413729 | Oral cavity | LP | Mitophagy - animal | 38/2418 | 72/8465 | 1.24e-05 | 8.63e-05 | 5.57e-05 | 38 |
| hsa0413737 | Oral cavity | LP | Mitophagy - animal | 38/2418 | 72/8465 | 1.24e-05 | 8.63e-05 | 5.57e-05 | 38 |
| Page: 1 |
Top |
Cell-cell communication analysis |
| Identification of potential cell-cell interactions between two cell types and their ligand-receptor pairs for different disease states |
| Ligand | Receptor | LRpair | Pathway | Tissue | Disease Stage |
| Page: 1 |
Top |
Single-cell gene regulatory network inference analysis |
| Find out the significant the regulons (TFs) and the target genes of each regulon across cell types for different disease states |
| TF | Cell Type | Tissue | Disease Stage | Target Gene | RSS | Regulon Activity |
| ∗The dot plots of a searched regulon are shown for all cell subpopulations in each disease state of each tissue based on the regulon specific score inferred using pySCENIC and by calculating the average expression. |
| Page: 1 |
Top |
Somatic mutation of malignant transformation related genes |
| Annotation of somatic variants for genes involved in malignant transformation |
| Hugo Symbol | Variant Class | Variant Classification | dbSNP RS | HGVSc | HGVSp | HGVSp Short | SWISSPROT | BIOTYPE | SIFT | PolyPhen | Tumor Sample Barcode | Tissue | Histology | Sex | Age | Stage | Therapy Types | Drugs | Outcome |
| RHOT2 | SNV | Missense_Mutation | rs767192667 | c.1309N>T | p.Leu437Phe | p.L437F | Q8IXI1 | protein_coding | deleterious(0) | probably_damaging(0.984) | TCGA-AR-A2LL-01 | Breast | breast invasive carcinoma | Female | >=65 | I/II | Hormone Therapy | tamoxiphen | SD |
| RHOT2 | deletion | Frame_Shift_Del | novel | c.1725delC | p.Phe576SerfsTer40 | p.F576Sfs*40 | Q8IXI1 | protein_coding | TCGA-EW-A2FV-01 | Breast | breast invasive carcinoma | Female | <65 | III/IV | Chemotherapy | docetaxel | SD | ||
| RHOT2 | SNV | Missense_Mutation | c.1209N>C | p.Lys403Asn | p.K403N | Q8IXI1 | protein_coding | deleterious(0) | probably_damaging(0.978) | TCGA-C5-A1MH-01 | Cervix | cervical & endocervical cancer | Female | >=65 | III/IV | Chemotherapy | cisplatin | PD | |
| RHOT2 | SNV | Missense_Mutation | c.949N>A | p.Asp317Asn | p.D317N | Q8IXI1 | protein_coding | deleterious(0) | possibly_damaging(0.84) | TCGA-C5-A1MN-01 | Cervix | cervical & endocervical cancer | Female | <65 | III/IV | Chemotherapy | cisplatin | SD | |
| RHOT2 | SNV | Missense_Mutation | c.260N>C | p.Glu87Ala | p.E87A | Q8IXI1 | protein_coding | deleterious(0.04) | possibly_damaging(0.489) | TCGA-A6-6653-01 | Colorectum | colon adenocarcinoma | Male | >=65 | I/II | Unknown | Unknown | SD | |
| RHOT2 | SNV | Missense_Mutation | novel | c.1537A>C | p.Met513Leu | p.M513L | Q8IXI1 | protein_coding | tolerated(0.34) | benign(0.009) | TCGA-AA-3548-01 | Colorectum | colon adenocarcinoma | Female | >=65 | III/IV | Chemotherapy | folinic | CR |
| RHOT2 | SNV | Missense_Mutation | rs778572194 | c.400A>G | p.Ile134Val | p.I134V | Q8IXI1 | protein_coding | tolerated(0.08) | probably_damaging(0.998) | TCGA-AA-3947-01 | Colorectum | colon adenocarcinoma | Female | <65 | I/II | Unknown | Unknown | SD |
| RHOT2 | SNV | Missense_Mutation | rs760337896 | c.967N>A | p.Ala323Thr | p.A323T | Q8IXI1 | protein_coding | deleterious(0.02) | possibly_damaging(0.509) | TCGA-D5-6540-01 | Colorectum | colon adenocarcinoma | Male | >=65 | I/II | Unknown | Unknown | SD |
| RHOT2 | SNV | Missense_Mutation | rs753439043 | c.668C>T | p.Pro223Leu | p.P223L | Q8IXI1 | protein_coding | tolerated(0.08) | probably_damaging(0.988) | TCGA-G4-6588-01 | Colorectum | colon adenocarcinoma | Female | <65 | I/II | Unknown | Unknown | SD |
| RHOT2 | SNV | Missense_Mutation | rs143577577 | c.733C>T | p.Arg245Trp | p.R245W | Q8IXI1 | protein_coding | deleterious(0) | possibly_damaging(0.901) | TCGA-F5-6864-01 | Colorectum | rectum adenocarcinoma | Female | >=65 | III/IV | Chemotherapy | 5-fluorouracil | CR |
| Page: 1 2 3 4 |
Top |
Related drugs of malignant transformation related genes |
| Identification of chemicals and drugs interact with genes involved in malignant transfromation |
| (DGIdb 4.0) |
| Entrez ID | Symbol | Category | Interaction Types | Drug Claim Name | Drug Name | PMIDs |
| Page: 1 |

Copyright 2023-Present -The University of Texas Health Science Center at Houston |