
|
|||||
|
 | |
| |
| |
| |
| |
| |
|
Gene: RHOT1 |
Gene summary for RHOT1 |
| Gene information | Species | Human | Gene symbol | RHOT1 | Gene ID | 55288 |
| Gene name | ras homolog family member T1 | |
| Gene Alias | ARHT1 | |
| Cytomap | 17q11.2 | |
| Gene Type | protein-coding | GO ID | GO:0001505 | UniProtAcc | Q8IXI2 |
Top |
Malignant transformation analysis |
| Identification of the aberrant gene expression in precancerous and cancerous lesions by comparing the gene expression of stem-like cells in diseased tissues with normal stem cells |
| Entrez ID | Symbol | Replicates | Species | Organ | Tissue | Adj P-value | Log2FC | Malignancy |
| 55288 | RHOT1 | GSM4909293 | Human | Breast | IDC | 2.49e-34 | 6.20e-01 | 0.1581 |
| 55288 | RHOT1 | GSM4909319 | Human | Breast | IDC | 3.36e-06 | -4.42e-02 | 0.1563 |
| 55288 | RHOT1 | M2 | Human | Breast | IDC | 2.23e-02 | 5.26e-01 | 0.21 |
| 55288 | RHOT1 | DCIS2 | Human | Breast | DCIS | 4.31e-25 | 5.23e-02 | 0.0085 |
| 55288 | RHOT1 | LZE4T | Human | Esophagus | ESCC | 4.22e-09 | 2.02e-01 | 0.0811 |
| 55288 | RHOT1 | LZE5T | Human | Esophagus | ESCC | 1.15e-02 | 5.03e-01 | 0.0514 |
| 55288 | RHOT1 | LZE7T | Human | Esophagus | ESCC | 1.93e-04 | 1.90e-01 | 0.0667 |
| 55288 | RHOT1 | LZE24T | Human | Esophagus | ESCC | 2.41e-18 | 5.07e-01 | 0.0596 |
| 55288 | RHOT1 | LZE6T | Human | Esophagus | ESCC | 1.07e-05 | 1.61e-01 | 0.0845 |
| 55288 | RHOT1 | P1T-E | Human | Esophagus | ESCC | 9.38e-07 | 2.71e-01 | 0.0875 |
| 55288 | RHOT1 | P2T-E | Human | Esophagus | ESCC | 3.60e-31 | 5.92e-01 | 0.1177 |
| 55288 | RHOT1 | P4T-E | Human | Esophagus | ESCC | 2.99e-21 | 5.06e-01 | 0.1323 |
| 55288 | RHOT1 | P5T-E | Human | Esophagus | ESCC | 7.49e-11 | 2.08e-01 | 0.1327 |
| 55288 | RHOT1 | P8T-E | Human | Esophagus | ESCC | 7.86e-24 | 3.89e-01 | 0.0889 |
| 55288 | RHOT1 | P9T-E | Human | Esophagus | ESCC | 8.38e-12 | 1.43e-01 | 0.1131 |
| 55288 | RHOT1 | P10T-E | Human | Esophagus | ESCC | 2.15e-19 | 2.21e-01 | 0.116 |
| 55288 | RHOT1 | P11T-E | Human | Esophagus | ESCC | 1.41e-19 | 5.93e-01 | 0.1426 |
| 55288 | RHOT1 | P12T-E | Human | Esophagus | ESCC | 2.51e-26 | 5.27e-01 | 0.1122 |
| 55288 | RHOT1 | P15T-E | Human | Esophagus | ESCC | 8.39e-32 | 5.62e-01 | 0.1149 |
| 55288 | RHOT1 | P16T-E | Human | Esophagus | ESCC | 1.14e-25 | 4.85e-01 | 0.1153 |
| Page: 1 2 3 4 5 |
| Tissue | Expression Dynamics | Abbreviation |
| Breast | 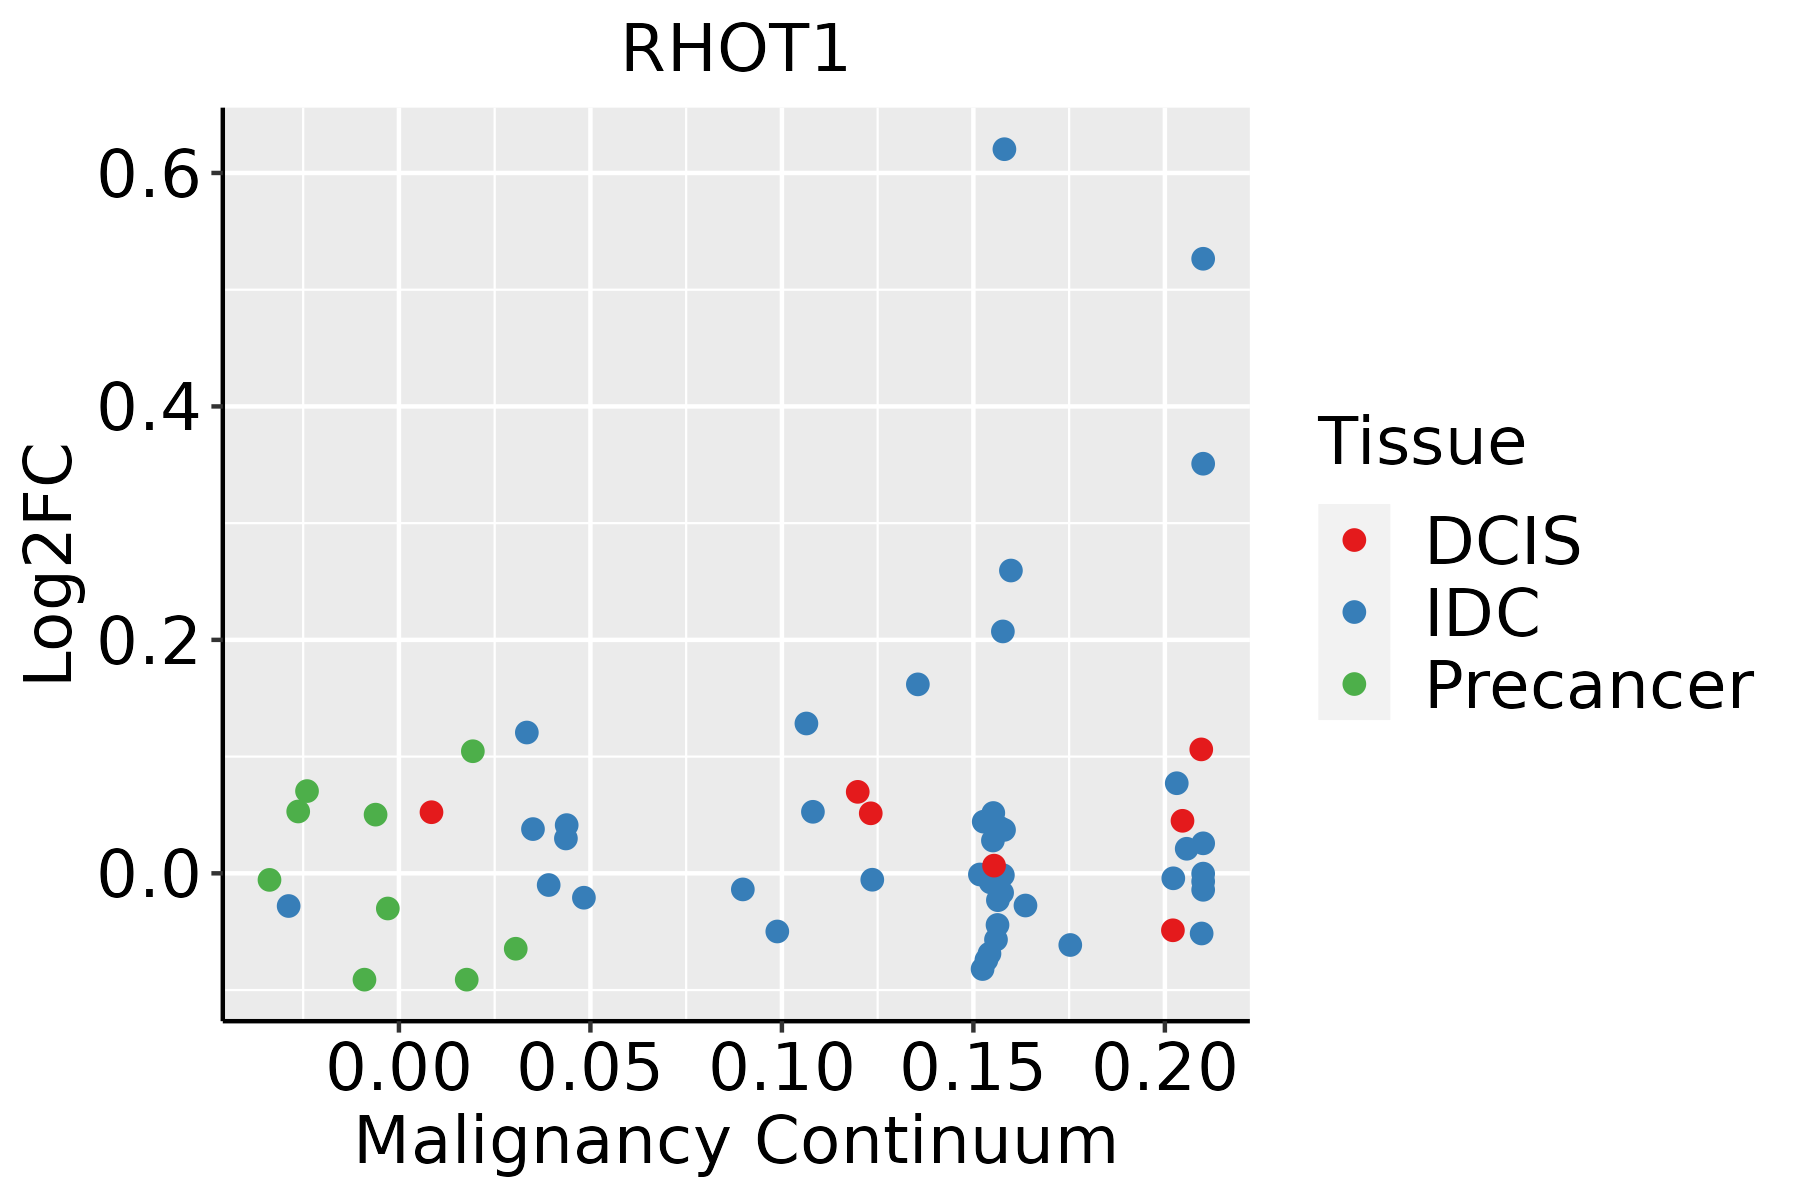 | IDC: Invasive ductal carcinoma |
| DCIS: Ductal carcinoma in situ | ||
| Precancer(BRCA1-mut): Precancerous lesion from BRCA1 mutation carriers | ||
| Esophagus | 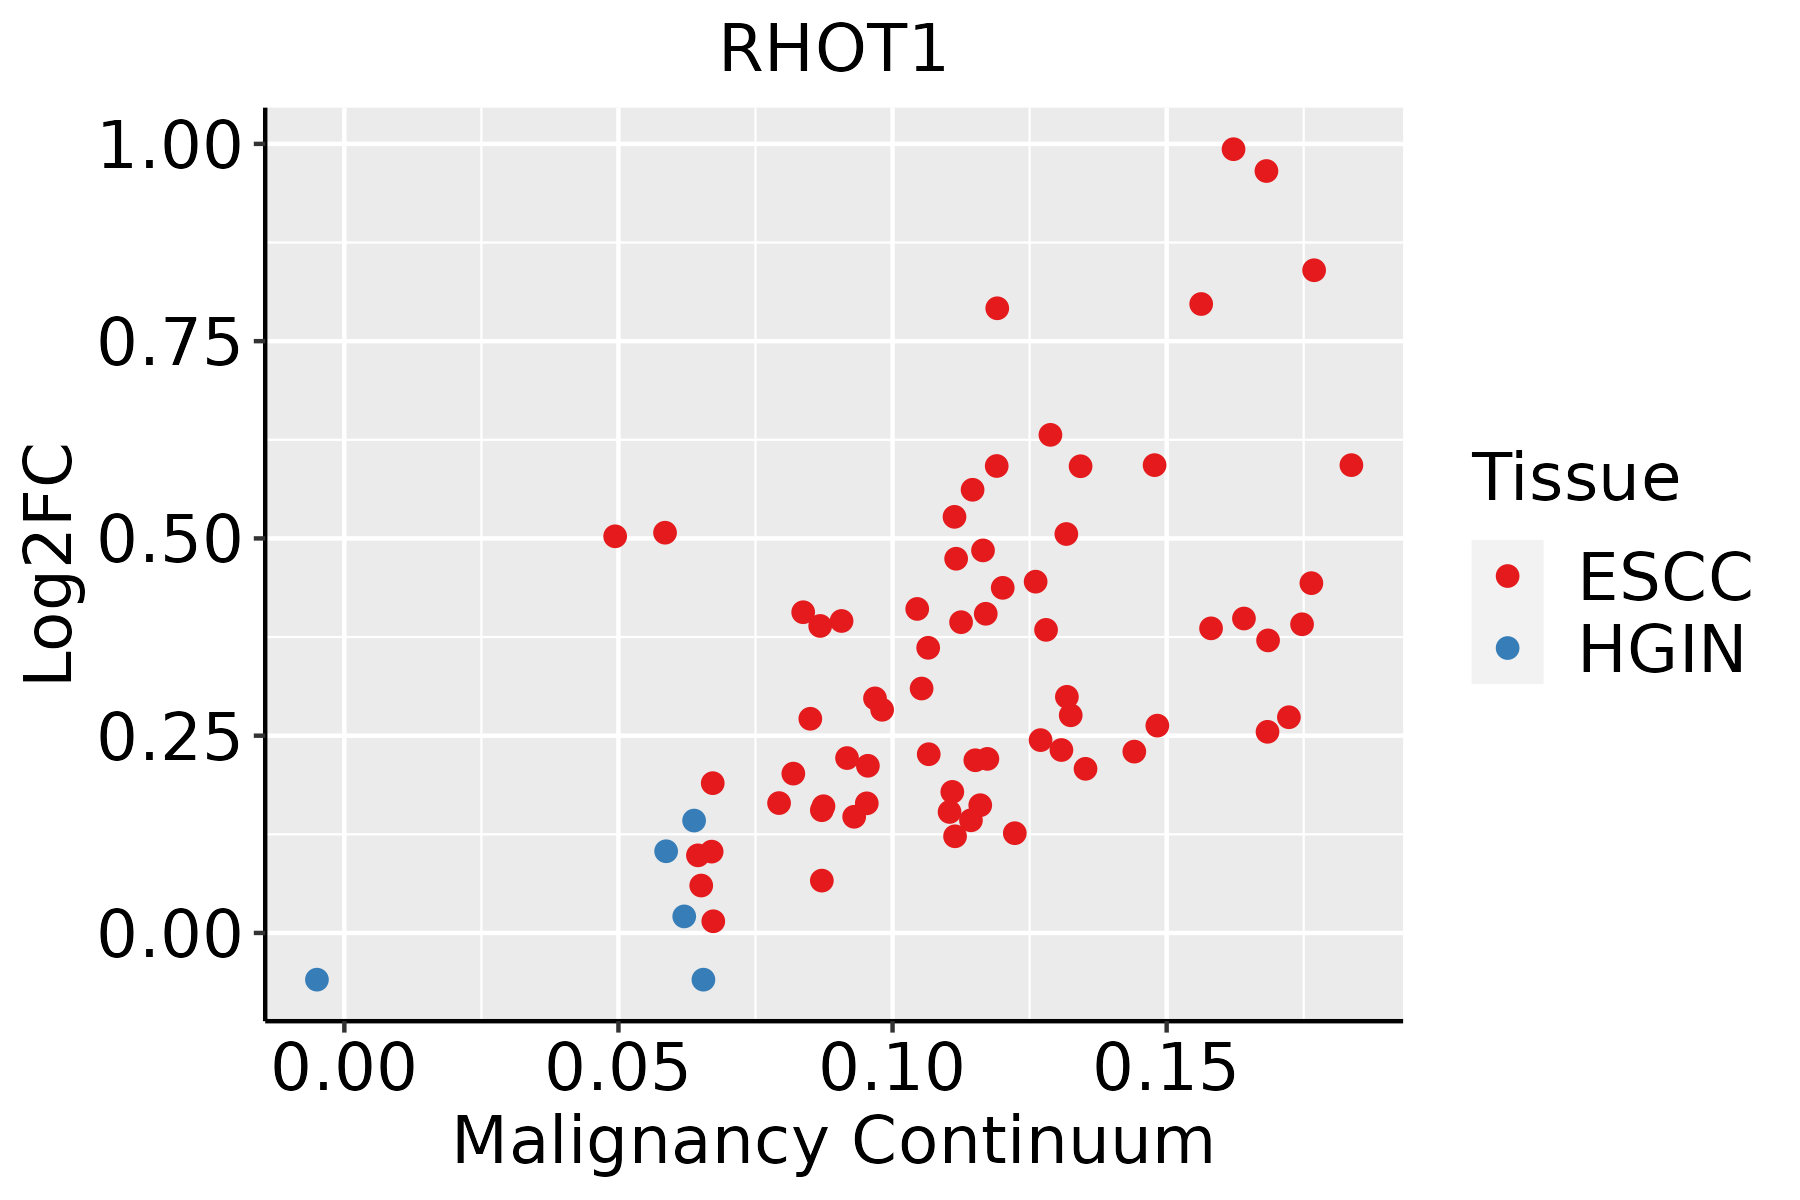 | ESCC: Esophageal squamous cell carcinoma |
| HGIN: High-grade intraepithelial neoplasias | ||
| LGIN: Low-grade intraepithelial neoplasias | ||
| Lung |  | AAH: Atypical adenomatous hyperplasia |
| AIS: Adenocarcinoma in situ | ||
| IAC: Invasive lung adenocarcinoma | ||
| MIA: Minimally invasive adenocarcinoma | ||
| Thyroid |  | ATC: Anaplastic thyroid cancer |
| HT: Hashimoto's thyroiditis | ||
| PTC: Papillary thyroid cancer |
| ∗log2FC in expression of this searched gene in stem-like cells from each diseased tissue sample relative to stem-like cells in normal samples in each tissue plotted against the malignancy continuum. Samples are colored based on if they are from different disease stage. |
Top |
Malignant transformation related pathway analysis |
| Find out the enriched GO biological processes and KEGG pathways involved in transition from healthy to precancer to cancer |
| Tissue | Disease Stage | Enriched GO biological Processes |
| Colorectum | AD |  |
| Colorectum | SER |  |
| Colorectum | MSS |  |
| Colorectum | MSI-H |  |
| Colorectum | FAP |  |
| ∗Top 15 enriched GO BP terms are showed in the bar plot of each disease state in each tissue. Each row represents a significant GO biological process which is colored according to the -log10(p.adjust). |
| Page: 1 2 3 4 5 6 7 8 9 |
| GO ID | Tissue | Disease Stage | Description | Gene Ratio | Bg Ratio | pvalue | p.adjust | Count |
| GO:000683913 | Breast | IDC | mitochondrial transport | 51/1434 | 254/18723 | 1.54e-10 | 1.83e-08 | 51 |
| GO:000863713 | Breast | IDC | apoptotic mitochondrial changes | 27/1434 | 107/18723 | 2.29e-08 | 1.57e-06 | 27 |
| GO:009055913 | Breast | IDC | regulation of membrane permeability | 17/1434 | 78/18723 | 6.88e-05 | 1.40e-03 | 17 |
| GO:000700613 | Breast | IDC | mitochondrial membrane organization | 21/1434 | 116/18723 | 1.78e-04 | 3.00e-03 | 21 |
| GO:004690213 | Breast | IDC | regulation of mitochondrial membrane permeability | 14/1434 | 63/18723 | 2.37e-04 | 3.75e-03 | 14 |
| GO:009734512 | Breast | IDC | mitochondrial outer membrane permeabilization | 9/1434 | 32/18723 | 4.92e-04 | 6.45e-03 | 9 |
| GO:001082113 | Breast | IDC | regulation of mitochondrion organization | 23/1434 | 144/18723 | 5.96e-04 | 7.54e-03 | 23 |
| GO:190571012 | Breast | IDC | positive regulation of membrane permeability | 11/1434 | 48/18723 | 8.22e-04 | 9.65e-03 | 11 |
| GO:003579413 | Breast | IDC | positive regulation of mitochondrial membrane permeability | 10/1434 | 43/18723 | 1.25e-03 | 1.33e-02 | 10 |
| GO:190210812 | Breast | IDC | regulation of mitochondrial membrane permeability involved in apoptotic process | 10/1434 | 45/18723 | 1.80e-03 | 1.74e-02 | 10 |
| GO:190211012 | Breast | IDC | positive regulation of mitochondrial membrane permeability involved in apoptotic process | 9/1434 | 38/18723 | 1.89e-03 | 1.81e-02 | 9 |
| GO:190268612 | Breast | IDC | mitochondrial outer membrane permeabilization involved in programmed cell death | 9/1434 | 40/18723 | 2.76e-03 | 2.42e-02 | 9 |
| GO:000683923 | Breast | DCIS | mitochondrial transport | 51/1390 | 254/18723 | 5.04e-11 | 6.79e-09 | 51 |
| GO:000863722 | Breast | DCIS | apoptotic mitochondrial changes | 27/1390 | 107/18723 | 1.19e-08 | 8.75e-07 | 27 |
| GO:009055922 | Breast | DCIS | regulation of membrane permeability | 17/1390 | 78/18723 | 4.66e-05 | 9.63e-04 | 17 |
| GO:000700622 | Breast | DCIS | mitochondrial membrane organization | 21/1390 | 116/18723 | 1.16e-04 | 2.03e-03 | 21 |
| GO:004690222 | Breast | DCIS | regulation of mitochondrial membrane permeability | 14/1390 | 63/18723 | 1.71e-04 | 2.84e-03 | 14 |
| GO:001082122 | Breast | DCIS | regulation of mitochondrion organization | 23/1390 | 144/18723 | 3.86e-04 | 5.36e-03 | 23 |
| GO:009734521 | Breast | DCIS | mitochondrial outer membrane permeabilization | 9/1390 | 32/18723 | 3.91e-04 | 5.40e-03 | 9 |
| GO:190571021 | Breast | DCIS | positive regulation of membrane permeability | 11/1390 | 48/18723 | 6.34e-04 | 7.92e-03 | 11 |
| Page: 1 2 3 4 5 |
| Pathway ID | Tissue | Disease Stage | Description | Gene Ratio | Bg Ratio | pvalue | p.adjust | qvalue | Count |
| hsa0413723 | Breast | IDC | Mitophagy - animal | 17/867 | 72/8465 | 7.61e-04 | 6.04e-03 | 4.52e-03 | 17 |
| hsa0413733 | Breast | IDC | Mitophagy - animal | 17/867 | 72/8465 | 7.61e-04 | 6.04e-03 | 4.52e-03 | 17 |
| hsa0413742 | Breast | DCIS | Mitophagy - animal | 17/846 | 72/8465 | 5.75e-04 | 4.42e-03 | 3.26e-03 | 17 |
| hsa0413752 | Breast | DCIS | Mitophagy - animal | 17/846 | 72/8465 | 5.75e-04 | 4.42e-03 | 3.26e-03 | 17 |
| hsa04137210 | Esophagus | ESCC | Mitophagy - animal | 54/4205 | 72/8465 | 9.33e-06 | 4.96e-05 | 2.54e-05 | 54 |
| hsa0413738 | Esophagus | ESCC | Mitophagy - animal | 54/4205 | 72/8465 | 9.33e-06 | 4.96e-05 | 2.54e-05 | 54 |
| hsa0413722 | Lung | AIS | Mitophagy - animal | 18/961 | 72/8465 | 8.86e-04 | 7.11e-03 | 4.55e-03 | 18 |
| hsa0413732 | Lung | AIS | Mitophagy - animal | 18/961 | 72/8465 | 8.86e-04 | 7.11e-03 | 4.55e-03 | 18 |
| Page: 1 |
Top |
Cell-cell communication analysis |
| Identification of potential cell-cell interactions between two cell types and their ligand-receptor pairs for different disease states |
| Ligand | Receptor | LRpair | Pathway | Tissue | Disease Stage |
| Page: 1 |
Top |
Single-cell gene regulatory network inference analysis |
| Find out the significant the regulons (TFs) and the target genes of each regulon across cell types for different disease states |
| TF | Cell Type | Tissue | Disease Stage | Target Gene | RSS | Regulon Activity |
| ∗The dot plots of a searched regulon are shown for all cell subpopulations in each disease state of each tissue based on the regulon specific score inferred using pySCENIC and by calculating the average expression. |
| Page: 1 |
Top |
Somatic mutation of malignant transformation related genes |
| Annotation of somatic variants for genes involved in malignant transformation |
| Hugo Symbol | Variant Class | Variant Classification | dbSNP RS | HGVSc | HGVSp | HGVSp Short | SWISSPROT | BIOTYPE | SIFT | PolyPhen | Tumor Sample Barcode | Tissue | Histology | Sex | Age | Stage | Therapy Types | Drugs | Outcome |
| RHOT1 | SNV | Missense_Mutation | c.271G>A | p.Asp91Asn | p.D91N | Q8IXI2 | protein_coding | tolerated(0.07) | benign(0.031) | TCGA-A8-A09G-01 | Breast | breast invasive carcinoma | Female | >=65 | III/IV | Unknown | Unknown | SD | |
| RHOT1 | SNV | Missense_Mutation | c.690N>T | p.Lys230Asn | p.K230N | Q8IXI2 | protein_coding | deleterious(0) | probably_damaging(0.962) | TCGA-AN-A046-01 | Breast | breast invasive carcinoma | Female | >=65 | I/II | Unknown | Unknown | SD | |
| RHOT1 | SNV | Missense_Mutation | c.854N>G | p.Glu285Gly | p.E285G | Q8IXI2 | protein_coding | deleterious(0) | possibly_damaging(0.562) | TCGA-BH-A0HA-01 | Breast | breast invasive carcinoma | Female | <65 | I/II | Unknown | Unknown | SD | |
| RHOT1 | SNV | Missense_Mutation | c.115N>C | p.Glu39Gln | p.E39Q | Q8IXI2 | protein_coding | deleterious(0) | probably_damaging(0.986) | TCGA-BH-A18P-01 | Breast | breast invasive carcinoma | Female | <65 | I/II | Unknown | Unknown | PD | |
| RHOT1 | SNV | Missense_Mutation | c.1795N>C | p.Glu599Gln | p.E599Q | Q8IXI2 | protein_coding | tolerated_low_confidence(0.55) | benign(0.023) | TCGA-D8-A1Y0-01 | Breast | breast invasive carcinoma | Female | >=65 | III/IV | Chemotherapy | cyclophosphamide+methotrexatum+fluorouracillum | SD | |
| RHOT1 | SNV | Missense_Mutation | novel | c.41N>T | p.Arg14Ile | p.R14I | Q8IXI2 | protein_coding | deleterious(0.03) | benign(0.037) | TCGA-LL-A73Y-01 | Breast | breast invasive carcinoma | Female | >=65 | I/II | Chemotherapy | taxotere | SD |
| RHOT1 | SNV | Missense_Mutation | novel | c.82N>C | p.Glu28Gln | p.E28Q | Q8IXI2 | protein_coding | deleterious(0.03) | probably_damaging(0.967) | TCGA-C5-A8XJ-01 | Cervix | cervical & endocervical cancer | Female | >=65 | I/II | Chemotherapy | cisplatin | SD |
| RHOT1 | SNV | Missense_Mutation | novel | c.664N>A | p.Ala222Thr | p.A222T | Q8IXI2 | protein_coding | tolerated(0.18) | benign(0.053) | TCGA-EA-A3HU-01 | Cervix | cervical & endocervical cancer | Female | <65 | I/II | Unknown | Unknown | SD |
| RHOT1 | SNV | Missense_Mutation | c.727N>A | p.Asp243Asn | p.D243N | Q8IXI2 | protein_coding | tolerated(0.2) | benign(0.017) | TCGA-Q1-A73O-01 | Cervix | cervical & endocervical cancer | Female | <65 | I/II | Chemotherapy | cisplatin | CR | |
| RHOT1 | SNV | Missense_Mutation | c.979N>T | p.Asp327Tyr | p.D327Y | Q8IXI2 | protein_coding | deleterious(0.03) | benign(0.213) | TCGA-AA-A02R-01 | Colorectum | colon adenocarcinoma | Female | >=65 | I/II | Unknown | Unknown | PD |
| Page: 1 2 3 4 5 6 |
Top |
Related drugs of malignant transformation related genes |
| Identification of chemicals and drugs interact with genes involved in malignant transfromation |
| (DGIdb 4.0) |
| Entrez ID | Symbol | Category | Interaction Types | Drug Claim Name | Drug Name | PMIDs |
| Page: 1 |

Copyright 2023-Present -The University of Texas Health Science Center at Houston |